Looking at Call Drop Rates and Their Implications
Dropped calls occur when a customer is waiting on the phone to connect to an agent, but does not want to wait any longer and therefore disconnects. For any successful call center operation, whether inbound or outbound, dropped calls are to be avoided or at least minimized. Furthermore, for outbound calling, dropped calls are usually regulated, meaning that an operation must adhere to keeping dropped calls below a threshold (for example, no more than 3%). As we can see, dropped calls are not good for business no matter what angle we look at them from.
So, how do we avoid dropped calls? By having enough agents to handle every call, ideally.
But we know well that ideal situations are rare, certainly hard to predict, and often prohibitively expensive. So, one task of a call center manager is to figure out the best way to keep dropped rates low (efficacy) while minimizing resources required to do so (efficiency).
In general, a call is dropped by a customer when the amount of time that the customer is willing to wait to connect to an agent has passed. Which is why we observe and manage customer wait times when trying to figure out how to control dropped call rates, or abandon rates.
In a call center operation we observe both customer and agent wait times. To avoid confusion we refer to the customer wait time as the Holding Time, and reserve Waiting Time for the time that an agent waits for a call (the agent is idle).
Since holding times correlate to abandon rates, we adjust operational parameters to account for the average holding times observed, trying to reach and maintain acceptable rates. In other words, we look for central tendencies, trying to summarize the typical value for holding times, and continuously making corresponding configuration adjustments to target optimal holding times that minimize dropped rates and resource needs at the same time.
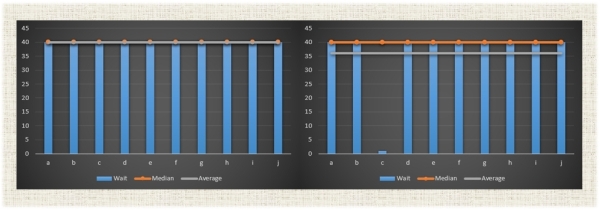
In summary, average holding times provide an assessment of operating parameters and indicate whether we need to fine-tune them. But relying solely on averages could lead us to inaccurate assessments because the average (arithmetic mean) does not always tell the full story, particularly when a few outliers skew it. For example, and just for illustration purposes, let’s say that we have ten calls and each of these calls had a holding time of 40 seconds. In that case, the average is 40, and the median is also 40, which combined provide a very good indicator of what is happening. But what if one of those holding times (and just one) was 1 second instead of 40 seconds, then the average would go down to 36 while the median stays at 40, in which case using the average as the only guide would be misleading. For the reason it is important to look beyond just a single indicator and rather look more carefully at the whole data and relevant graphs before using an average to fine-tune operation parameters.
Under the premise that calls are dropped primarily because of long holding times, the solution is, obviously, to increase the speed to answer. This applies to both inbound and outbound calls, but for each case the mechanics defer somehow. That is mostly because for inbound calls you do not control the number or frequency of calls arriving, while for outbound calls you decide the number of calls and the speed to dial out. In both cases, however, the speed to answer is affected by both the number of calls and the number of agents available at any one time, in addition to the average time to handle a call (service time).
For the case of inbound calls, prediction focuses on how many customers could potentially call. Using information from historical data we can determine how long an agent typically takes to service a calling customer, and then assign enough lines and agents so the queue of customers on hold (waiting) never grows beyond the desired threshold. Keep in mind that the determination of this threshold, the maximum number of callers to be on hold at any one time, needs to account for the maximum acceptable holding time for any one contact in order to make sure that a caller moves up the queue and gets connected with an agent before that holding time is exceeded.
In the case of outbound calls, prediction relies heavily on how many contacts that are called actually answer. If every contact that is called always answers, prediction is simplified; but that is not typically the case. The number of agents and lines used per agent, therefore, must account for number of contacts to be called, how many of those are expected to answer the call, and how long it typically takes to handle calls that were answered.
If the outbound operation is set up so to only call a contact if an agent is readily available, then there is no holding time for a called contact to connect to an agent. The drawback is that this could result in either too many agents idle (waiting) for too long (low efficiency), or fewer contacts called (low efficacy). If the nature of the operation is conducive to this type of scenario, a predictive outbound calling mode could be considered, where additional calls to contacts are attempted while agents are potentially still handling other calls, with the expectation that some of these additional call attempts do not reach an actual contact and/or the agent will free up in time to take the next call. This model needs careful observation and fine-tuning to avoid the situation where a contact answers the call and have to hold while waiting to be connected to an agent, to avoid the contact dropping the call. Or at least avoid long holding times or too many of these occurrences.
In summary, too low a number of agents or too many lines per agent could result in long holding times hence many dropped calls. Too many agents or not enough lines may result in a high agent wait time (idle) and not enough call attempts. Observation must be constant and corrective measures must be taken accordingly, therefore, to reach desired targets and maintain acceptable KPIs.
To dig deeper into how to optimize your call center patterns, consider researching waiting line models and queuing theory models. These scientifically proved models aim to optimize KPIs, reduction of staffing costs, improvement of guest satisfaction, and more.
Check back with us constantly as we write more about concepts, ideas, and strategies that we are sure to make you think about how to make your business even better. See you again soon!


