DialedIn provides a number of ‘live’ dashboards that feed authorized managers and supervisors views of ongoing live data on agents, call activity, and more.
Each dashboard focuses on a specific view of the operation, allowing each operational manager to look for what matters the most to them.
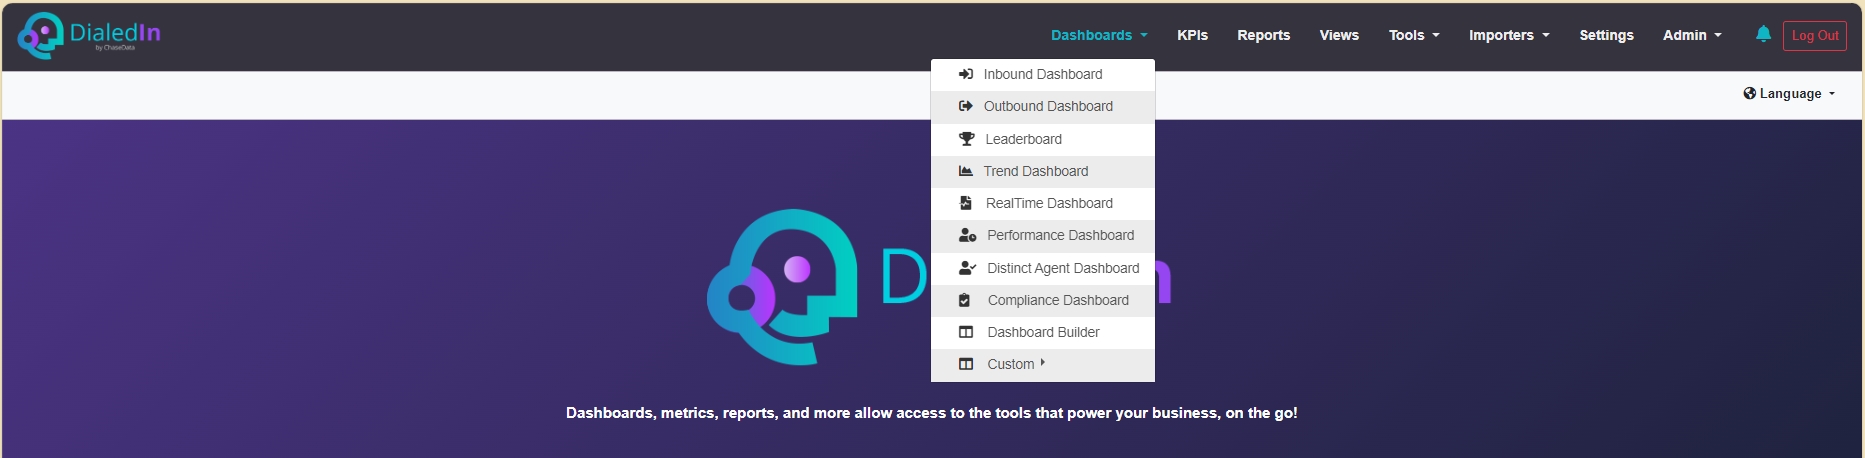
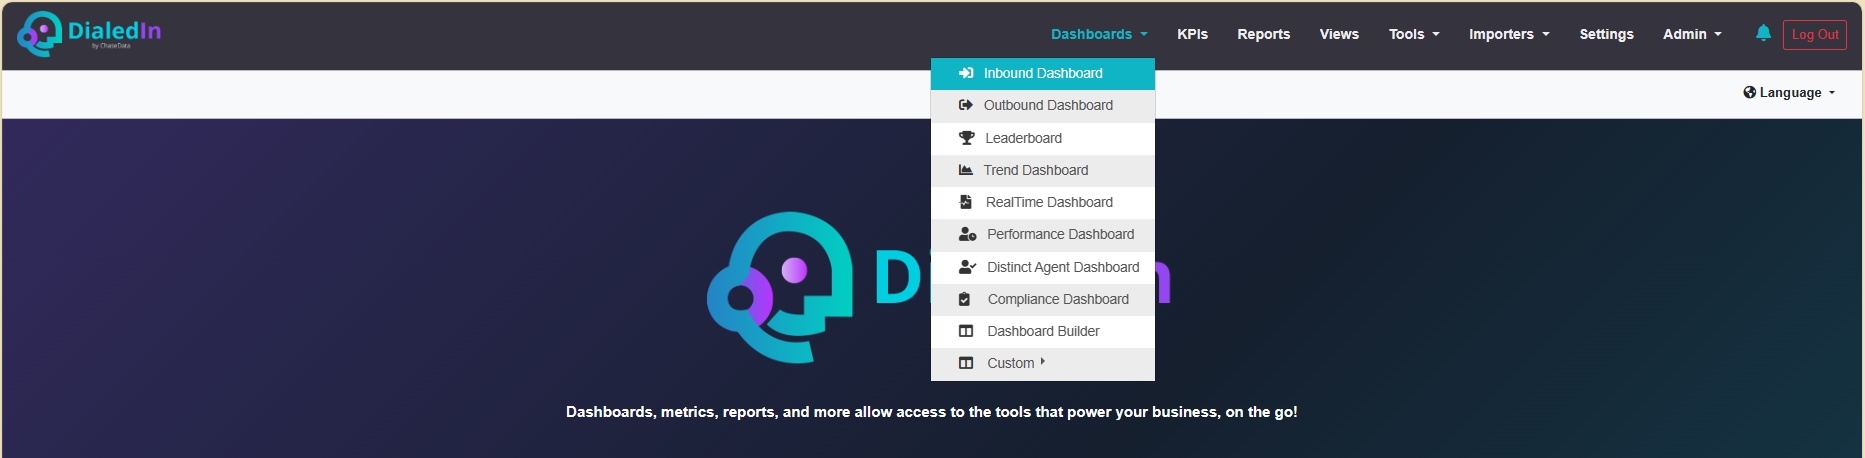
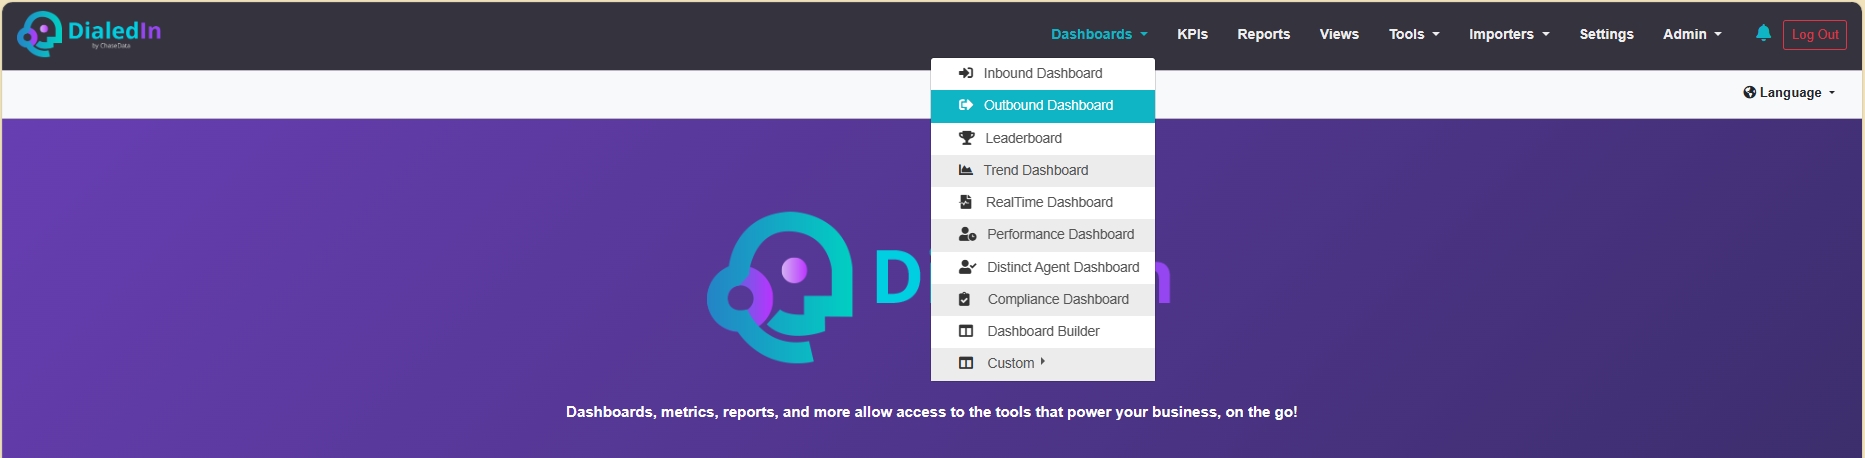
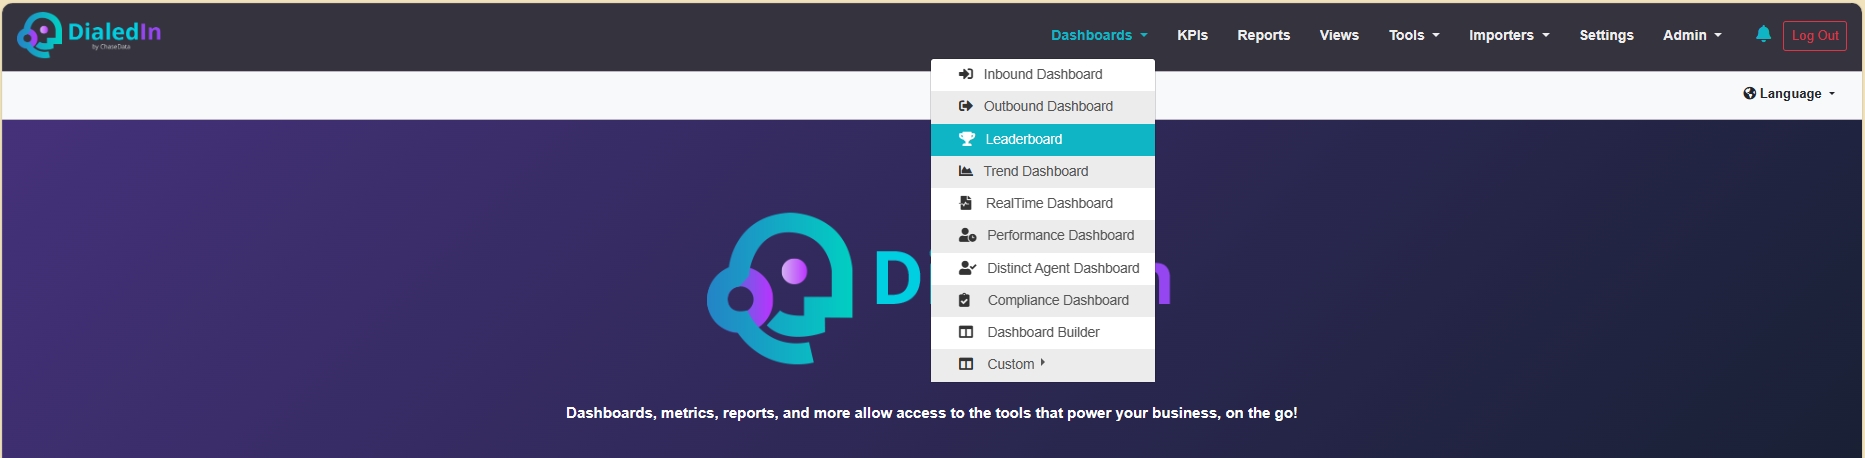
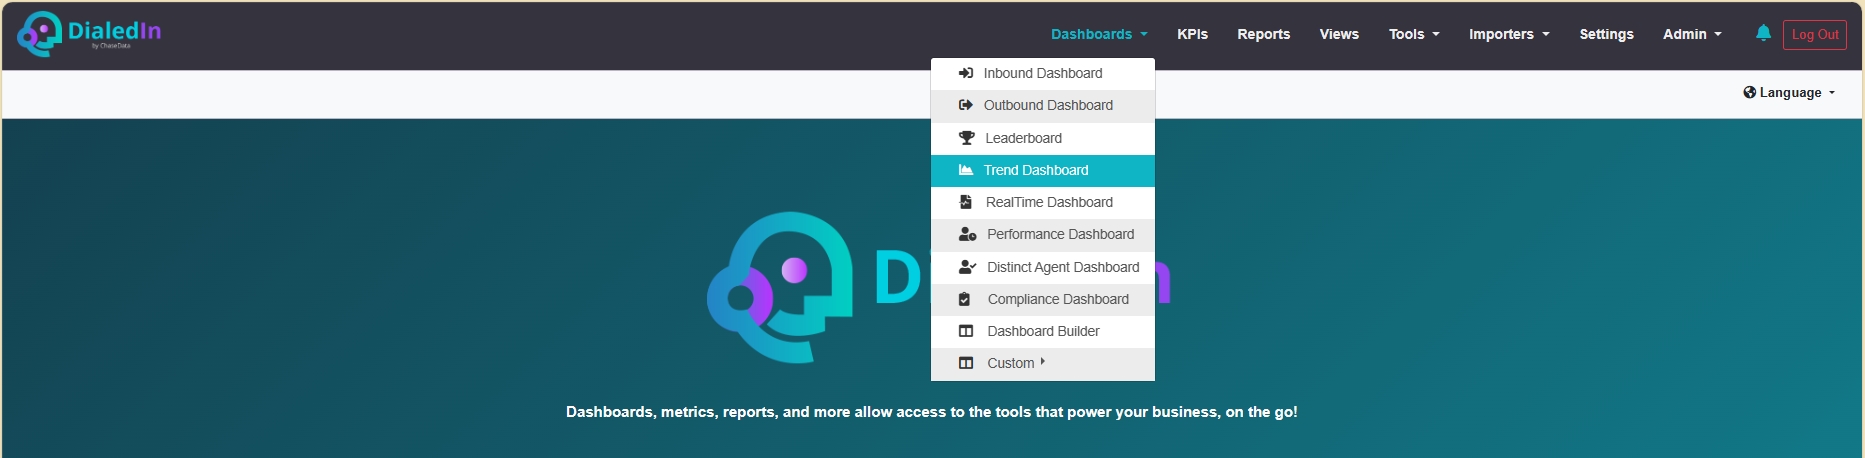
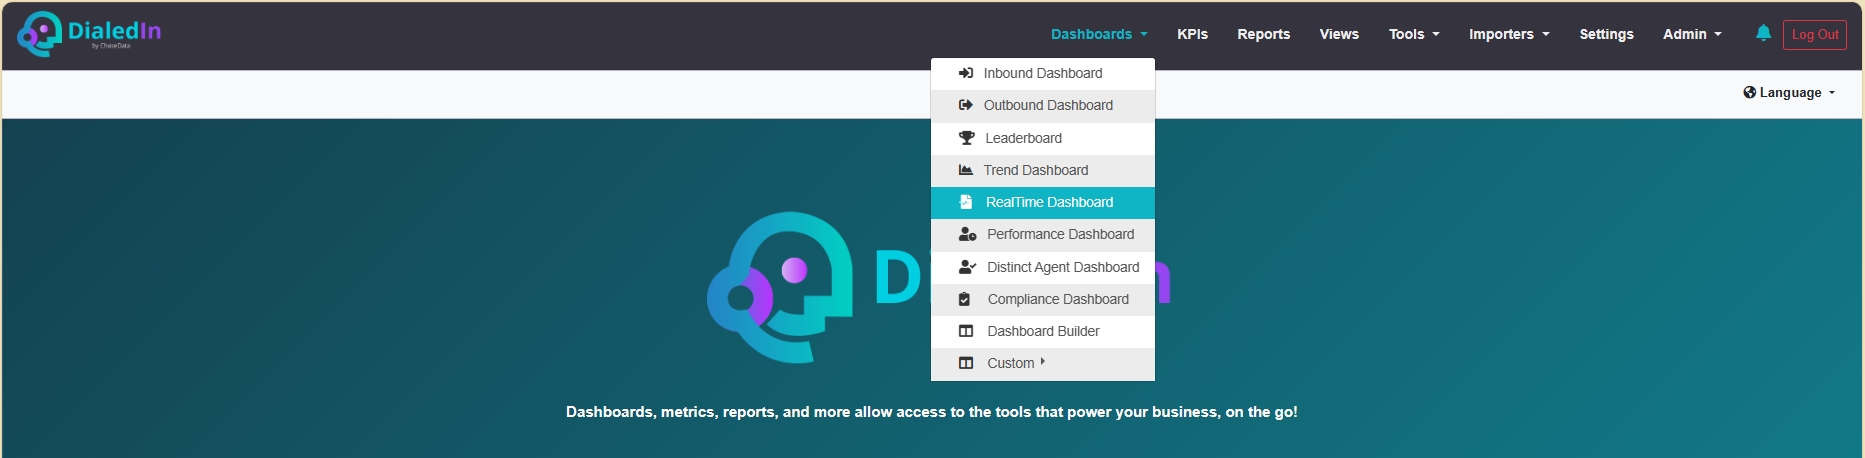
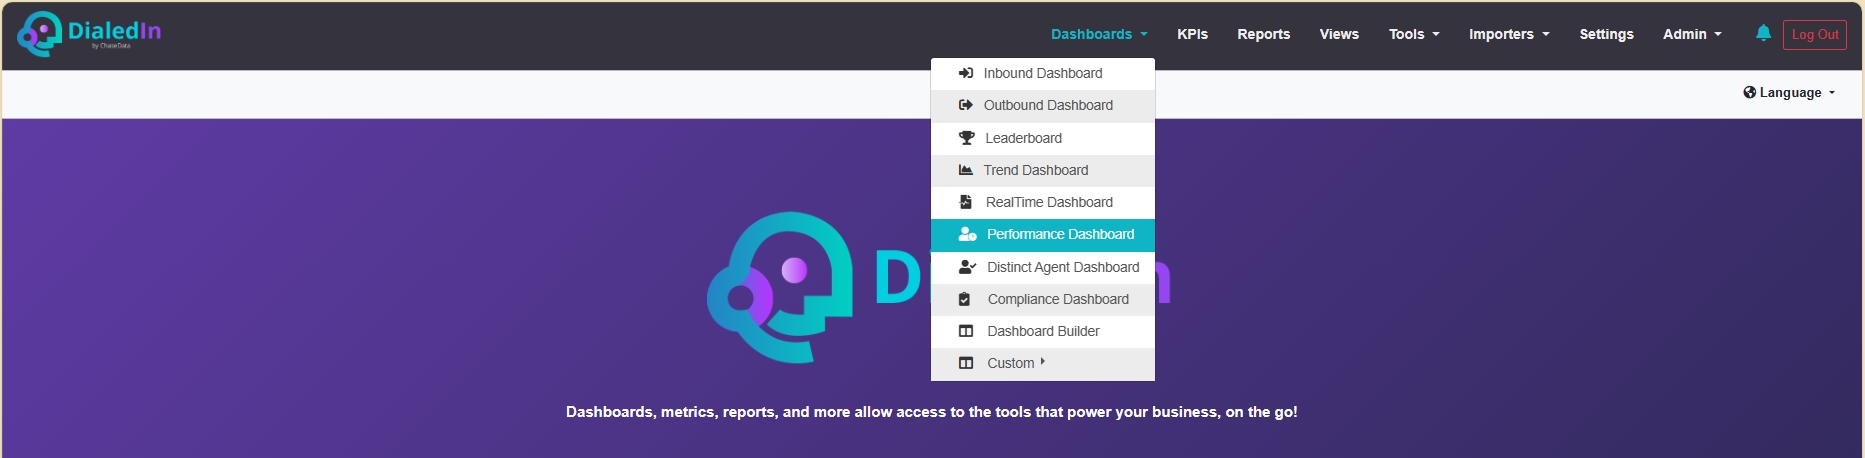
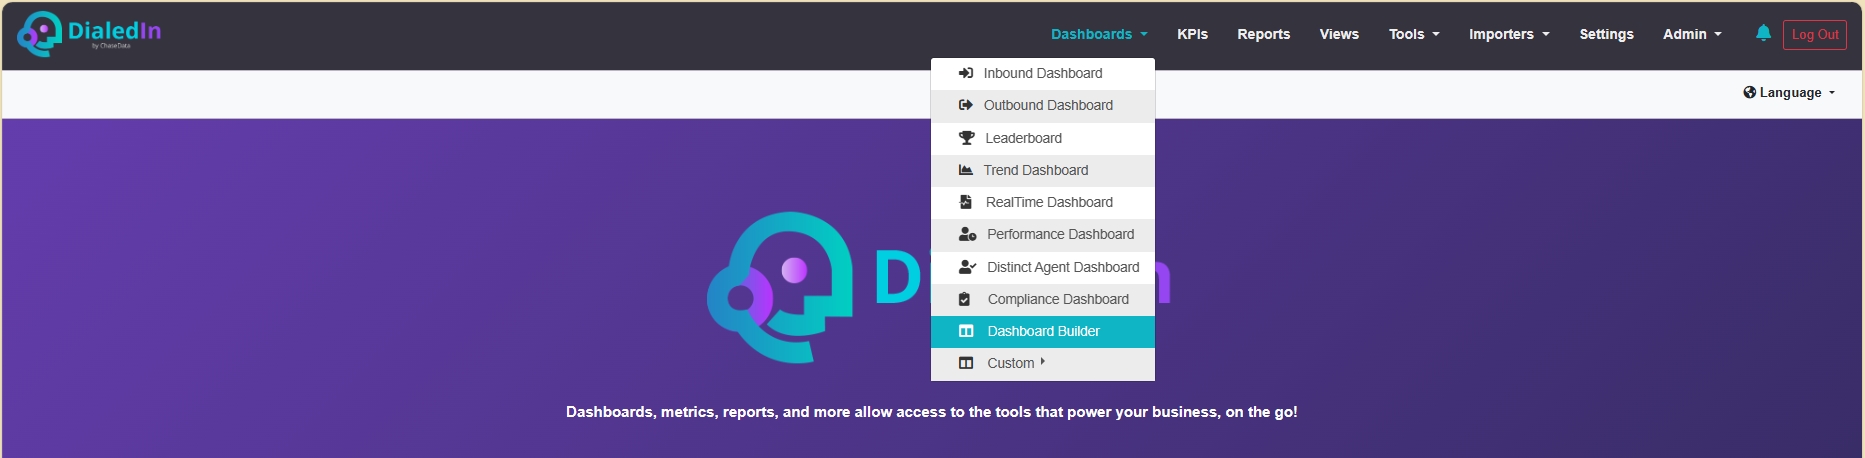
In the following sub-sections, we provide a summary description of each of these dashboards. Each is accessed by pulling down the Dashboard menu and selecting accordingly. Refer to the following picture.
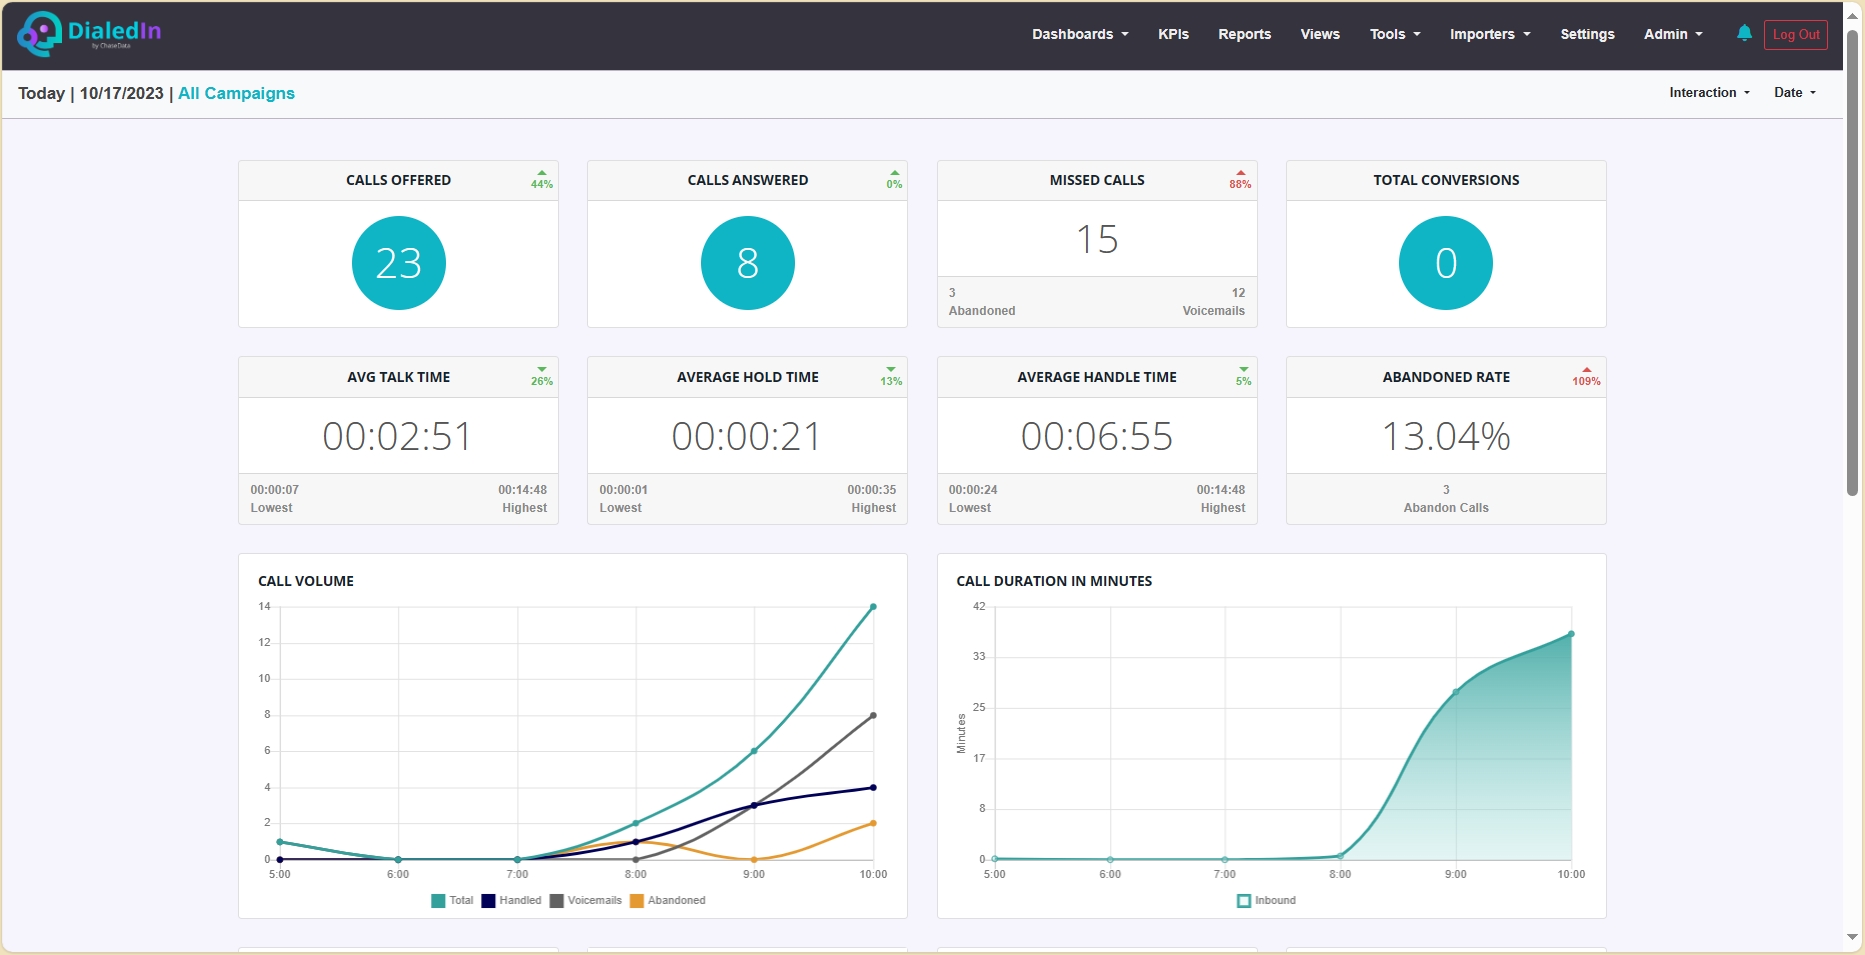
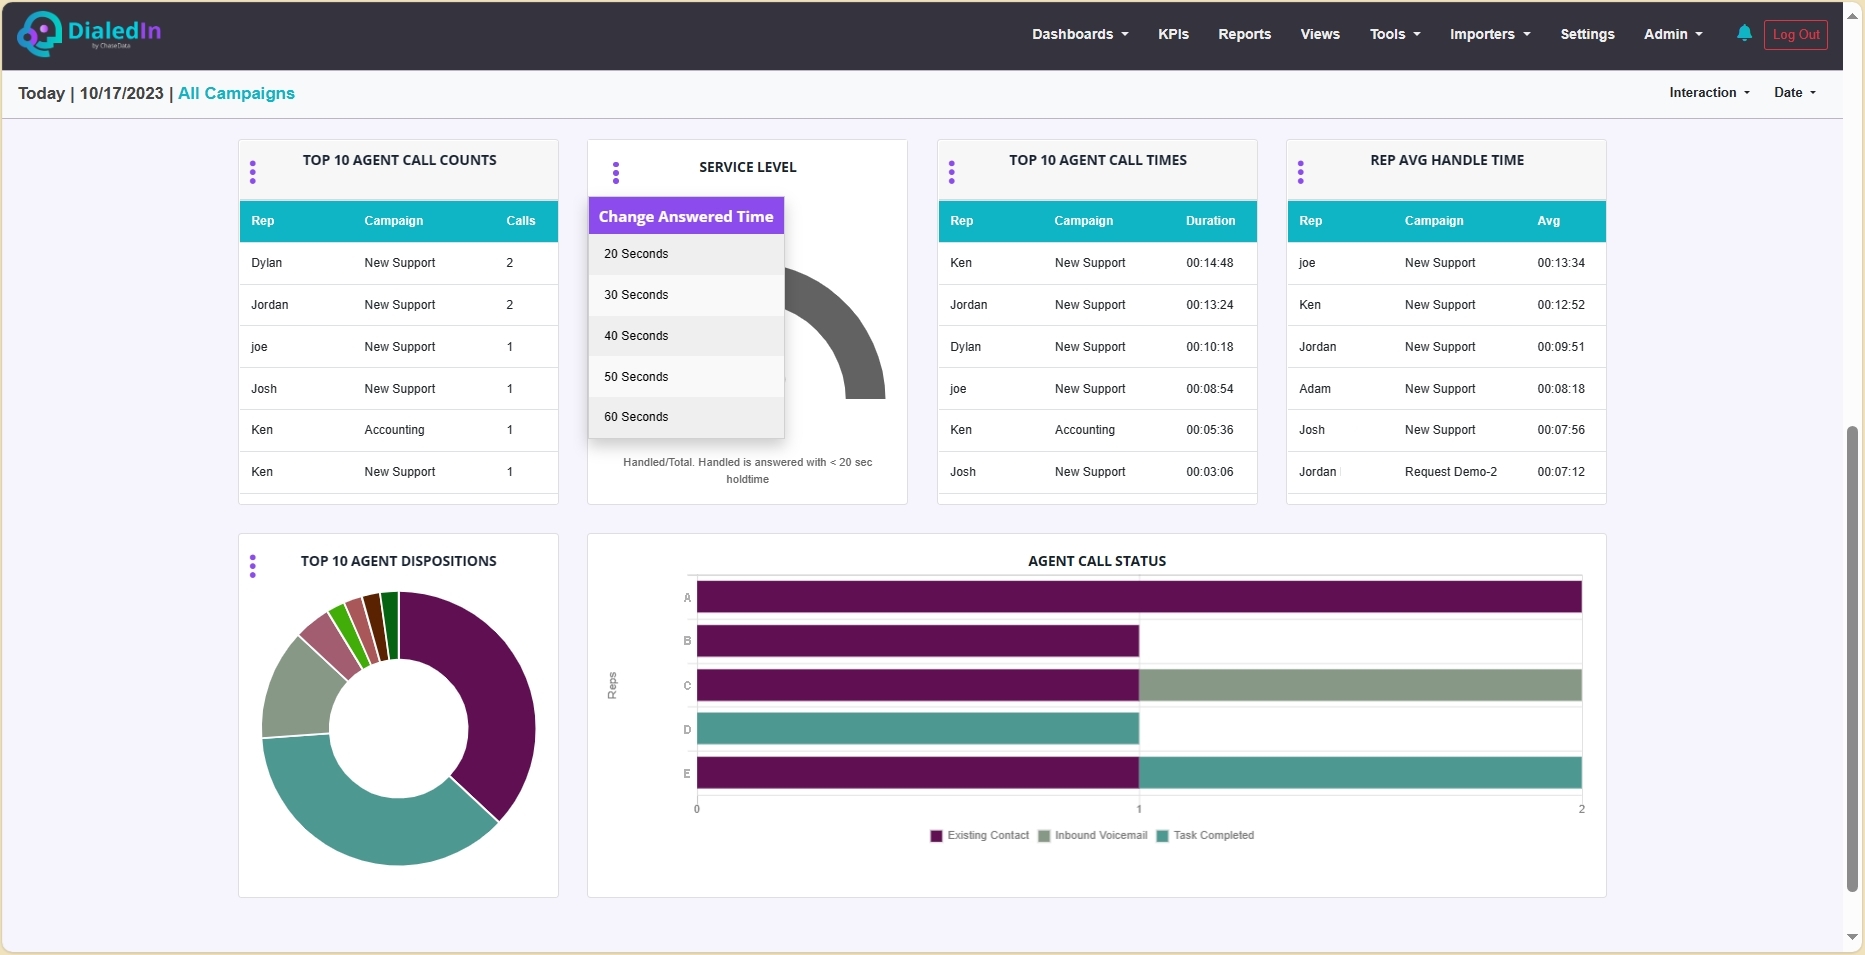
This dashboard provides live (near-real-time) information on the call center’s inbound operations.
By default, this dashboard's Interaction is set to All Campaigns, but can be changed to one or more available campaigns using the Interaction pull-down menu. Similarly, the Date is set to Today by default, which can also be changed using the Date pull-down menu.
It includes key call-related counts and averages, as well as graphic representations of volume and duration distributions.
Charts of agent service level indicators provide a snapshot of their efficiency servicing incoming calls, from call counts, to call disposition distribution, to time on calls and handling times.
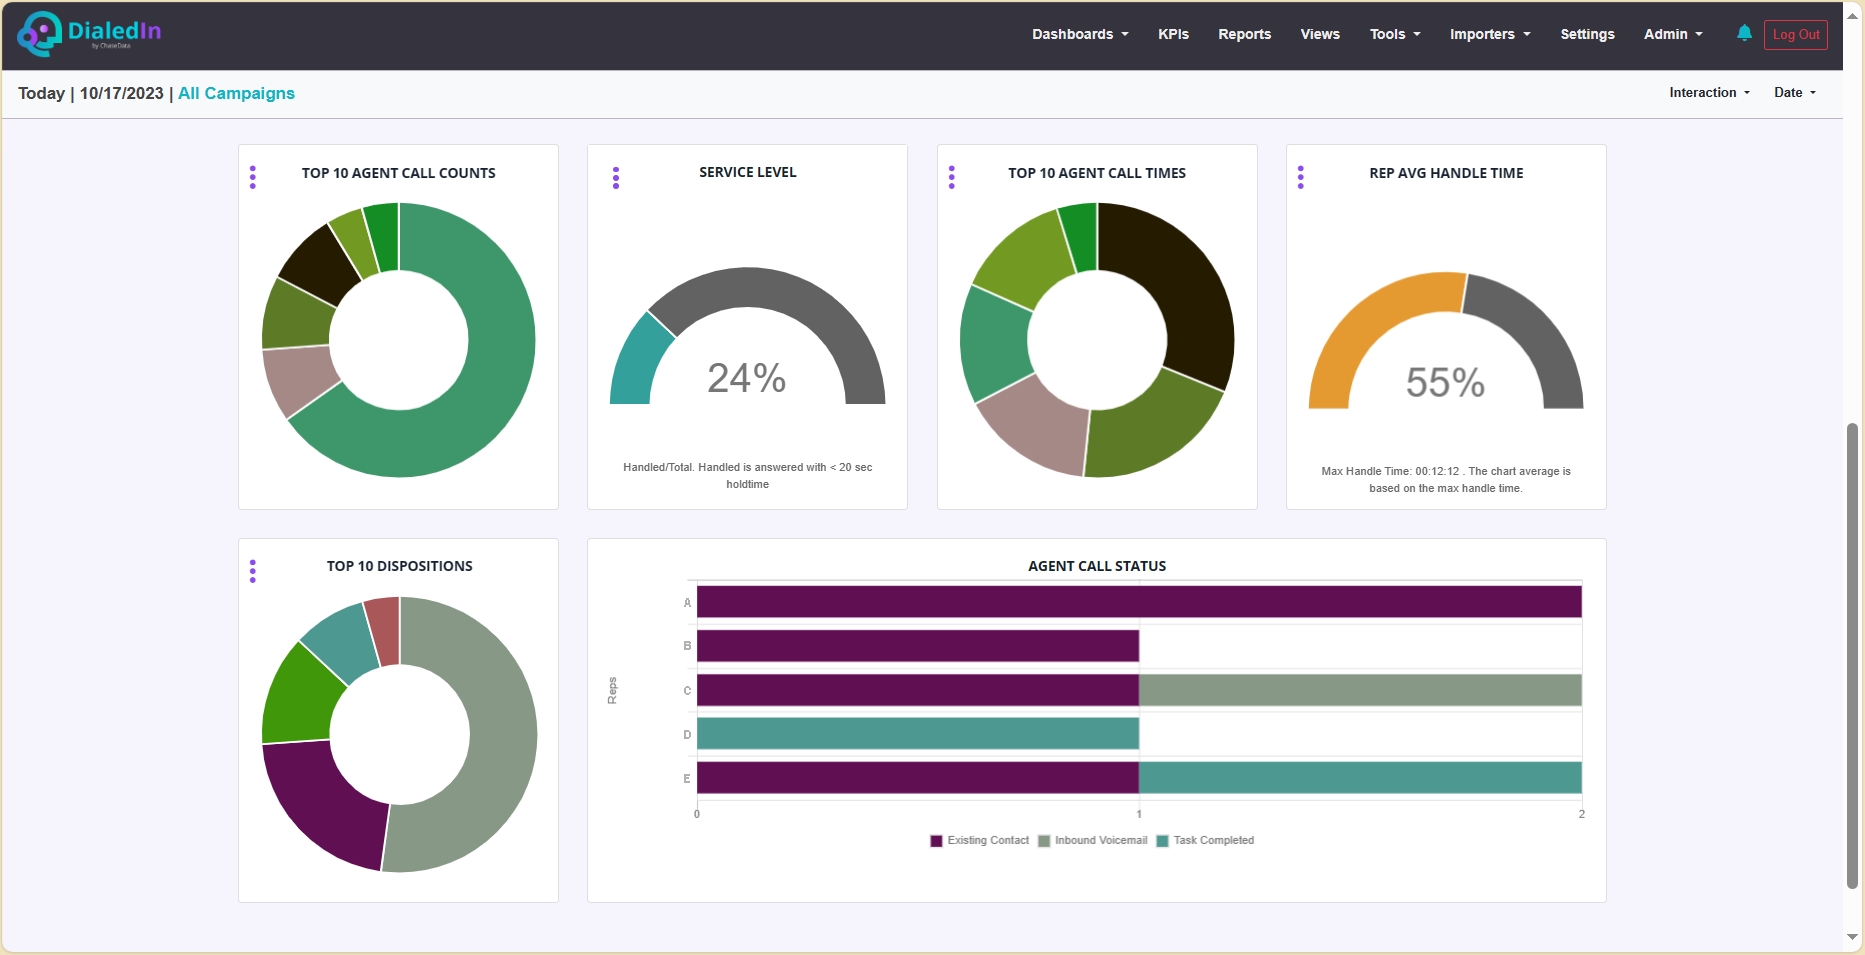
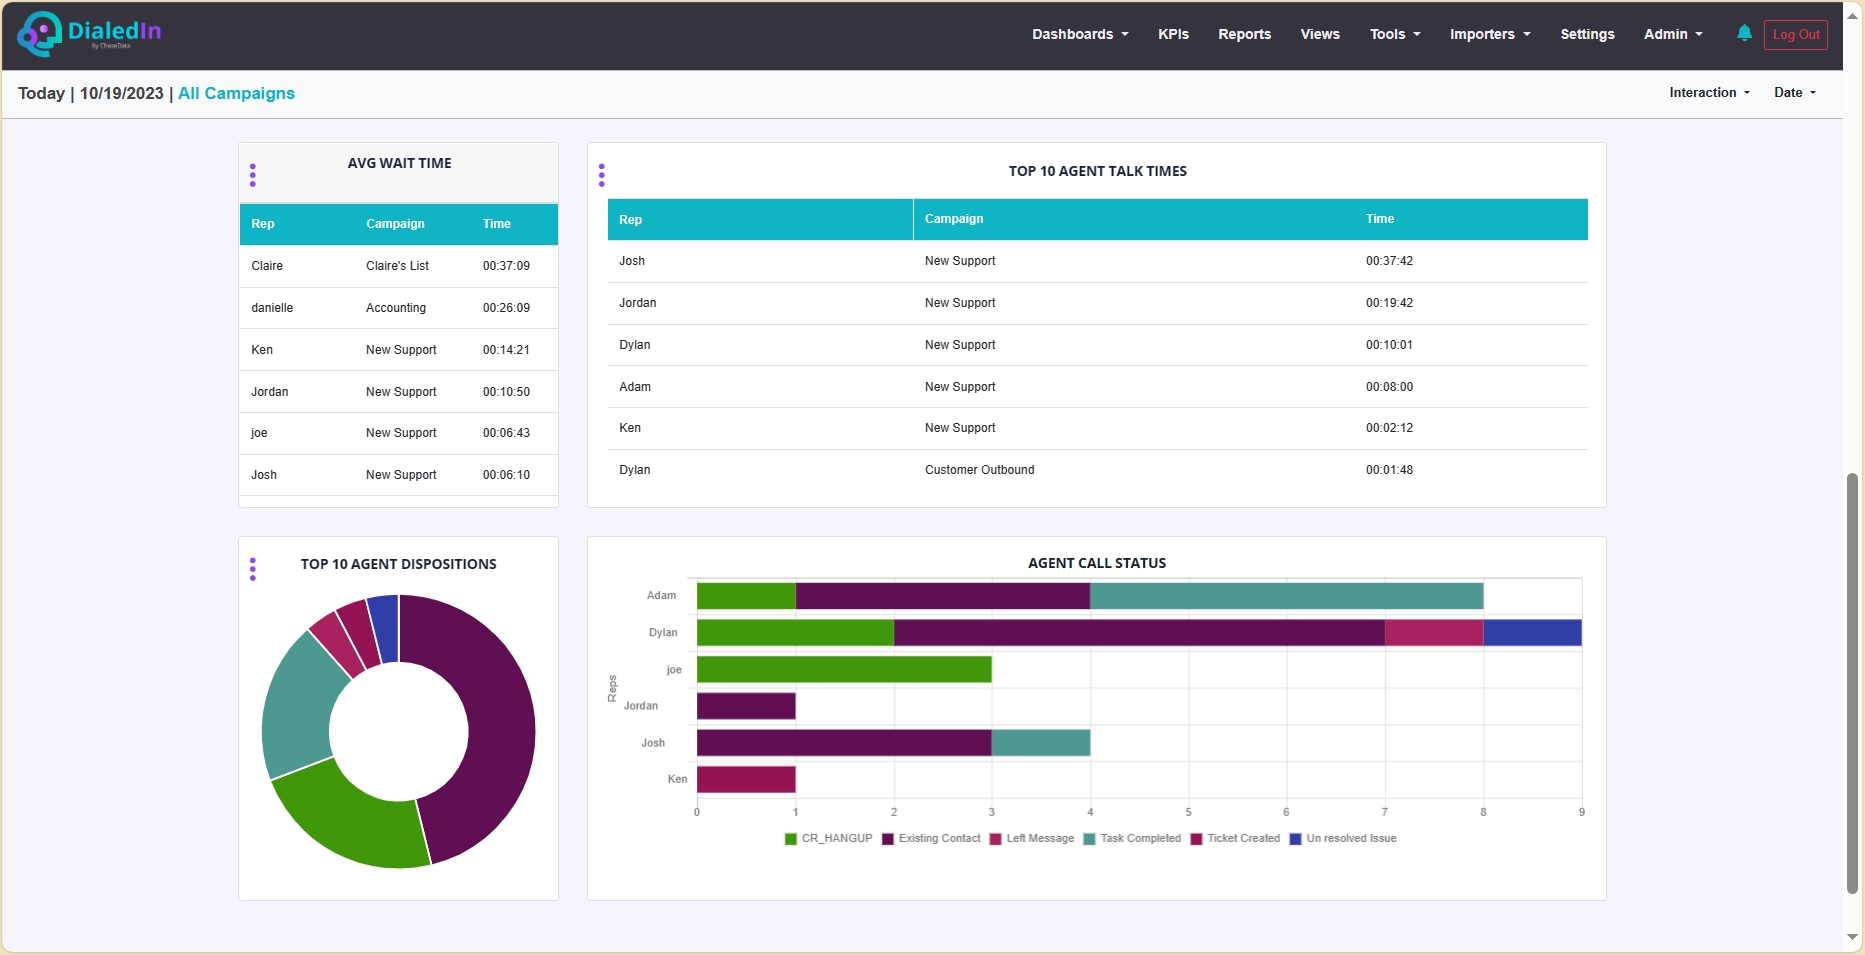
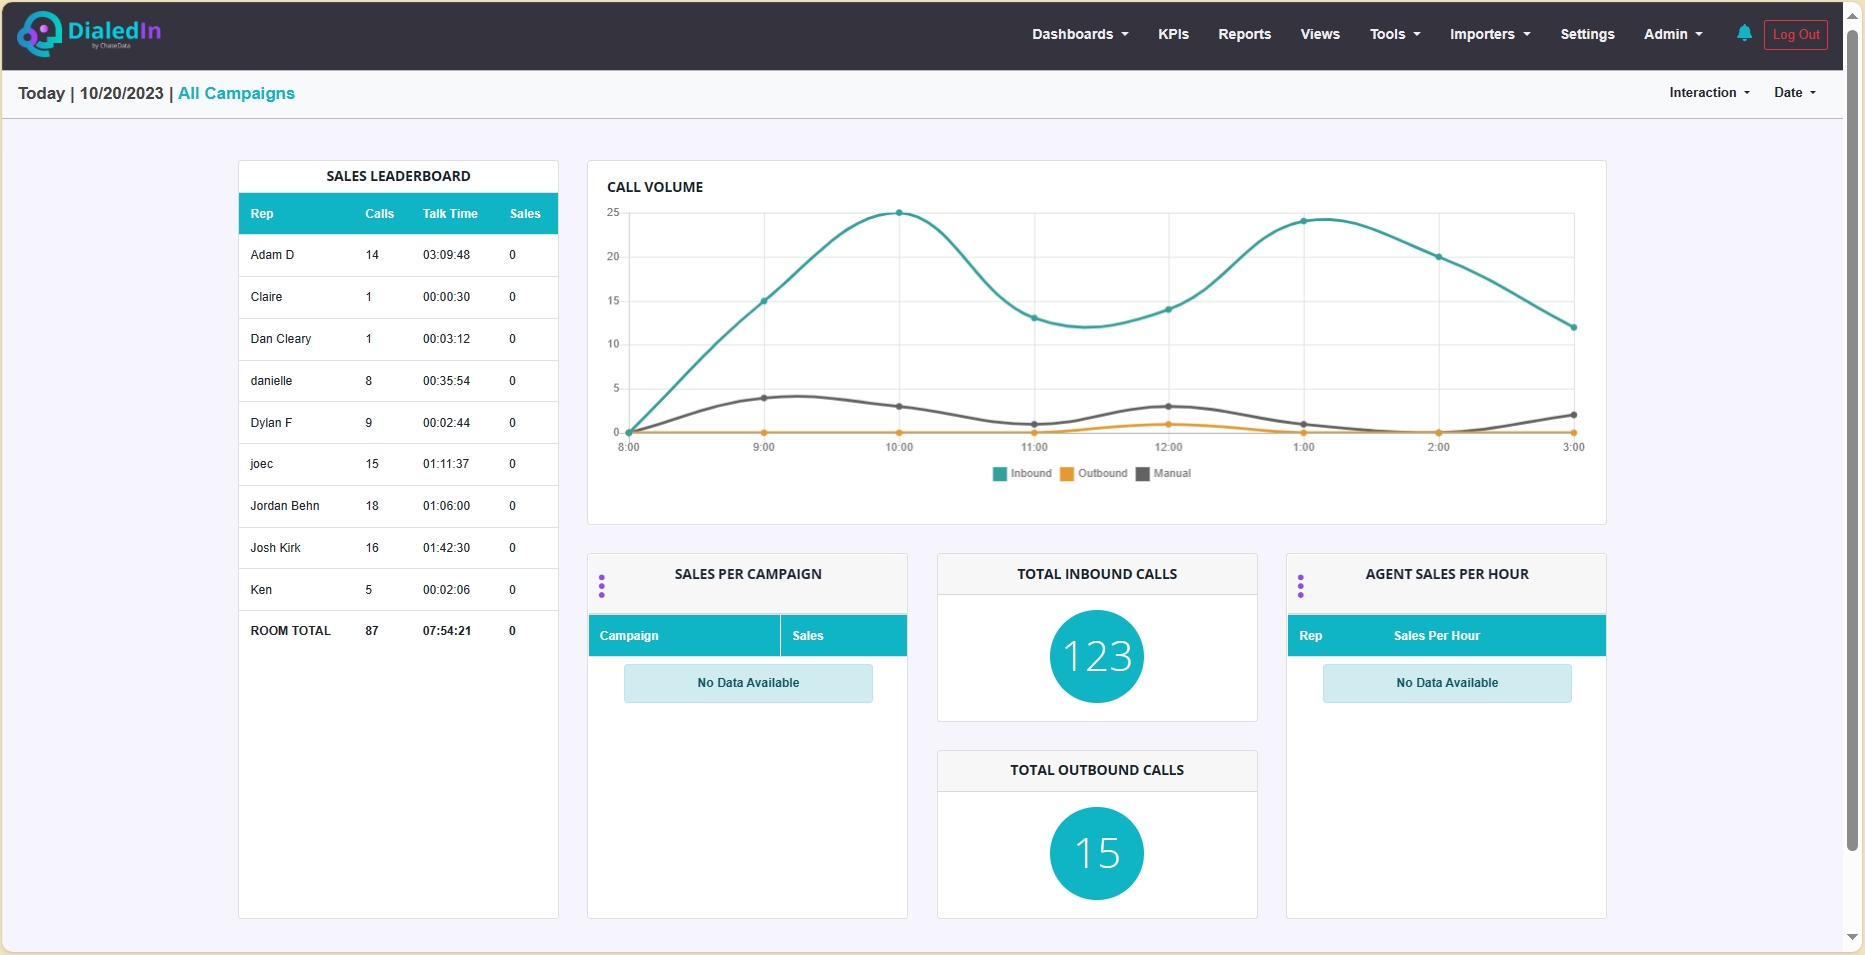
Some of the graphs can be toggled to show the information in a table or list format that provides specific numbers.
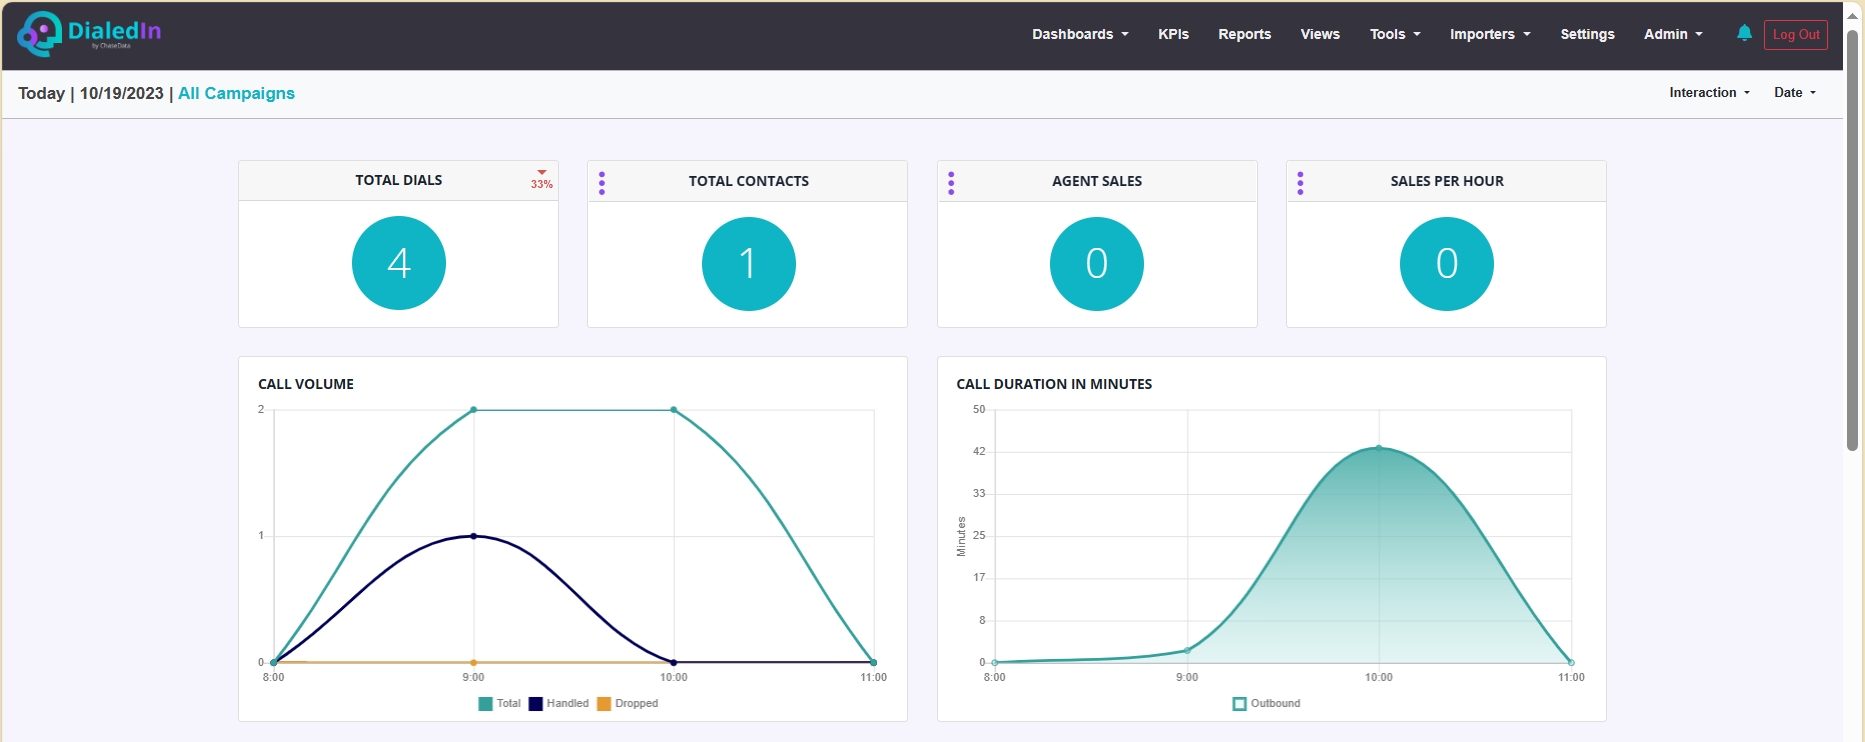
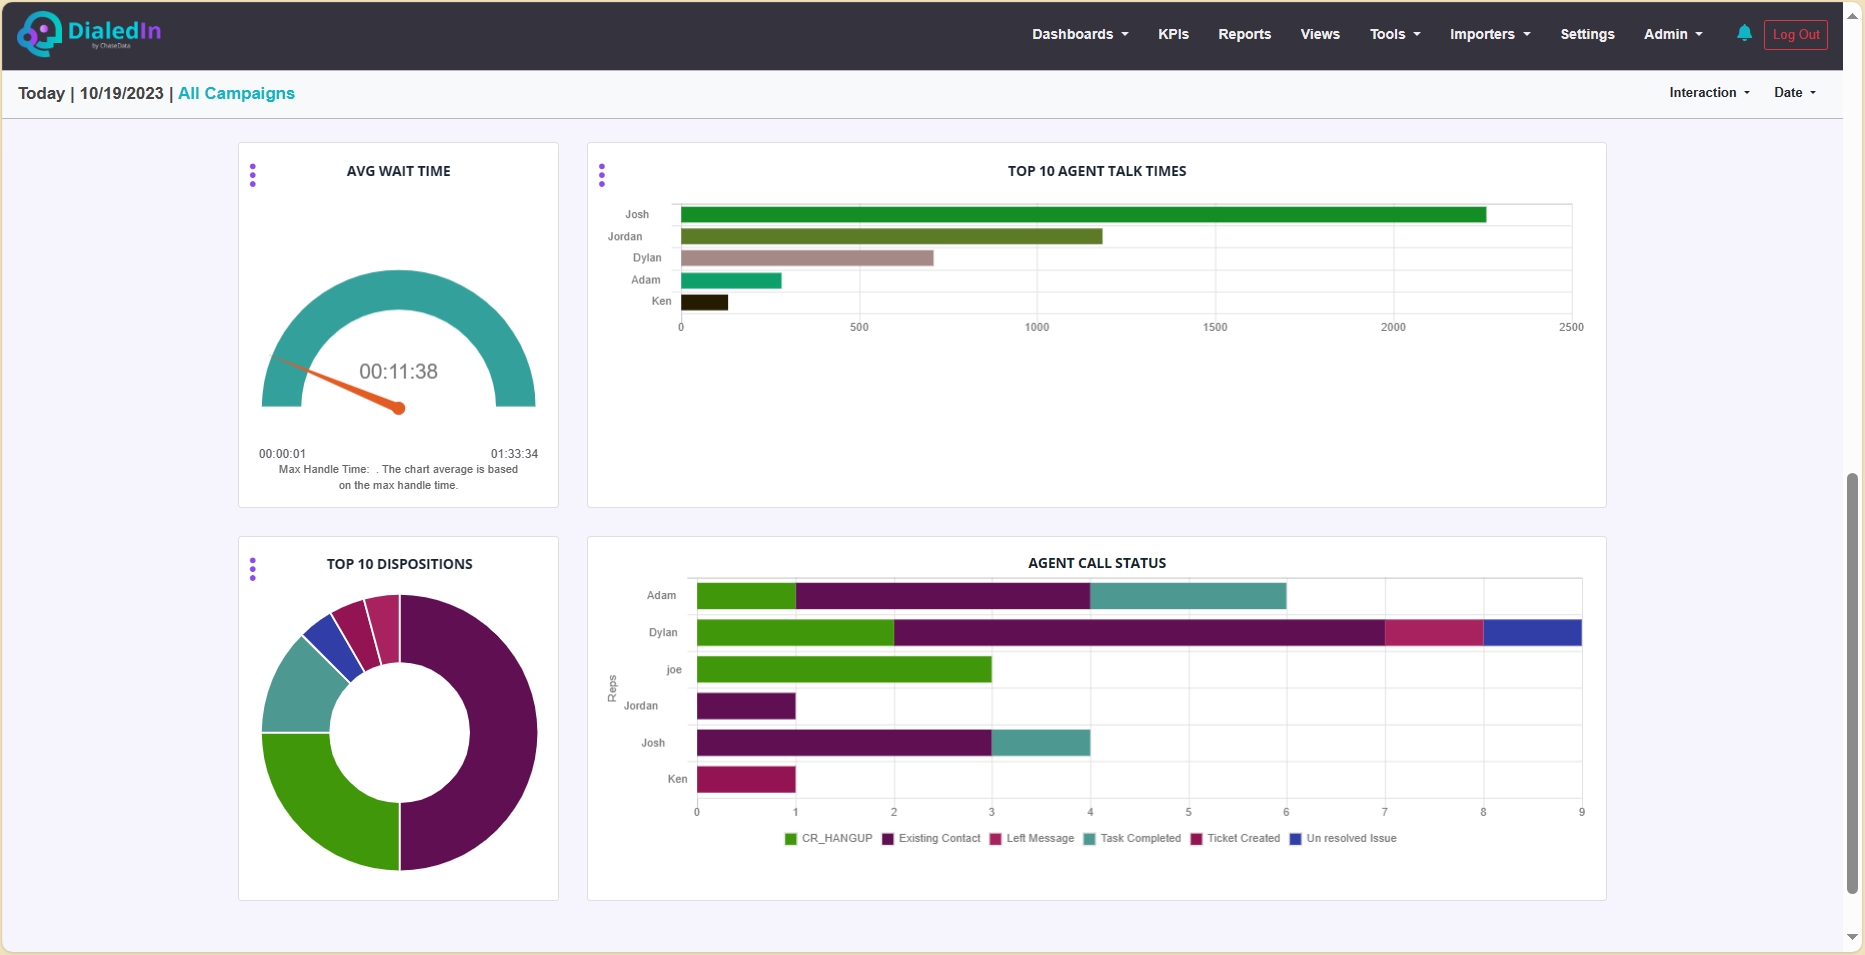
This dashboard provides live (near-real-time) information on the call center's outbound operations.
By default, this dashboard's Interaction is set to All Campaigns, but can be changed to one or more available campaigns using the Interaction pull-down menu. Similarly, the Date is set to Today by default, which can also be changed using the Date pull-down menu.
It includes important indicators about calls made (outbound) and success rates such as how many calls reached the intended person (contact) or even resulted in a positive action with the contact (sale). Graphic representations of call volume and duration distributions.
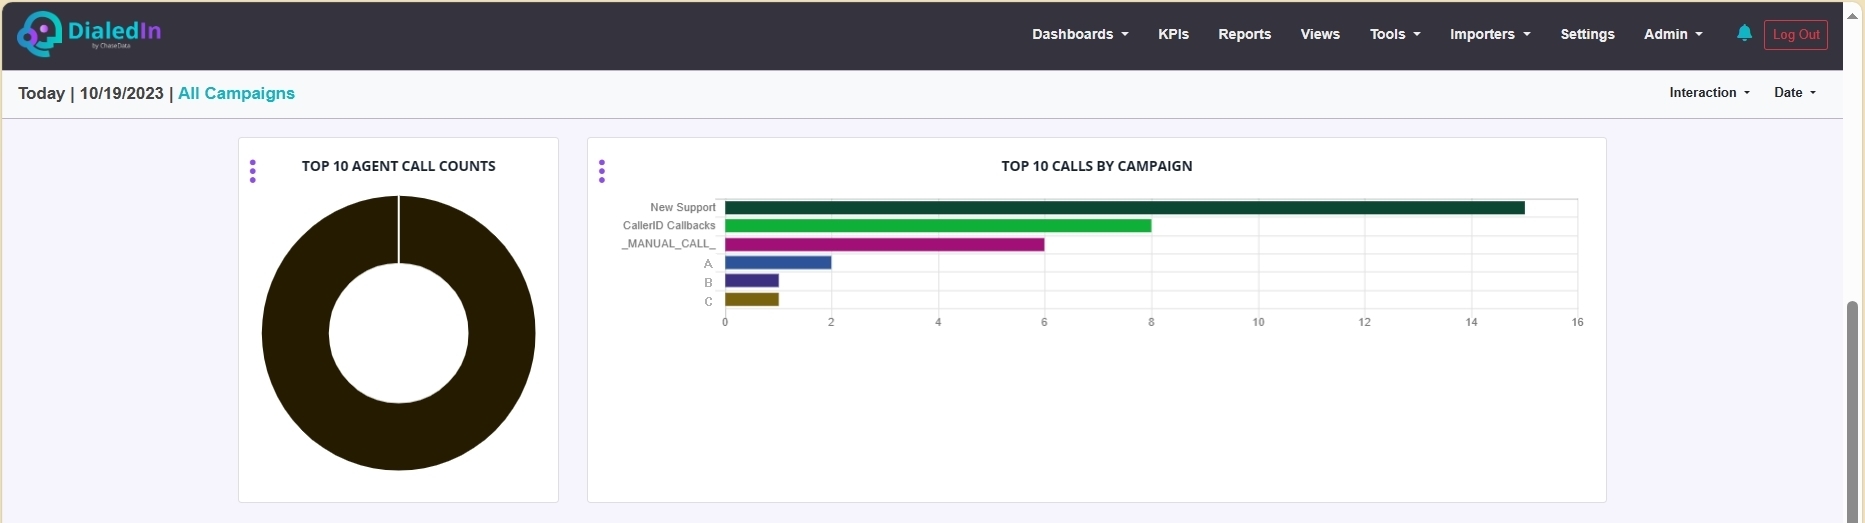
Call distribution among agents, campaigns, and call dispositions can also be observed, by default in graphic form, but can be toggled to table form, as well.
Refer to the following pictures.
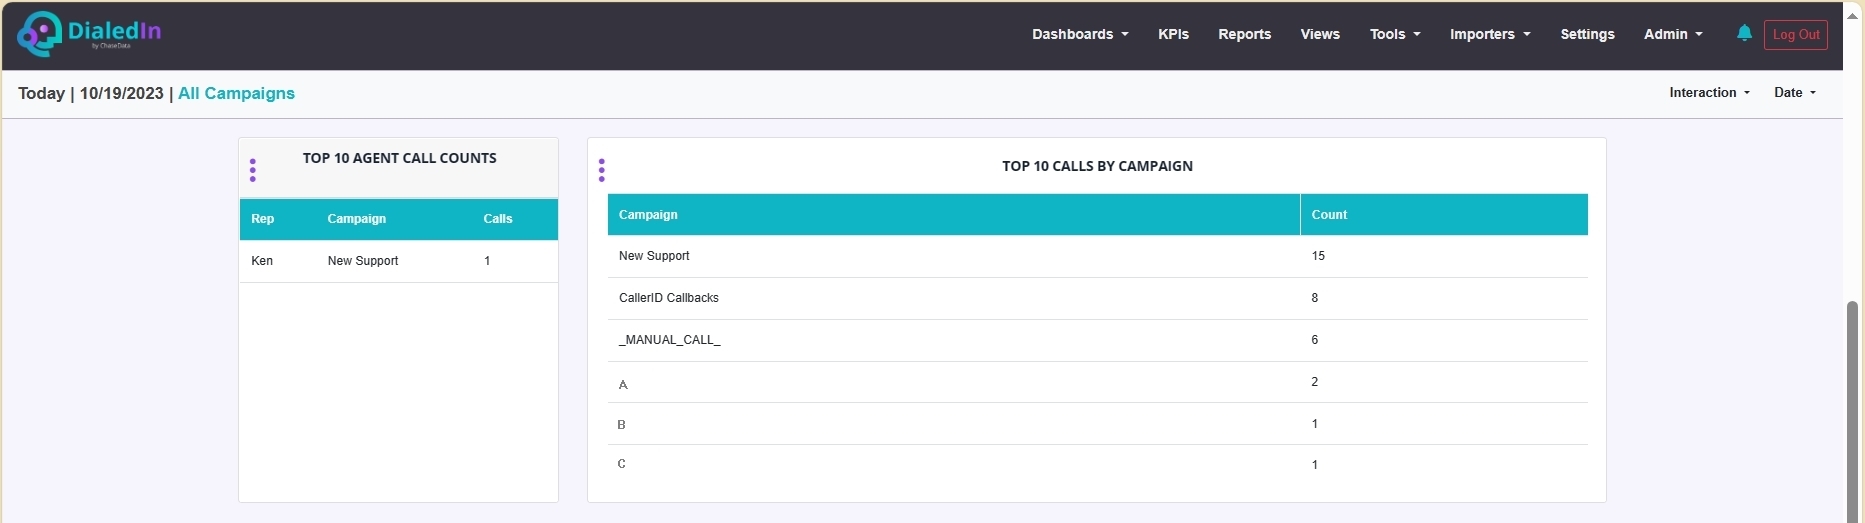
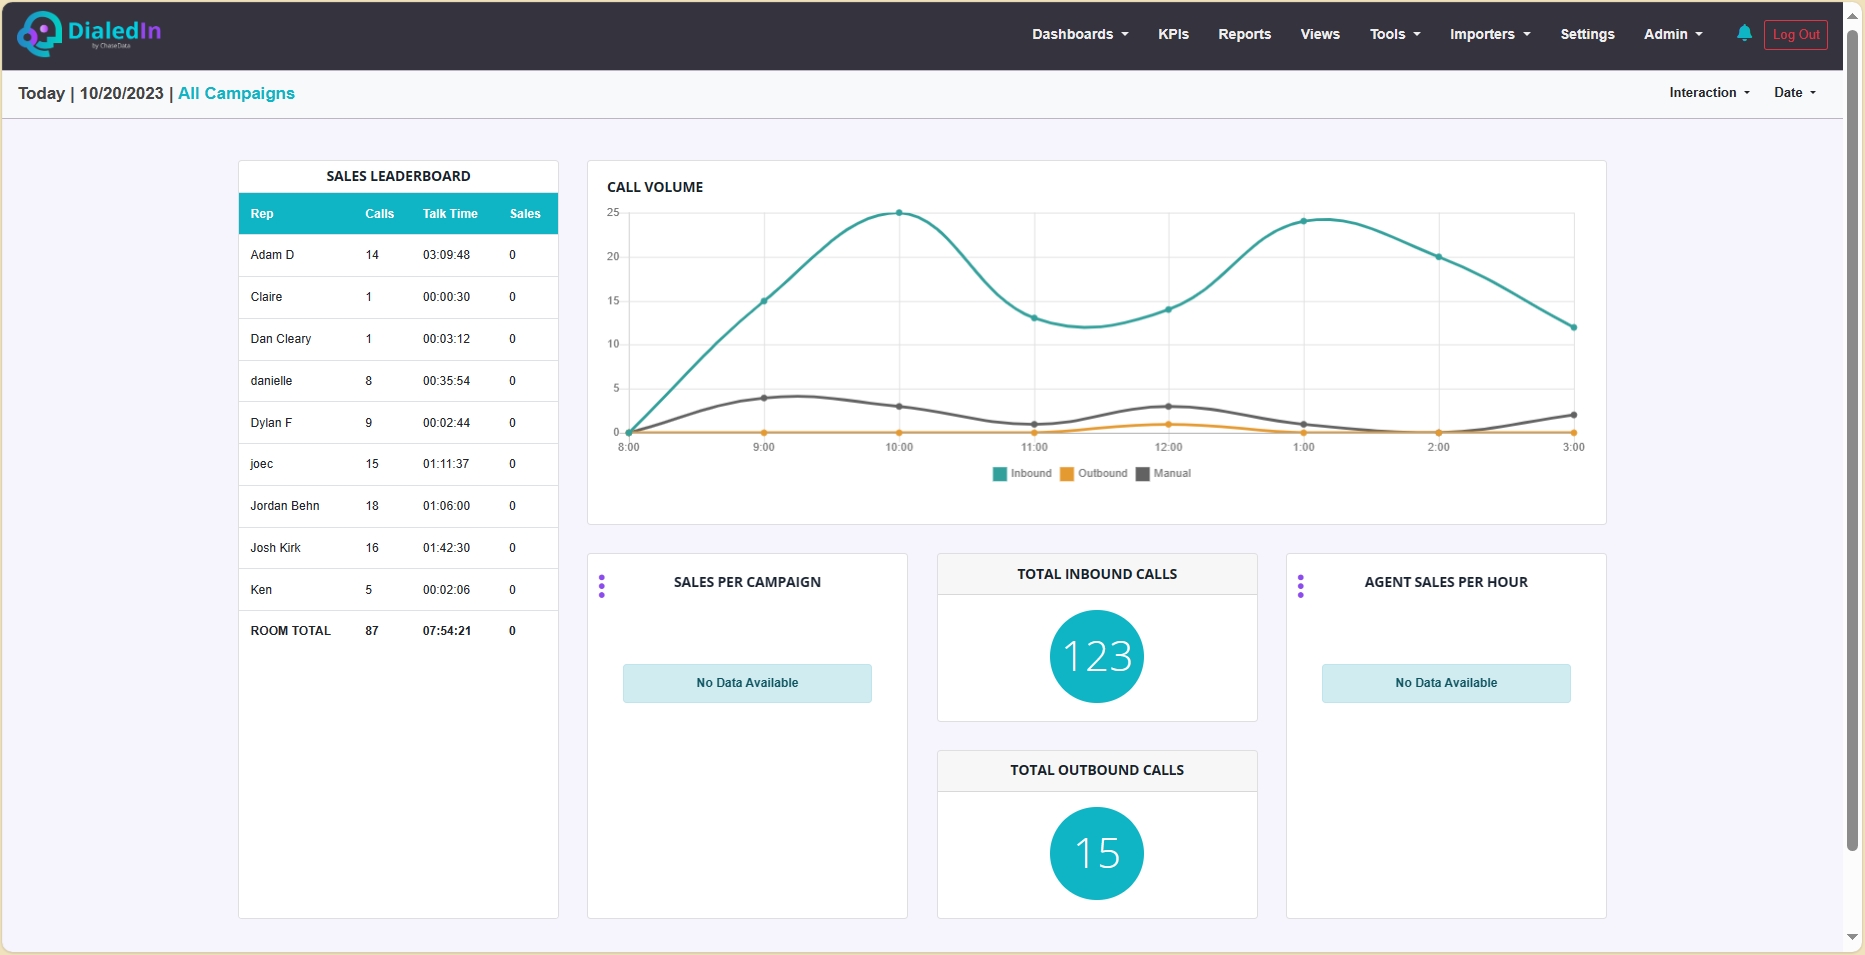
This dashboard provides a snapshot of where agents on handling calls and converting them into a sale (successful transaction).
By default, this dashboard's Interaction is set to All Campaigns, but can be changed to one or more available campaigns using the Interaction pull-down menu. Similarly, the Date is set to Today by default, which can also be changed using the Date pull-down menu.
The dashboard shows the number of calls for each agent, the time spent on those calls, and the number of resulting sales, as well as a graph of call volume over the timeframe selected, for each of inbound, outbound, and manual calls.
Refer to the following pictures.
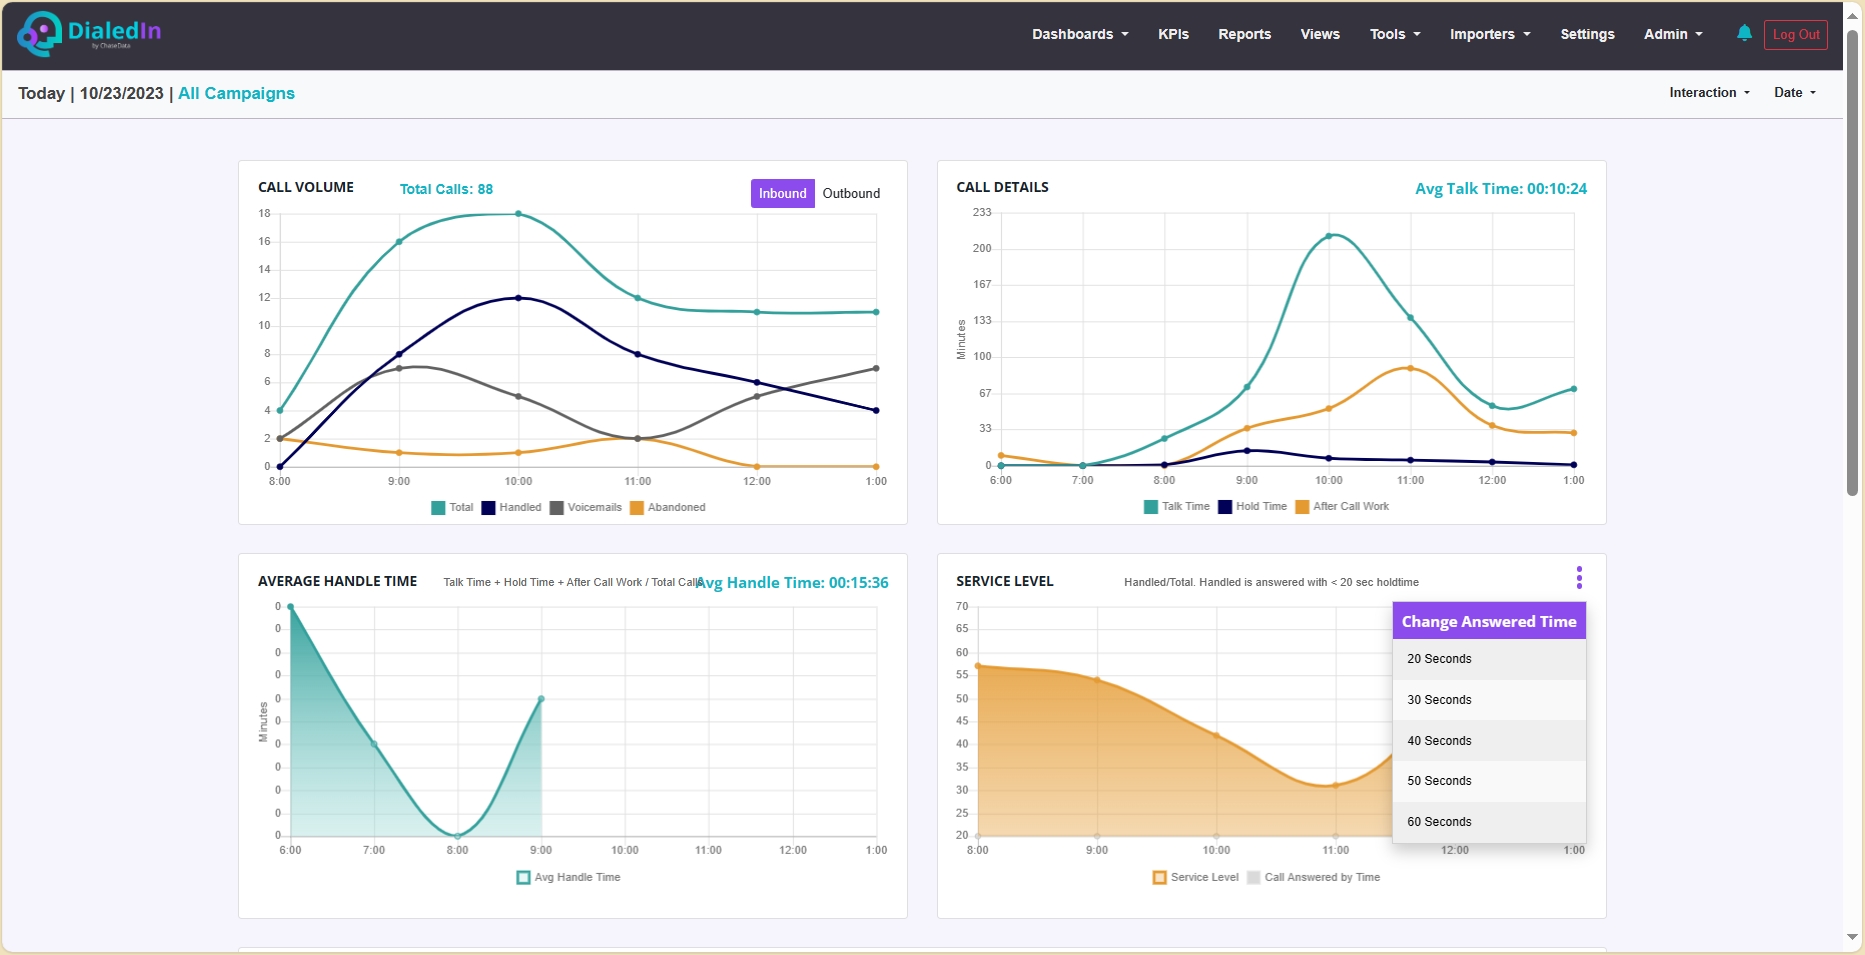
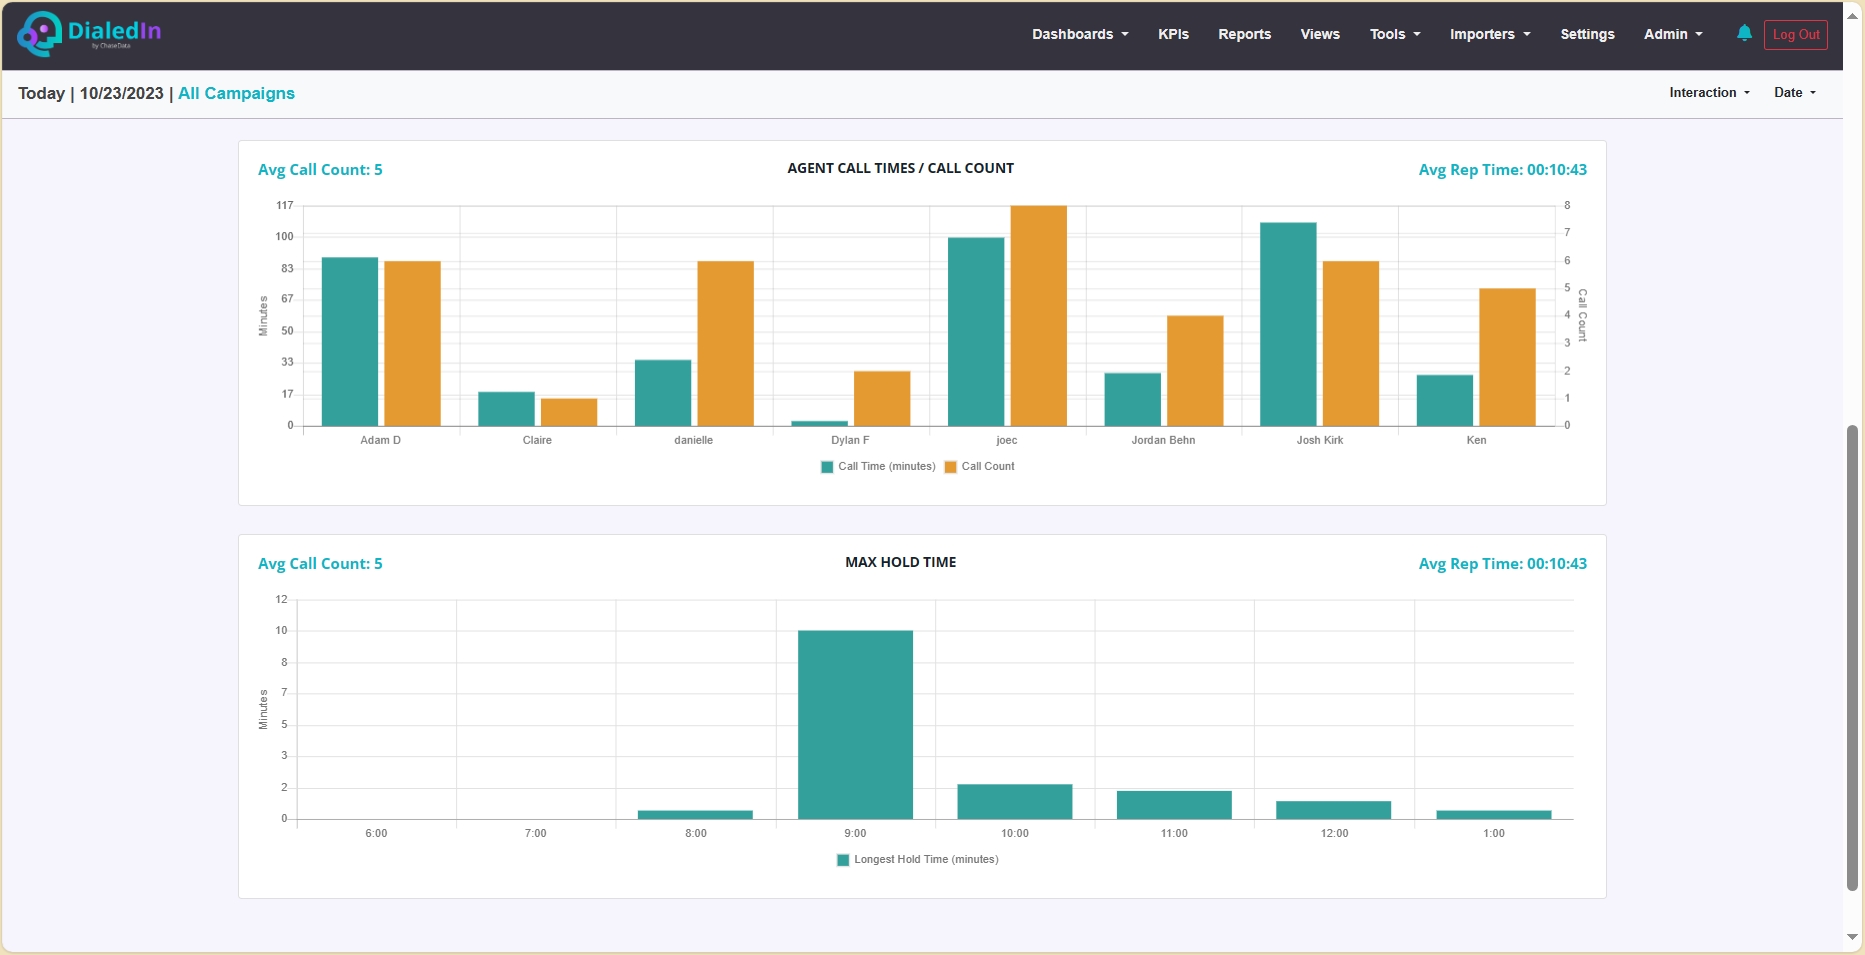
This dashboard focuses on providing activity trends over time in a graphical manner, so to better visualize ups and downs.
By default, this dashboard's Interaction is set to All Campaigns, but can be changed to one or more available campaigns using the Interaction pull-down menu. Similarly, the Date is set to Today by default, which can also be changed using the Date pull-down menu.
The dashboard displays trends over time for call volume, providing splits for handled, answer machine, and .abandoned calls. It also displays call minutes over time, providing splits for talk time, hold time, and after call work. On top of that, shows how average handle time fluctuates over time, as well as percentage of calls meeting a configured service level (max holding time) for handled calls.
The dashboard also depicts graphically how each agent’s call times and call counts compares to the others, and how maximum hold times fluctuate over time.
Refer to the following pictures.
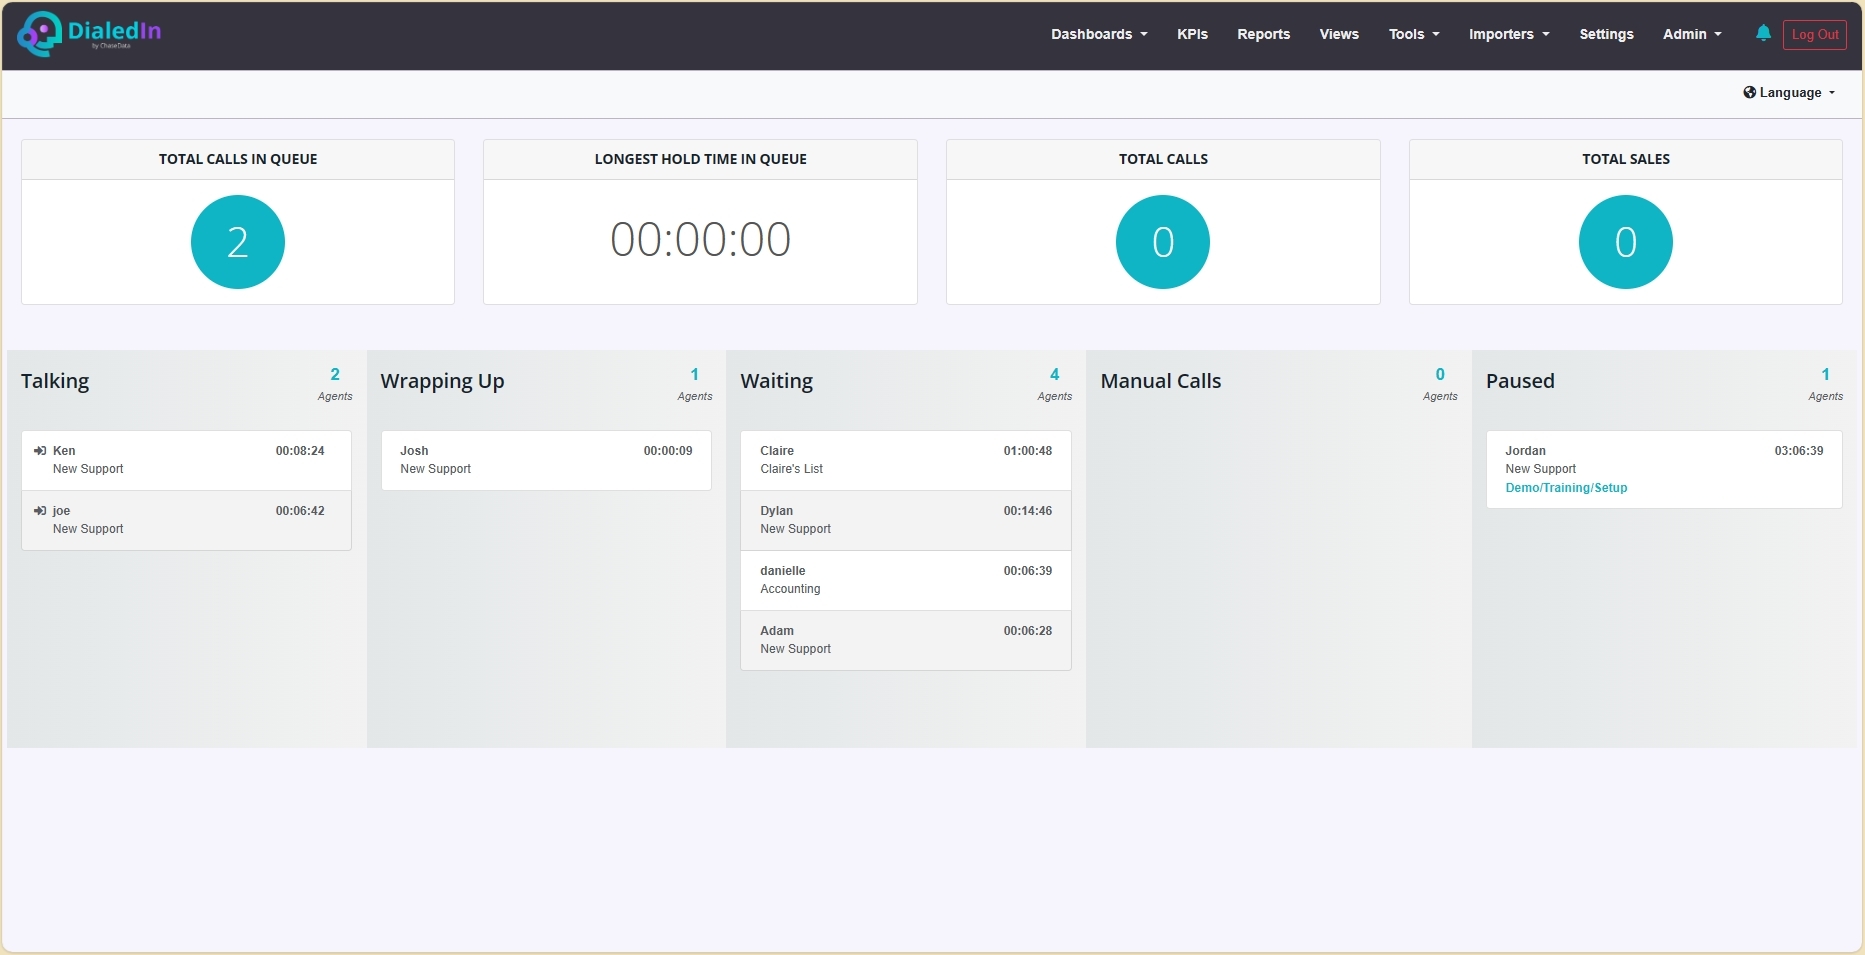
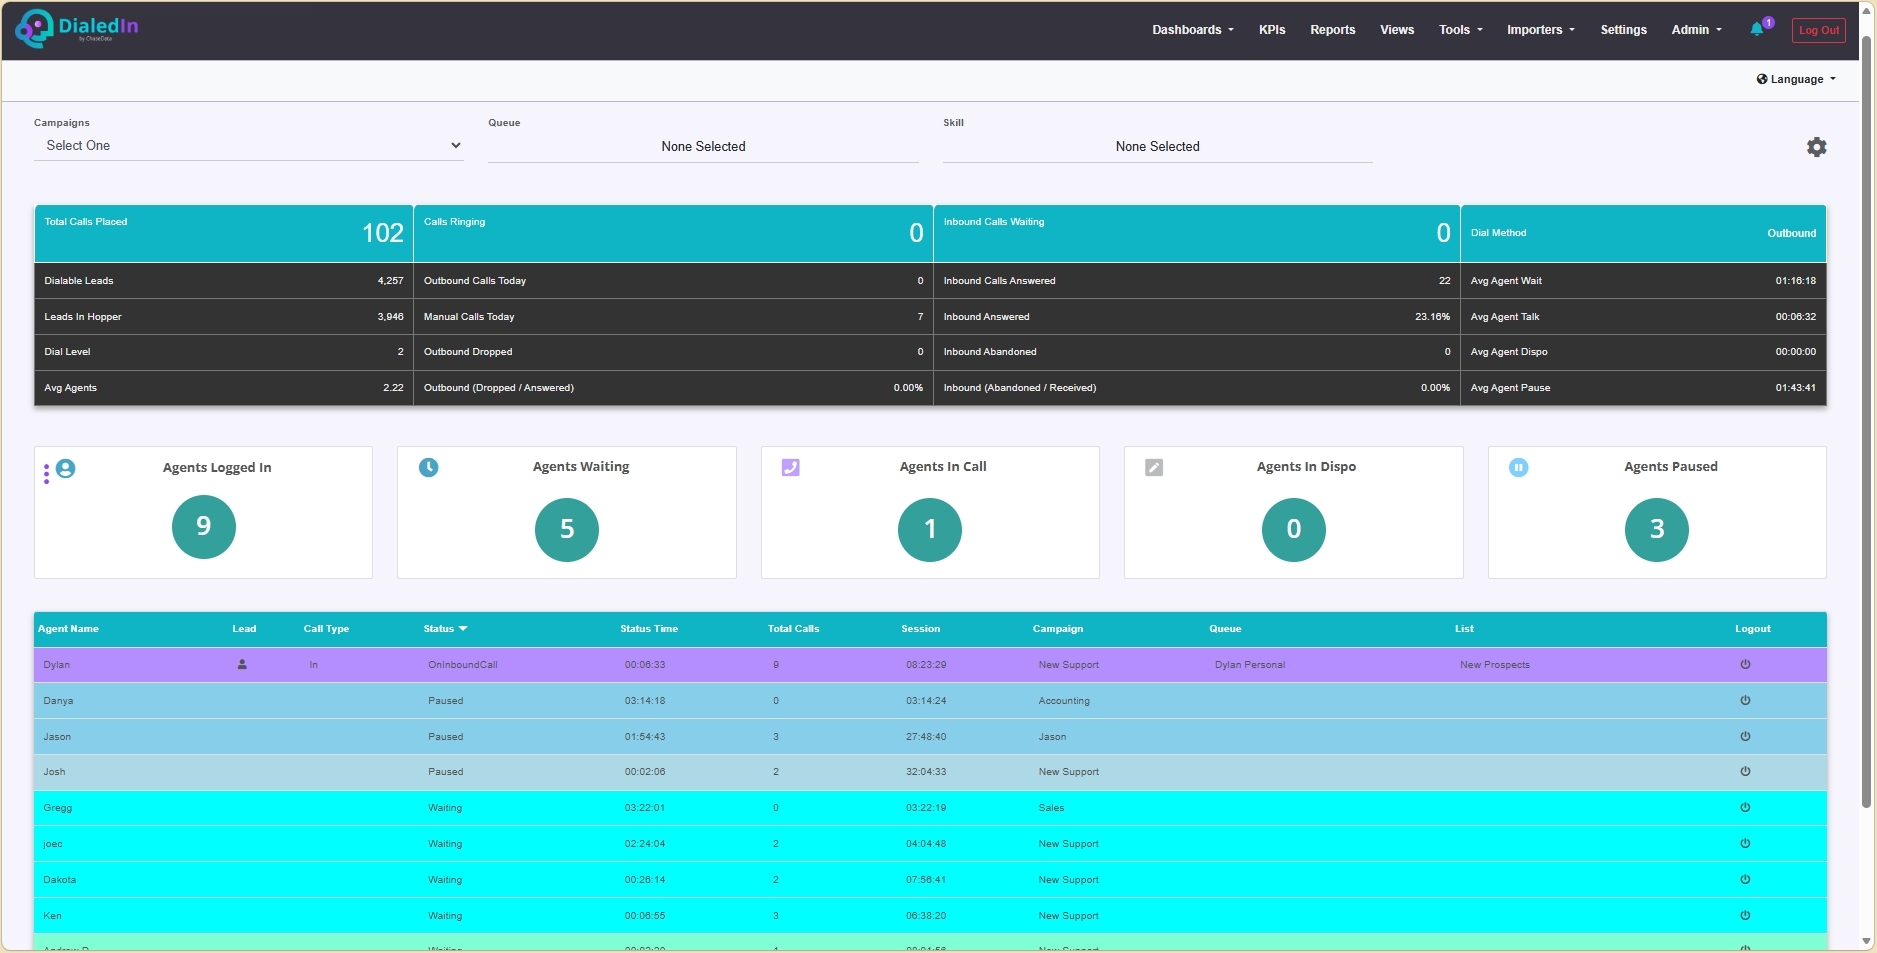
The real-time dashboard displays logged in agents and whether they are paused, waiting for calls, on assigned calls, on manually dialed calls, or wrapping up after a call. Details for each agent include the campaign into which the agent has logged in, and the time since it moved into the current state.
The agents are moved accordingly when they change state.
Refer to the following picture.
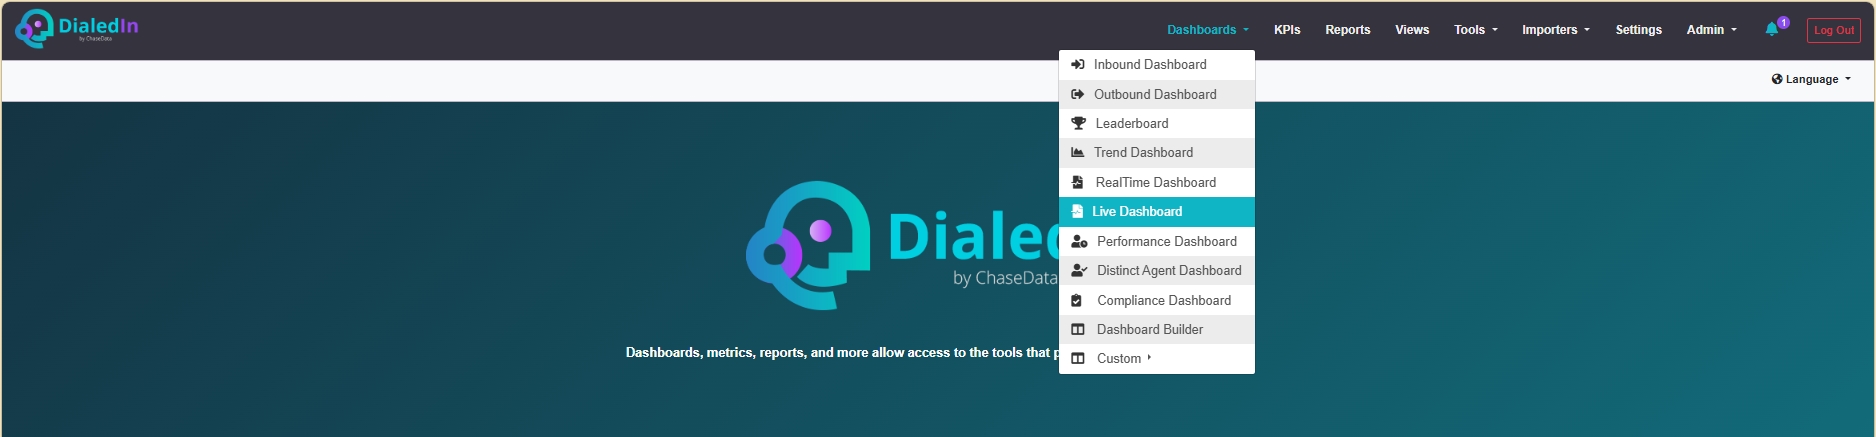
Every dashboard groups a specific set of informational items, which is why we see some information provided in more than one dashboard. The Live Dashboard tries to put together a comprehensive view of live information, with the purpose of being an overall summary for most operations, instead of a specific purpose dashboard.
Refer to the following picture.
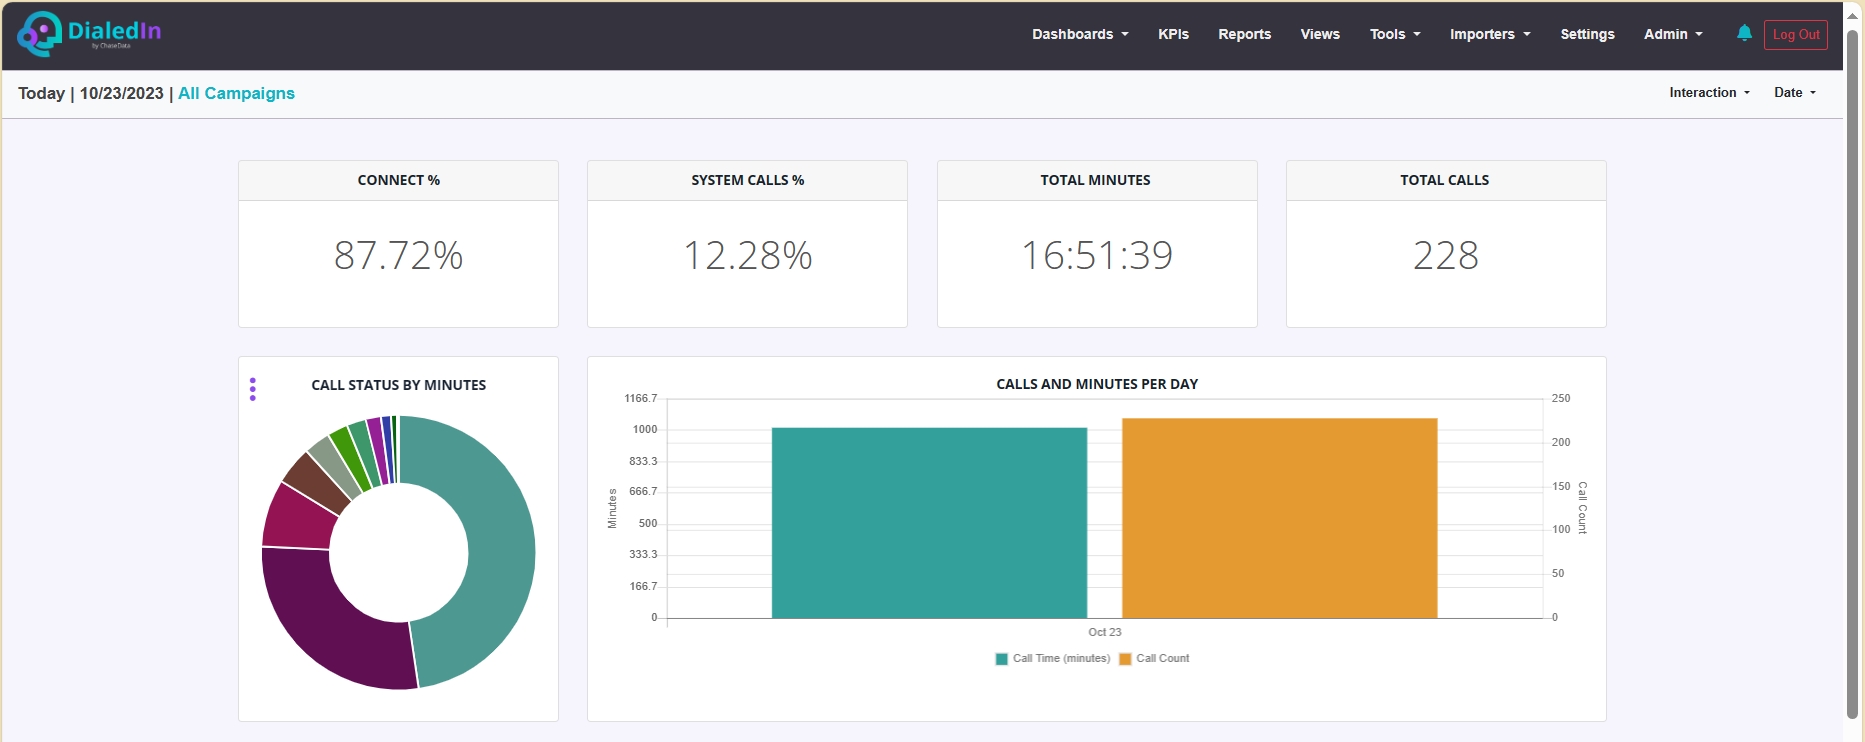
This dashboard provides a quick view of the overall high-level performance of call center operations by providing key counts and percentages.
By default, this dashboard's Interaction is set to All Campaigns, but can be changed to one or more available campaigns using the Interaction pull-down menu. Similarly, the Date is set to Today by default, which can also be changed using the Date pull-down menu.
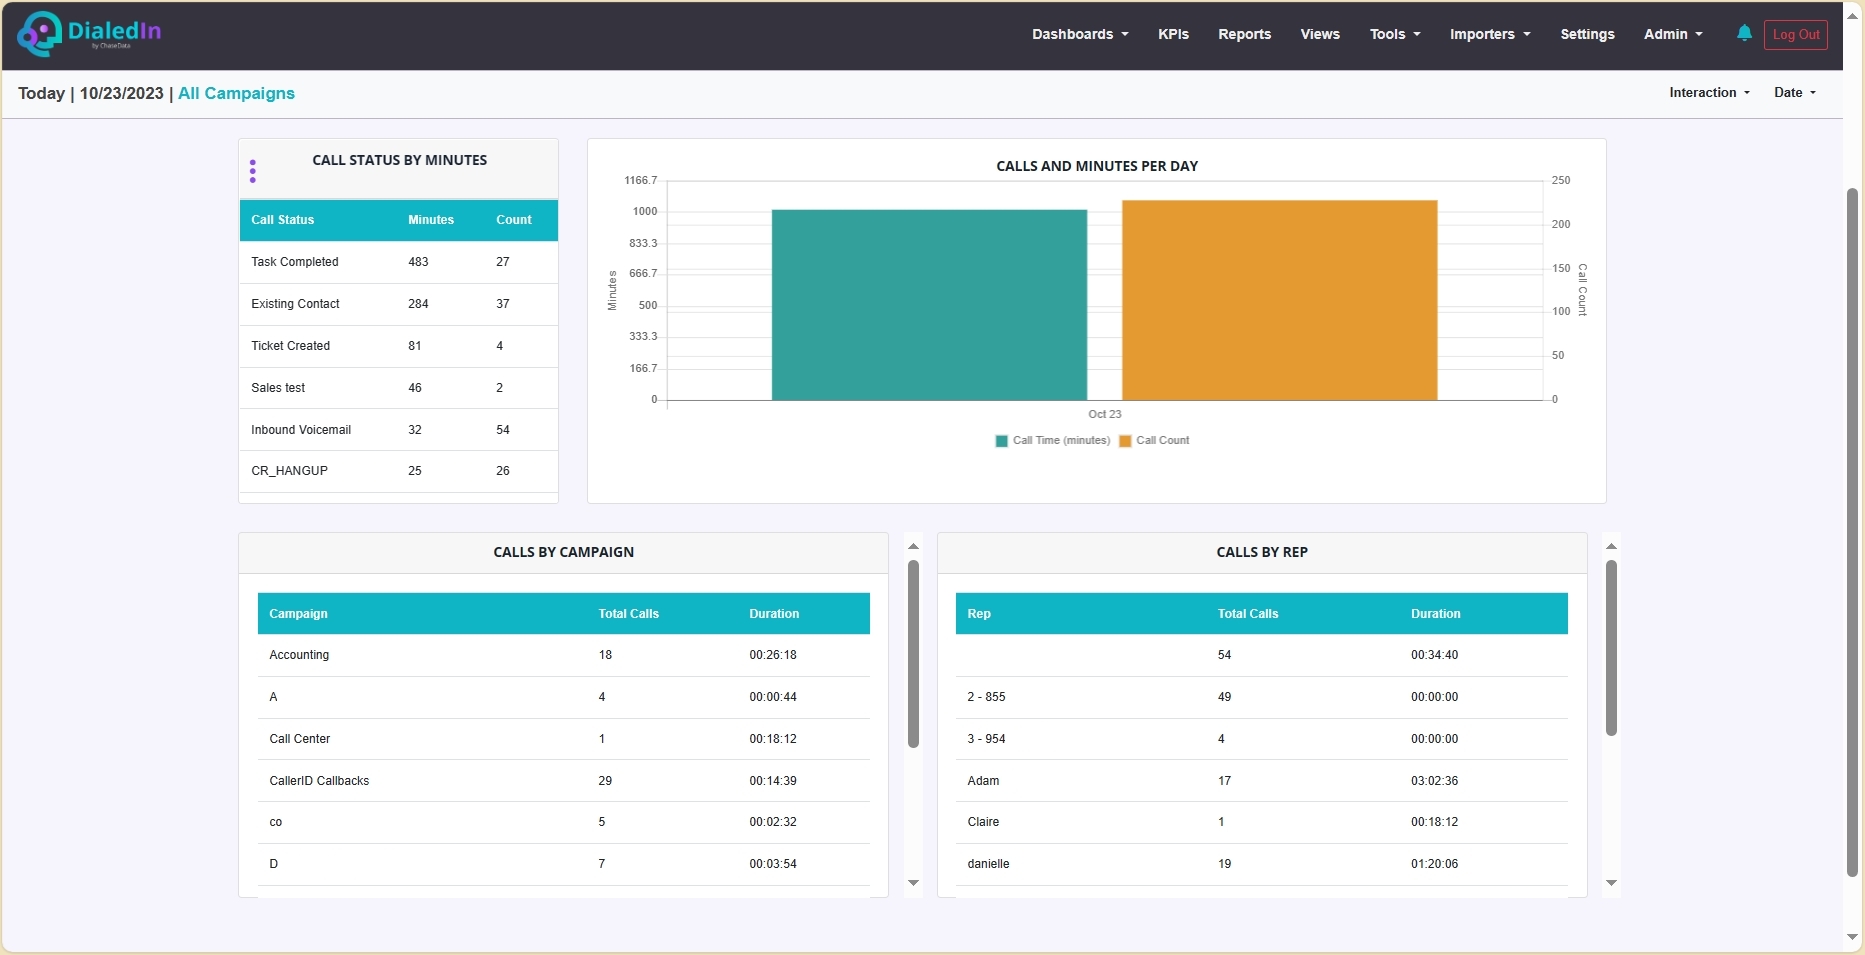
The graphical components of this dashboard should be tried at different timeframes. For example, Call Status By Minutes may be more suitable to check the day’s operation, while Calls And Minutes Per Day may provide more insight in a week’s or month’s operation.
The dashboard also dives into a split of calls and duration among campaigns and agents, to expand into more granular performance insights.
Refer to the following pictures.
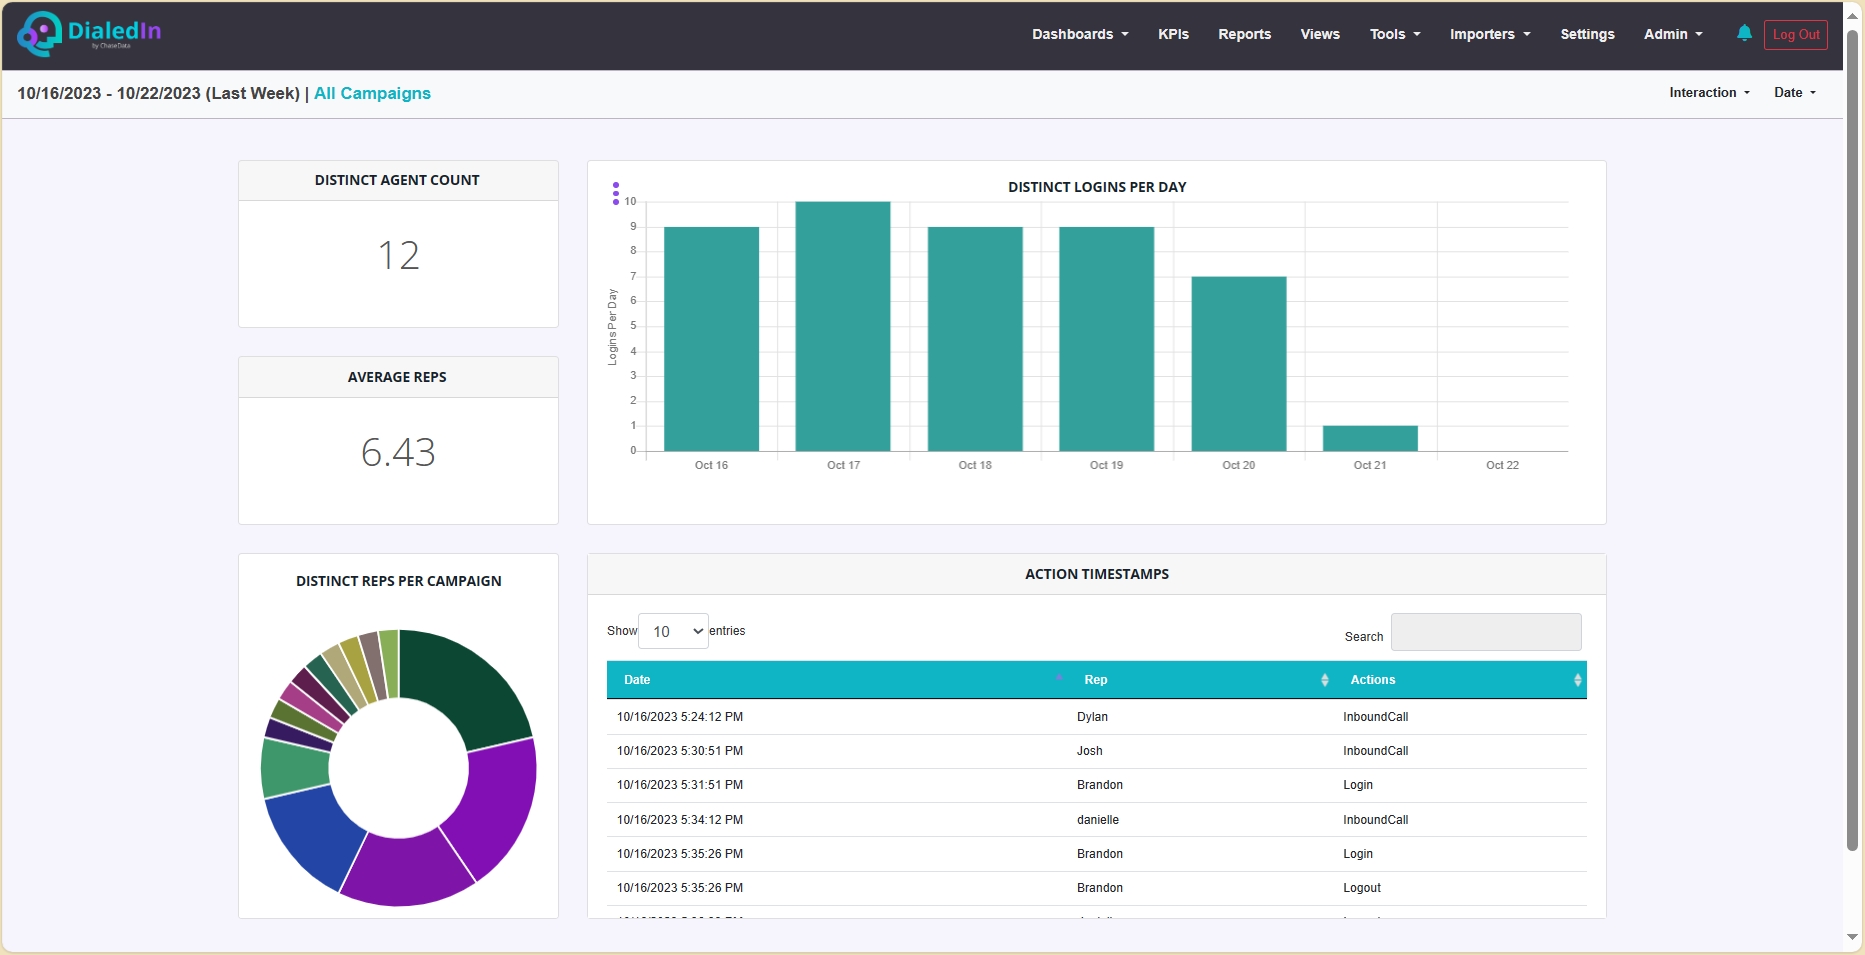
This dashboard provides a snapshot of how many distinct agents are logged-in, including a split per campaign, in a specific timeframe, including an average per day. Notice that if a single day is observed, the average and count will be the same.
In addition, a table with each agent’s activity is included, to be able to see when the specific agents logged in and out, and their actions or activity during those periods.
By default, this dashboard's Interaction is set to All Campaigns, but can be changed to one or more available campaigns using the Interaction pull-down menu. Similarly, the Date is set to Today by default, which can also be changed using the Date pull-down menu.
Refer to the following pictures.
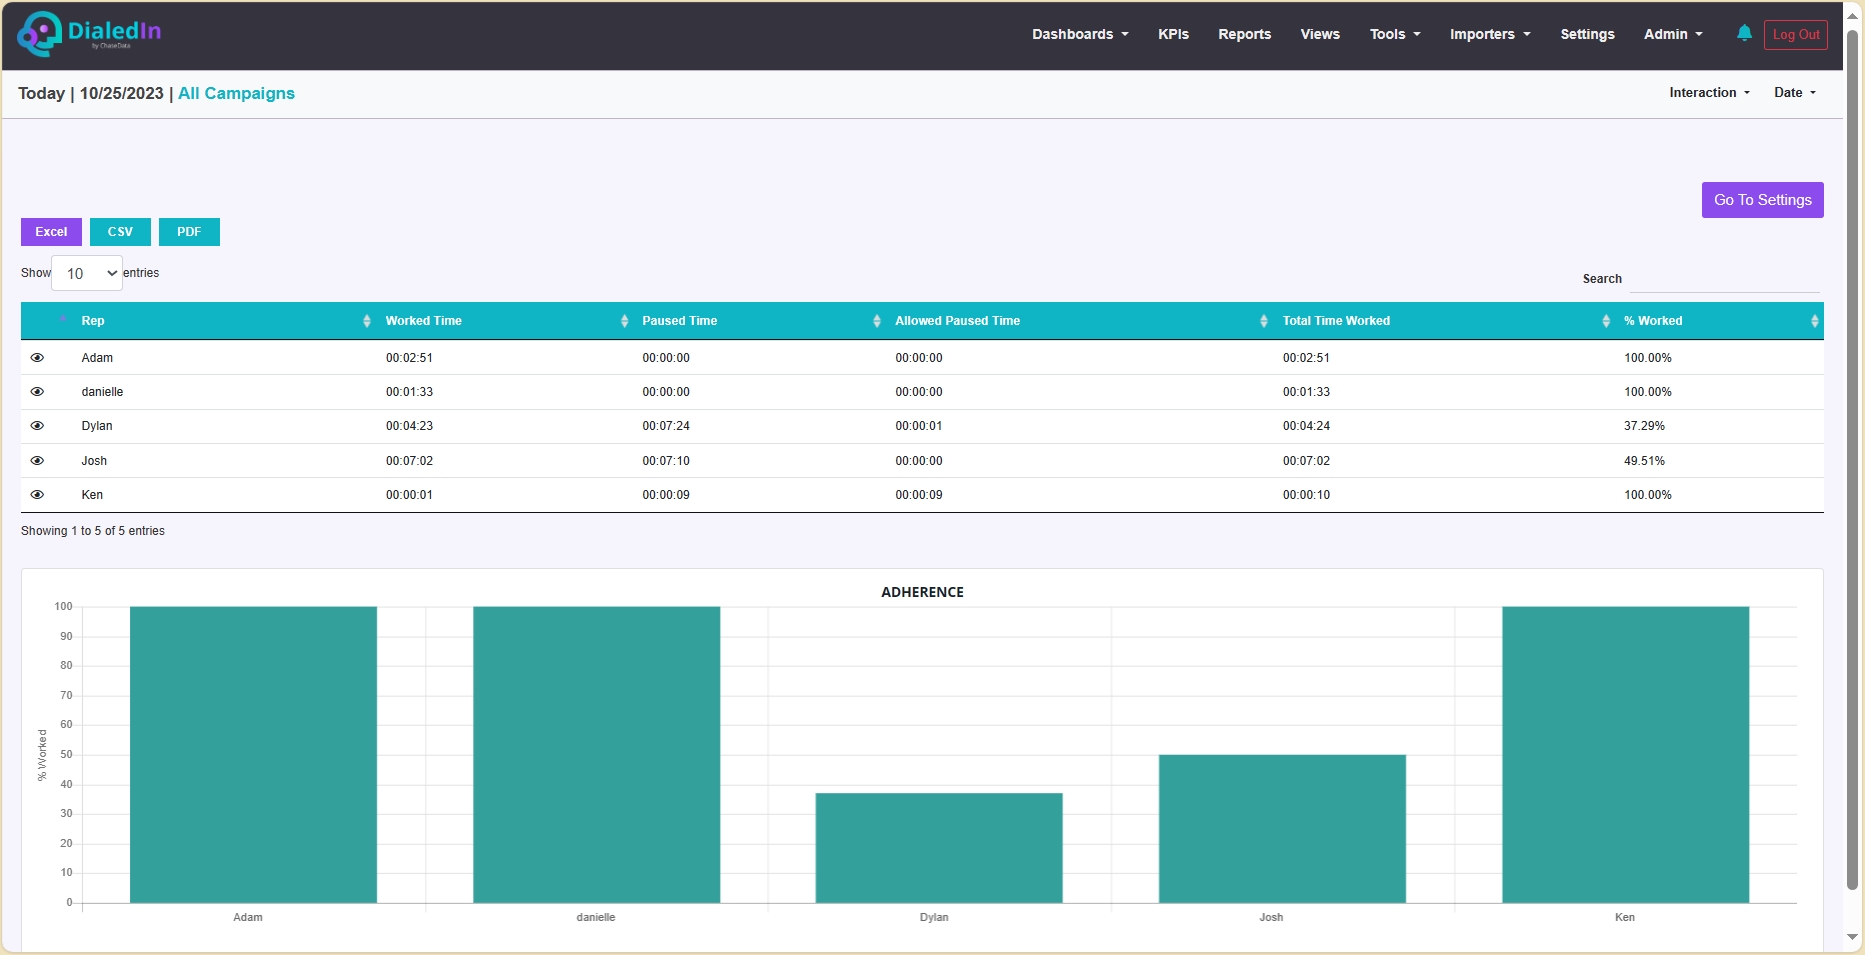
This dashboard provides information on each agent’s accumulated time on actual work versus break or pause time, so managers can determine whether agents are adhering to or complying with the operational guideline. Note that there is allowed pause time, as well as pause time outside the accepted work schedule.
By default, this dashboard's Interaction is set to All Campaigns, but can be changed to one or more available campaigns using the Interaction pull-down menu. Similarly, the Date is set to Today by default, which can also be changed using the Date pull-down menu.
This dashboard also allows downloading the list of agents with their respective work and pause times, including the work rate, which is work time over the sum of work time and allowed pause time. Export can be done towards several file formats, including MS Excel, CSV, and PDF.
Refer to the following pictures.
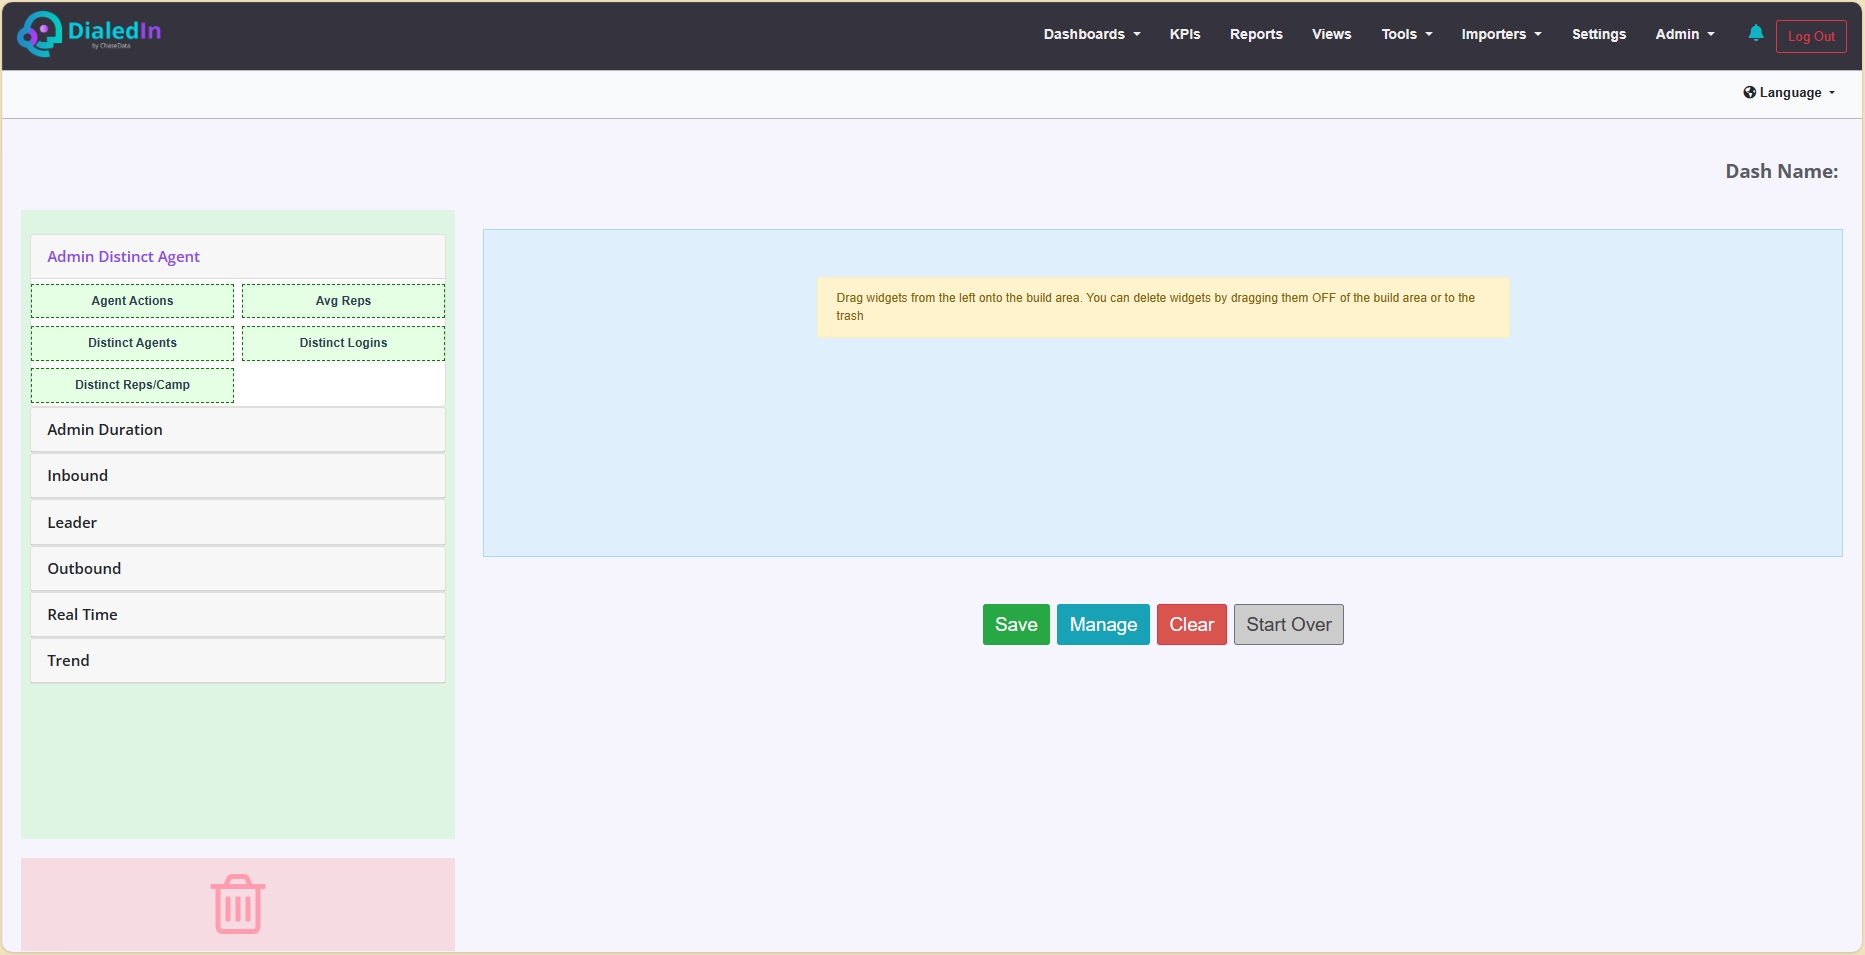
The dashboard builder is not an actual dashboard, but rather a tool to build a custom one.
The builder presents a number of built-in elements, most of which are used in other dashboards, so you can drag and drop those elements into the area representing the dashboard to be built.
Refer to the following pictures.
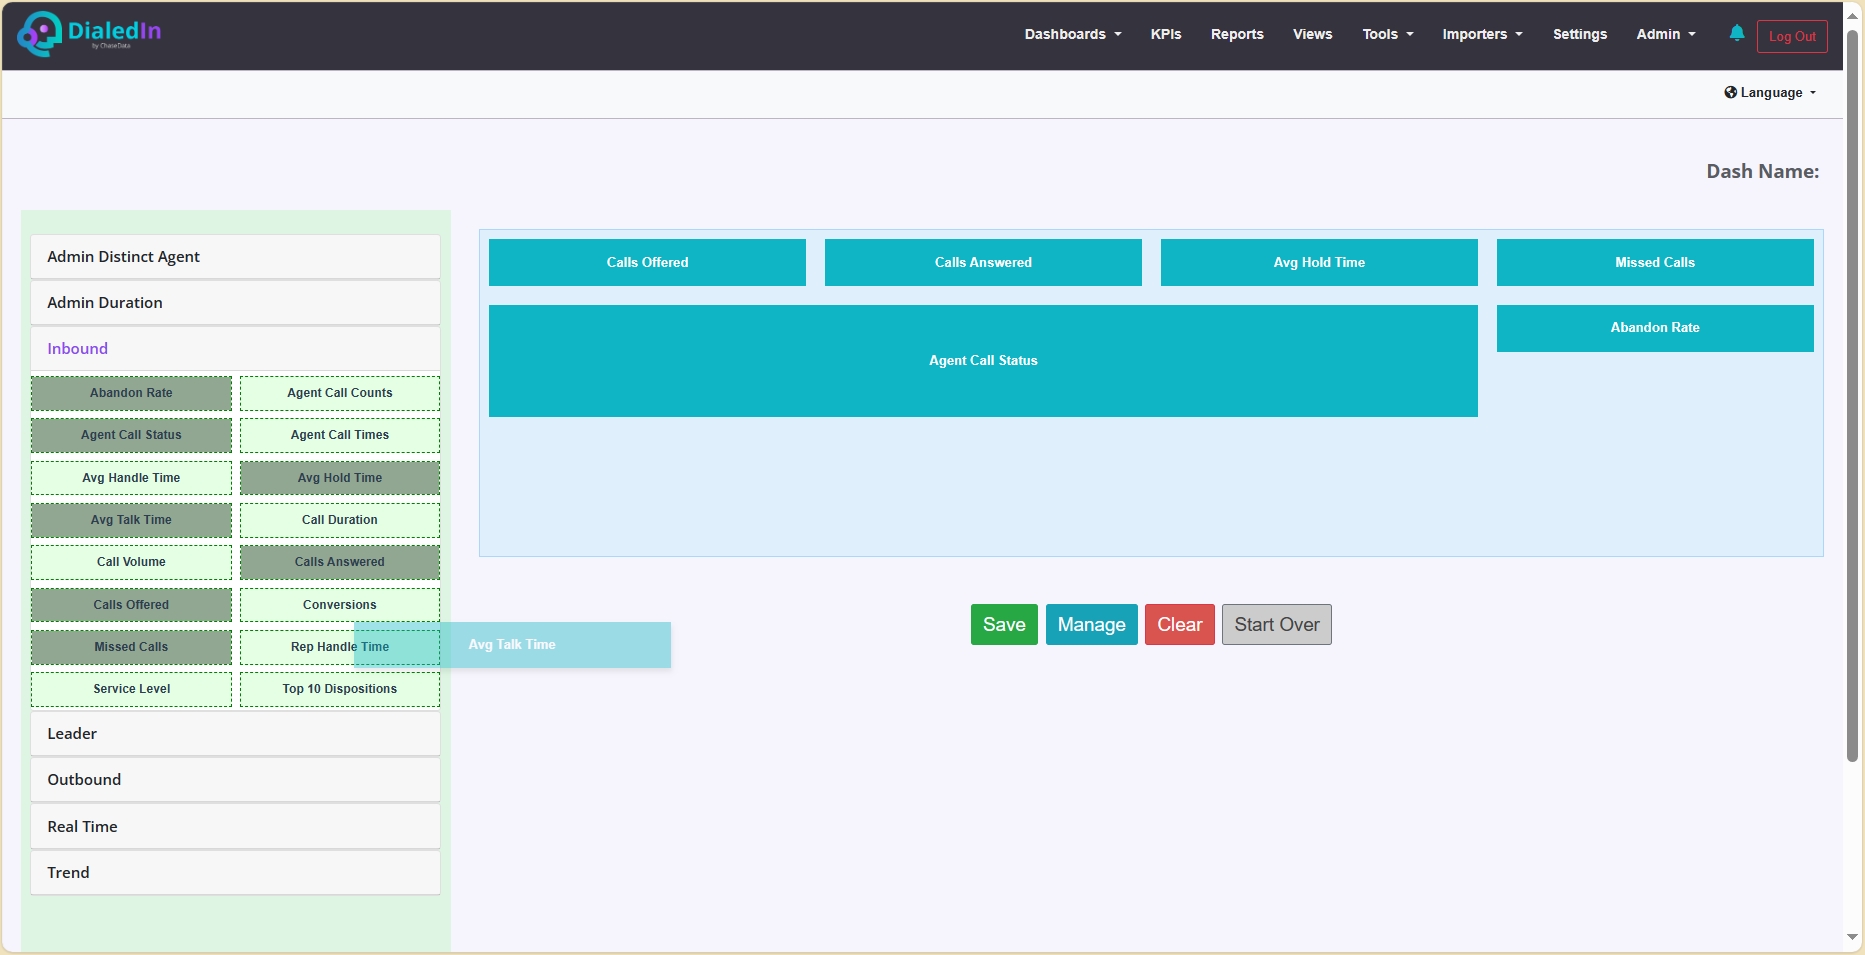
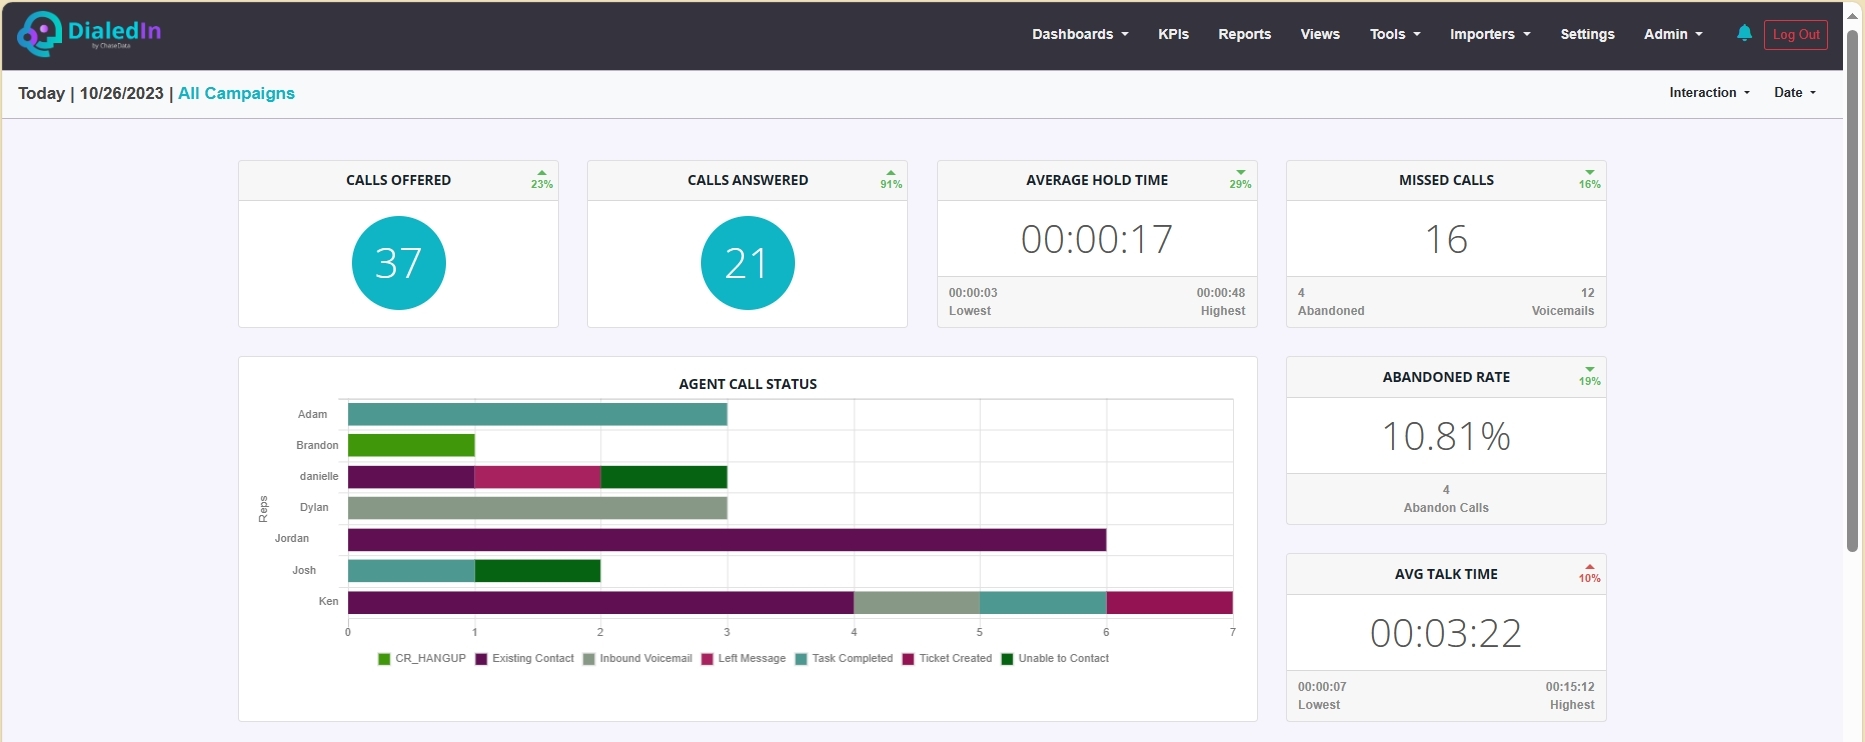
Refer to the following picture. This is an example of how the previous one would result in a custom dashboard.
Check this demo video for a walk-through of how to build a custom dashboard.