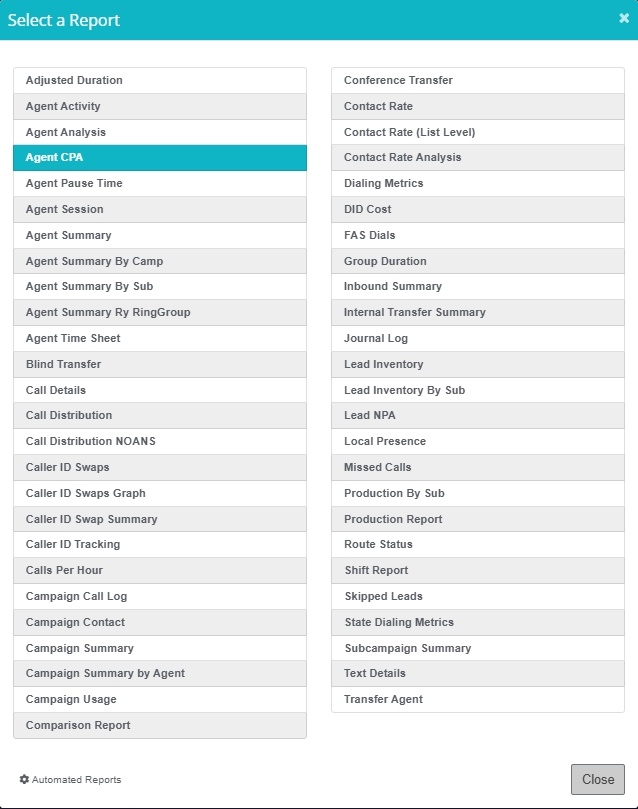
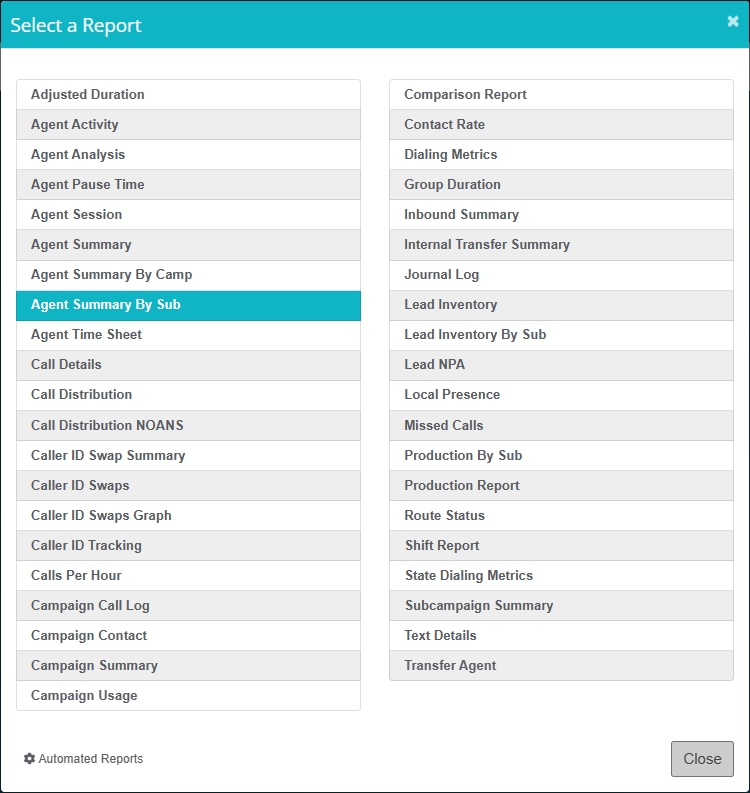
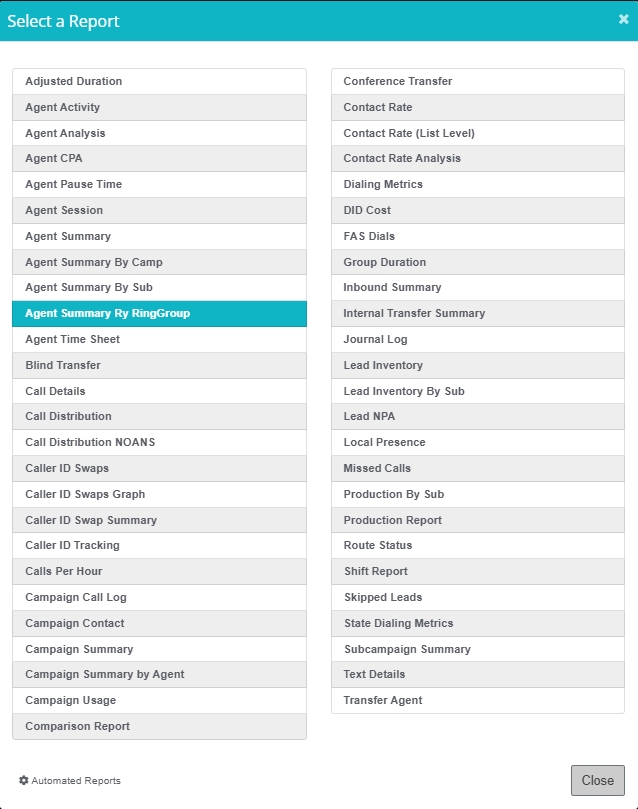
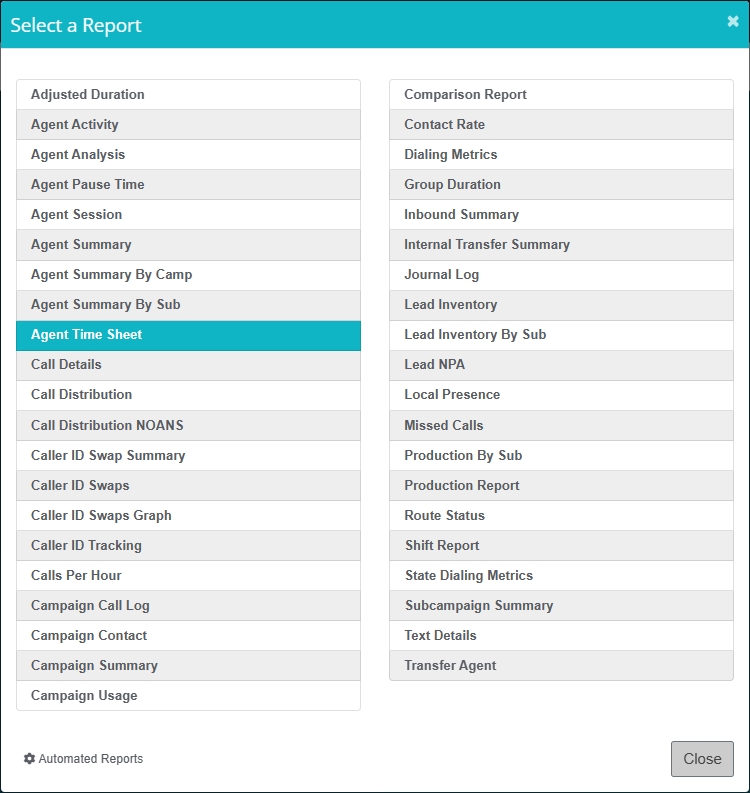
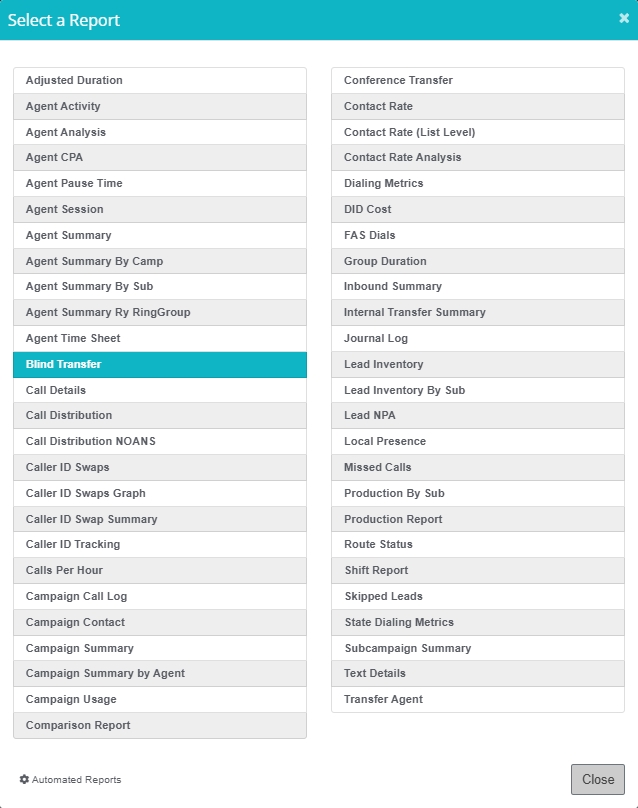
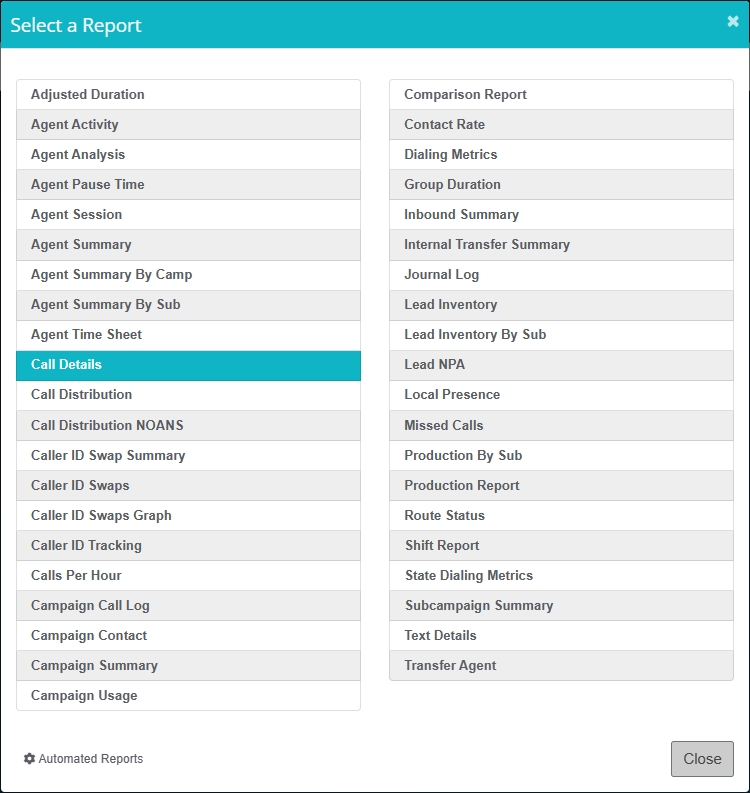
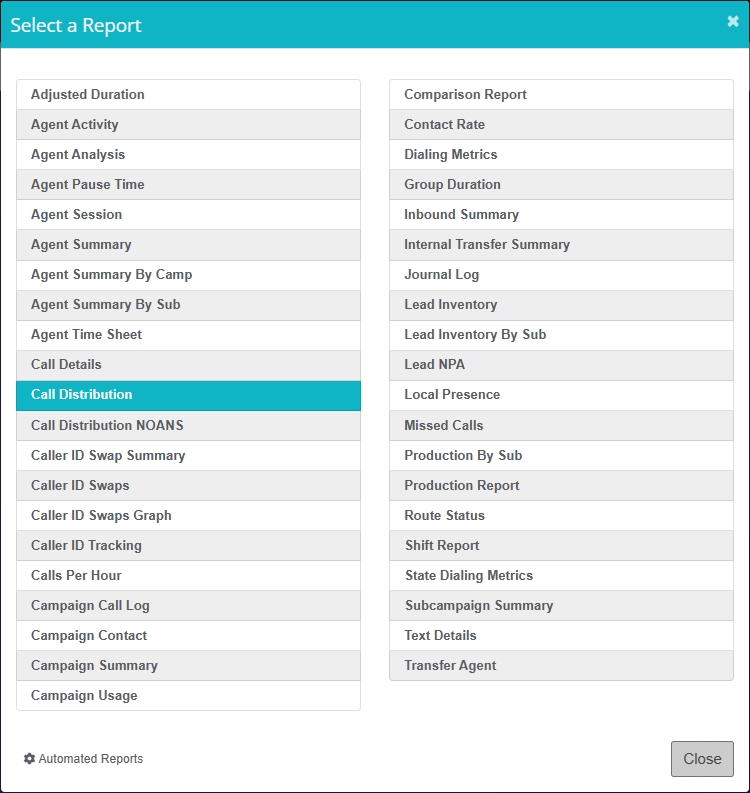
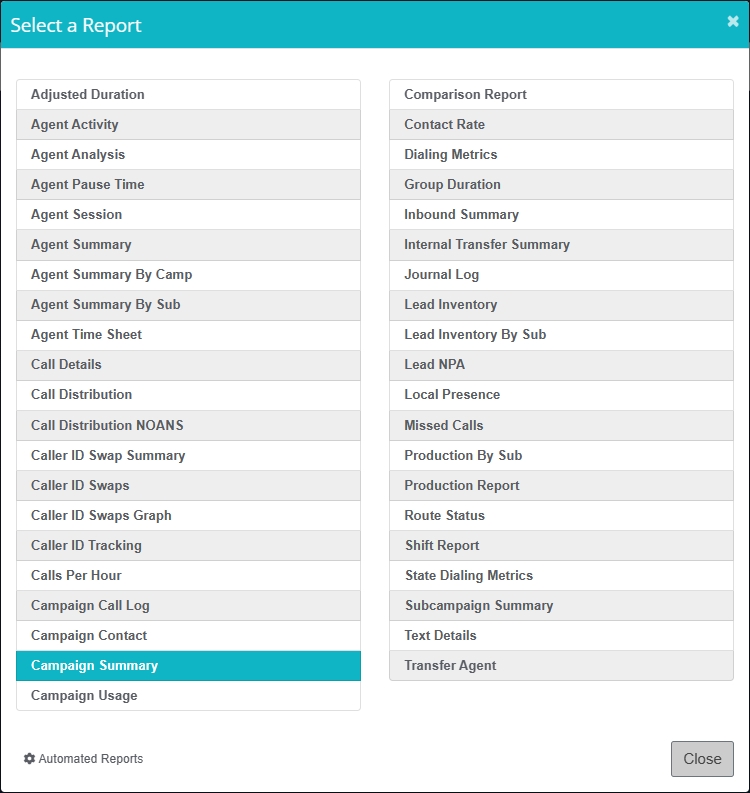
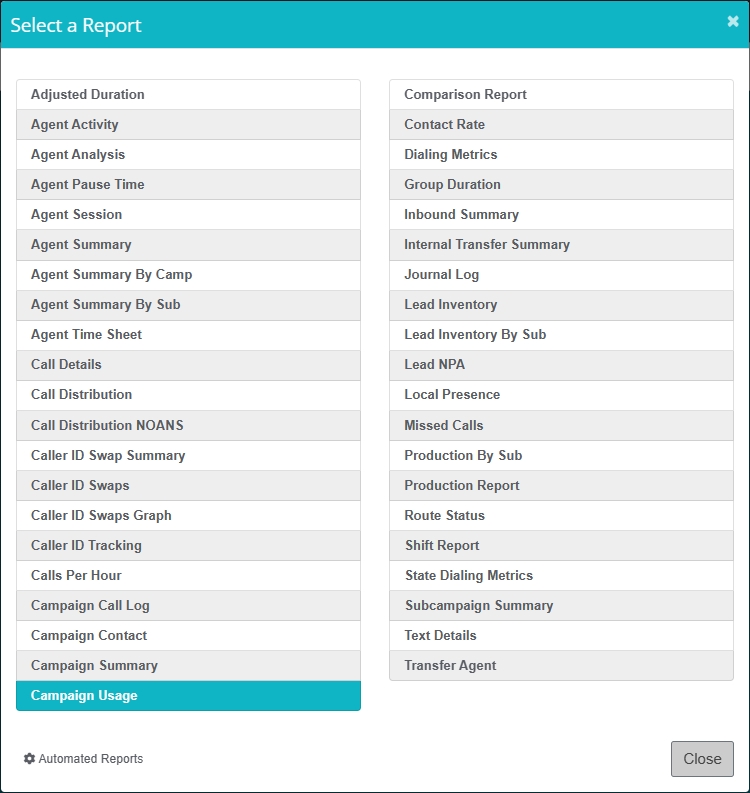
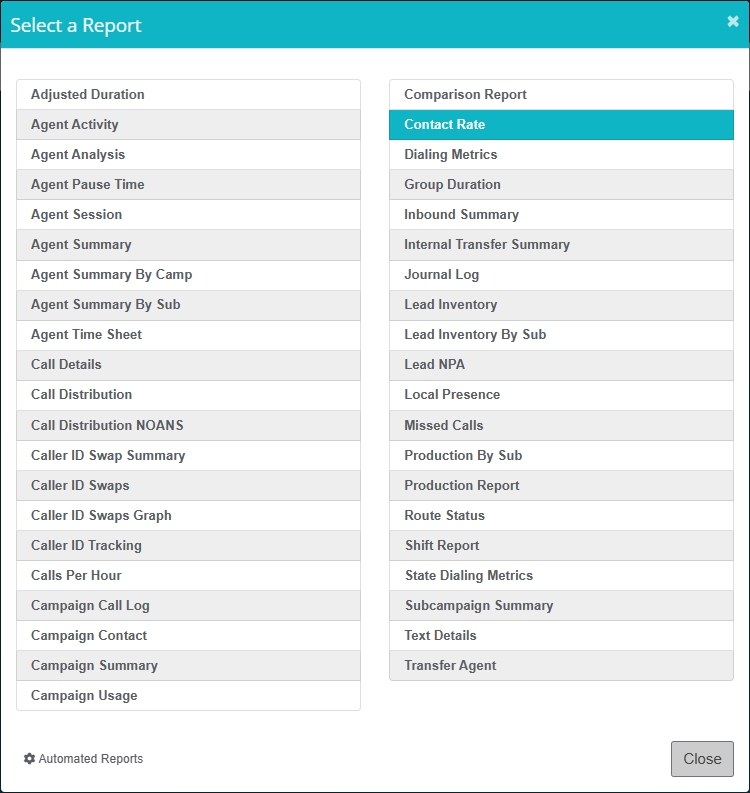
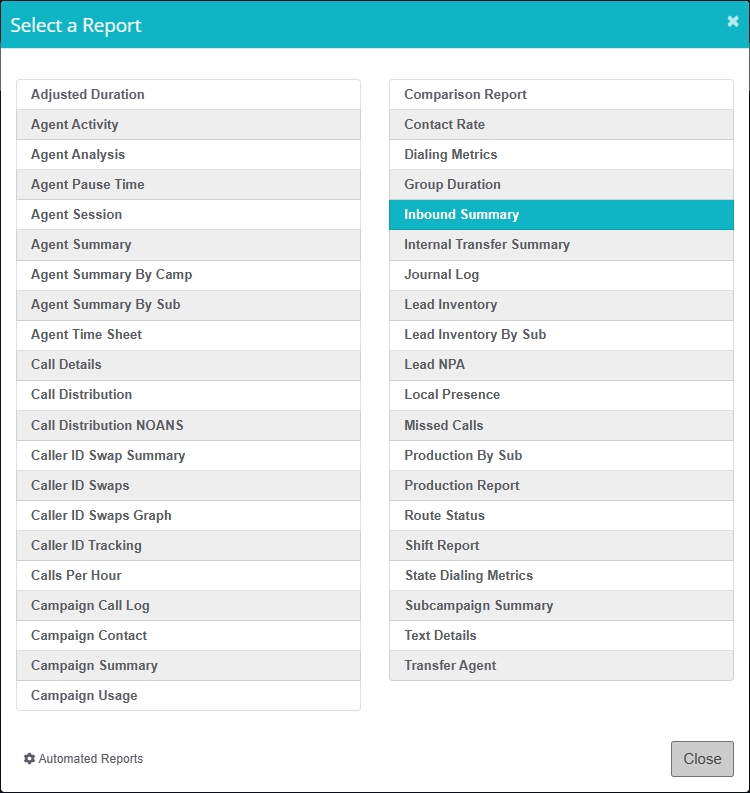
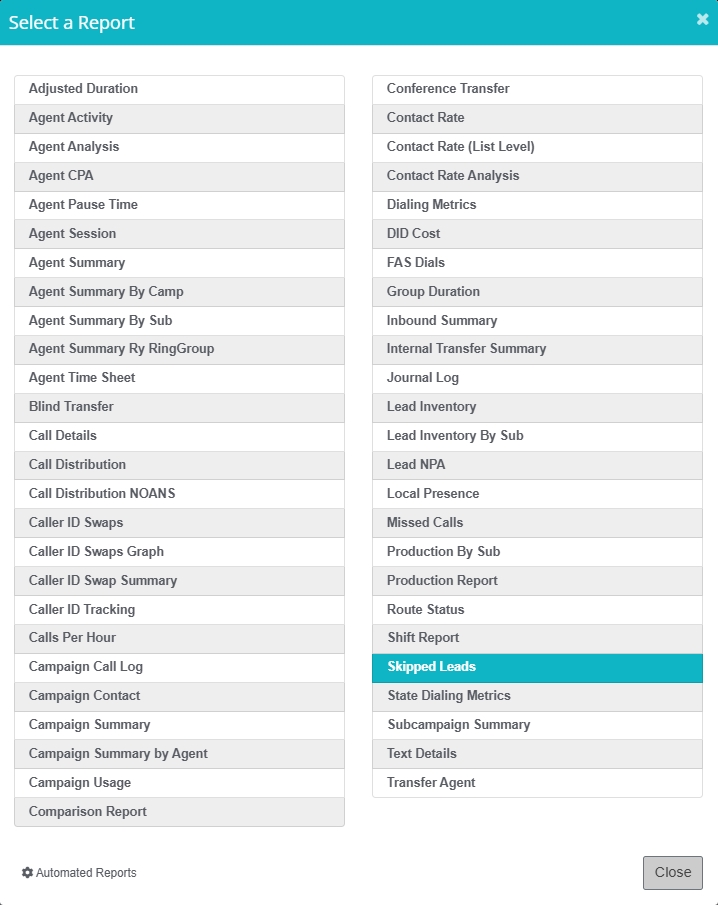
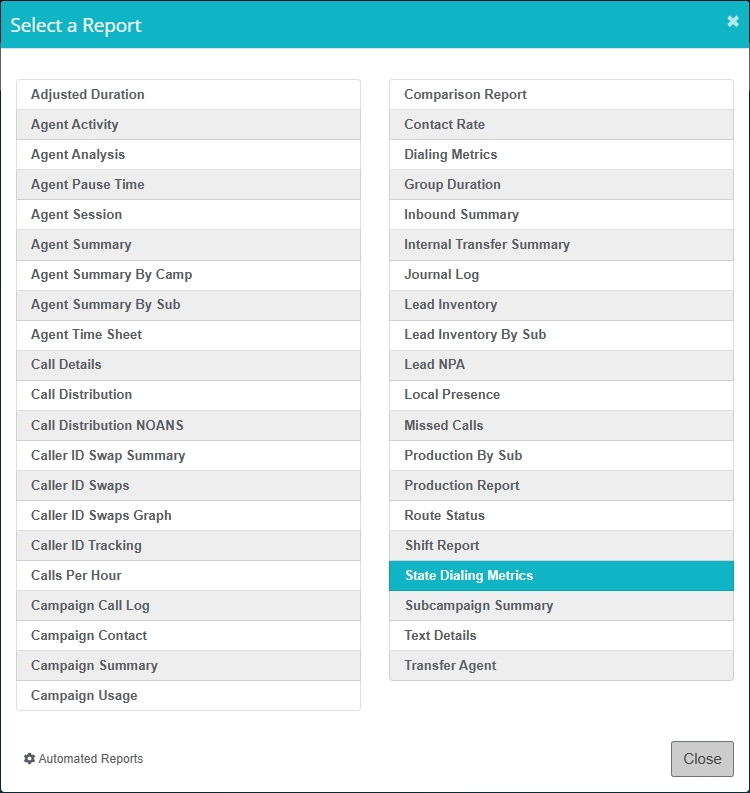
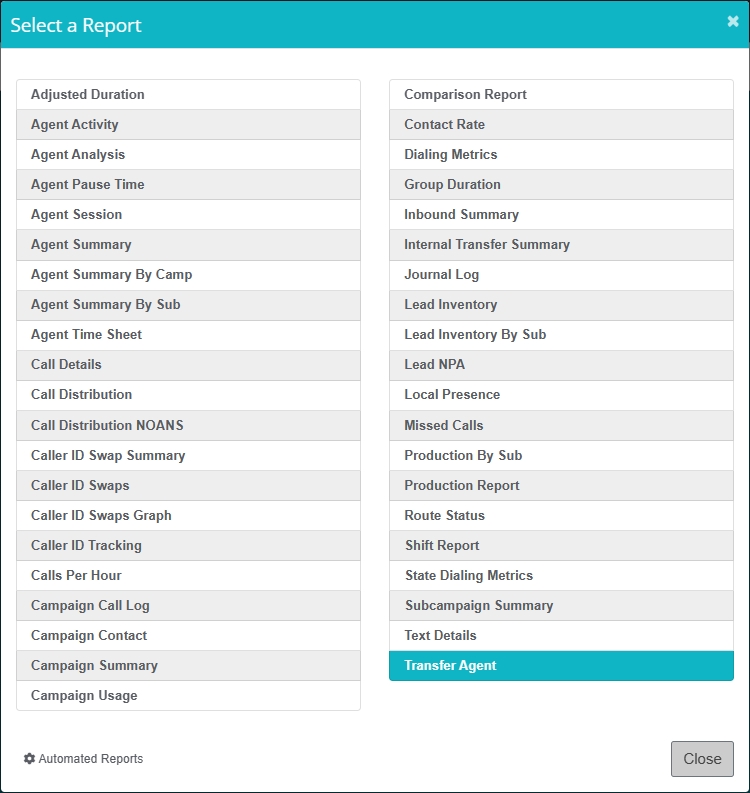
Reports
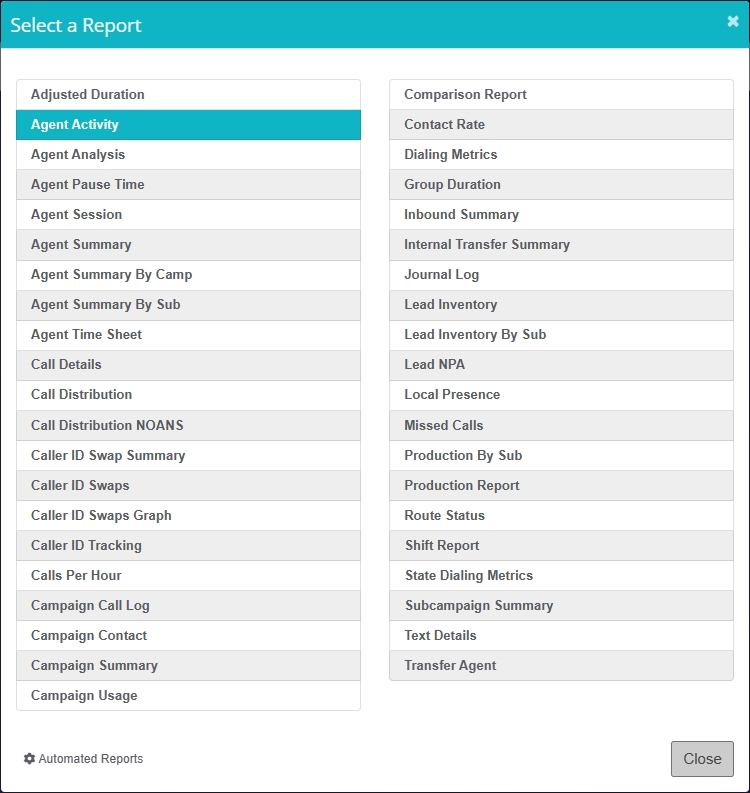
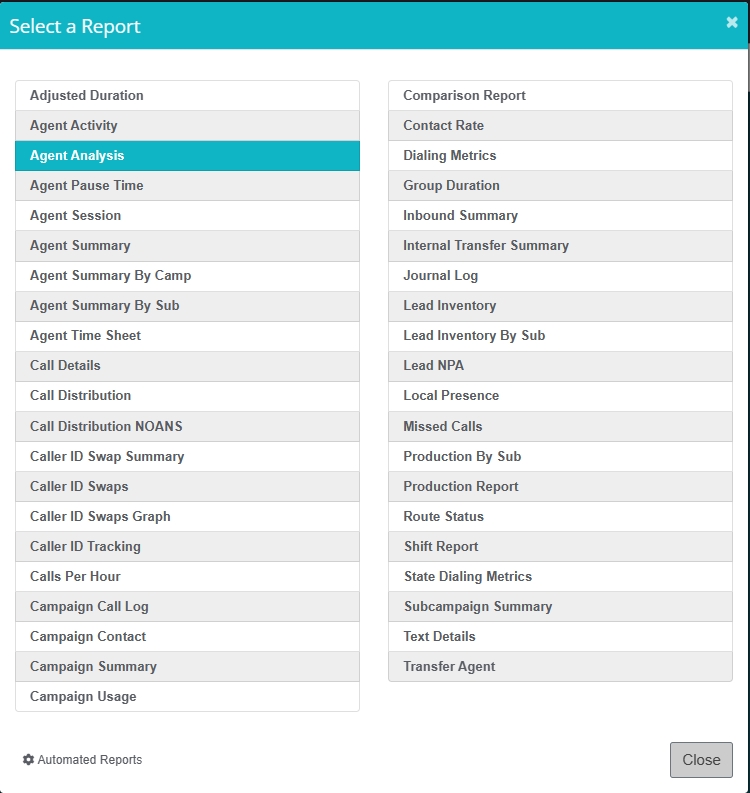
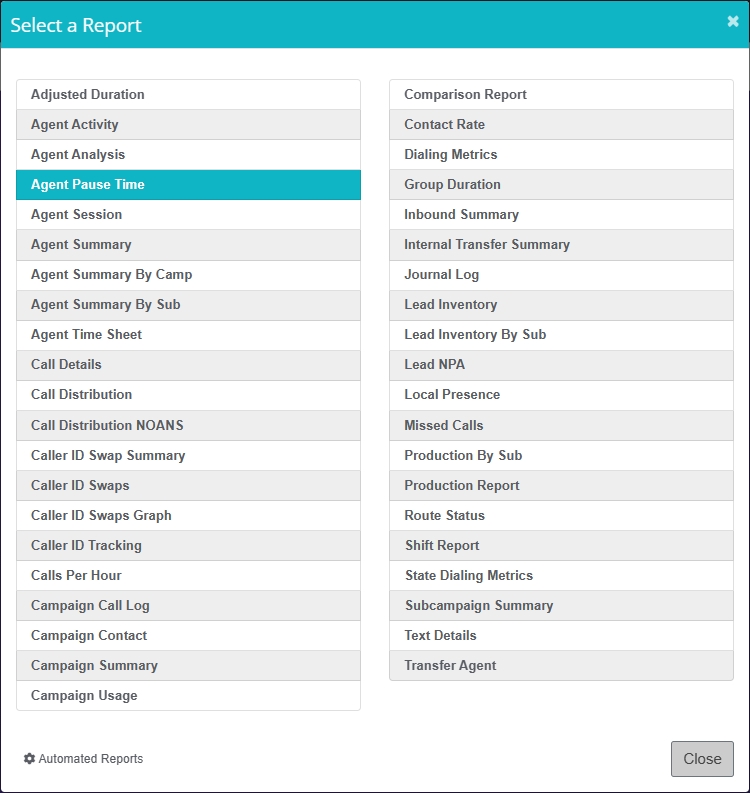
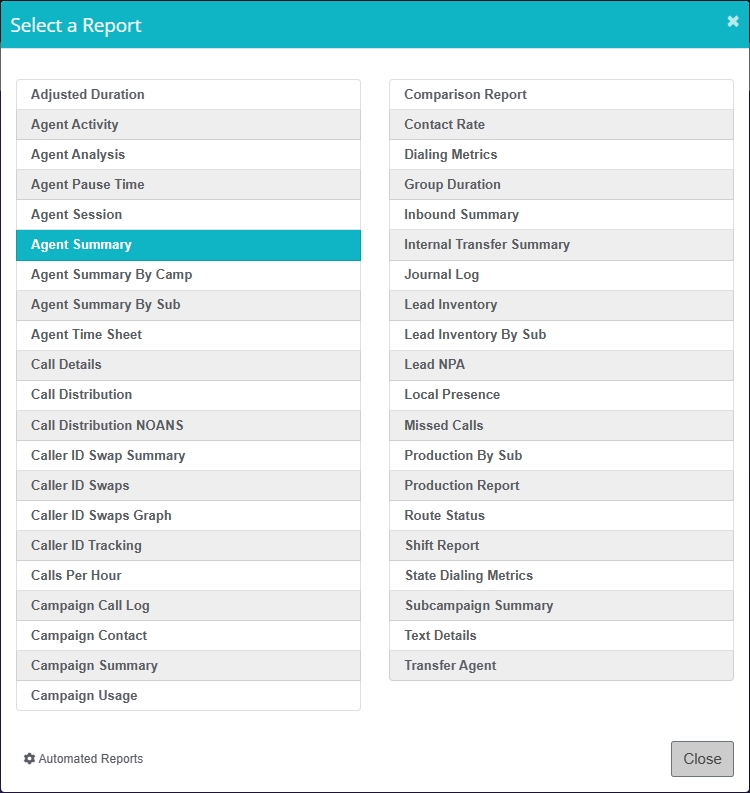
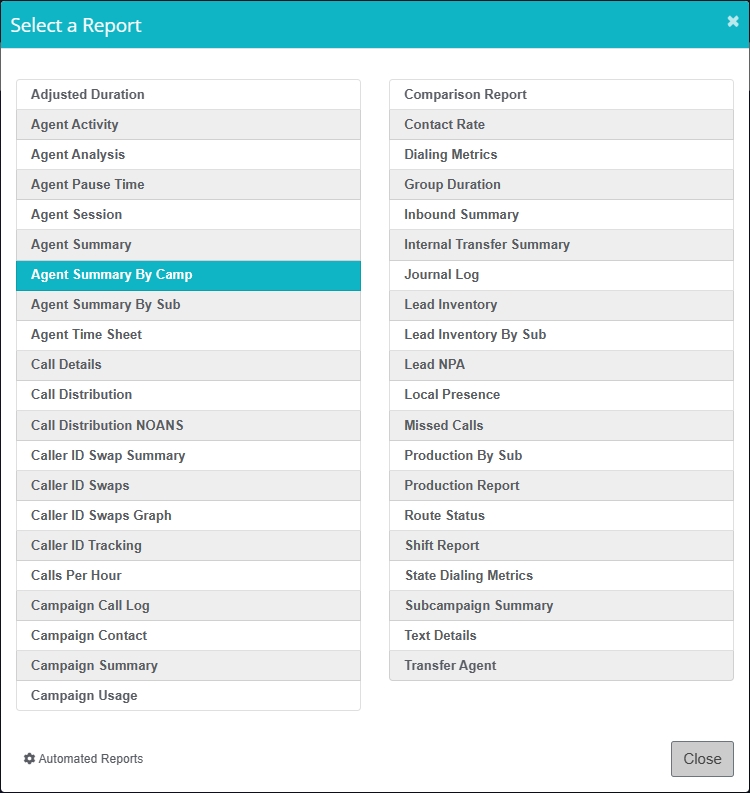
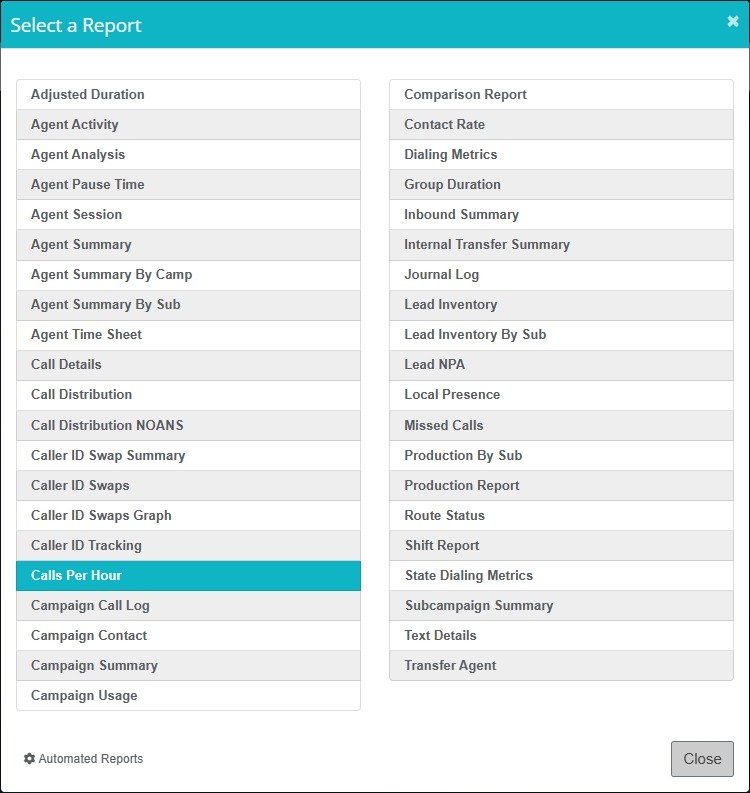
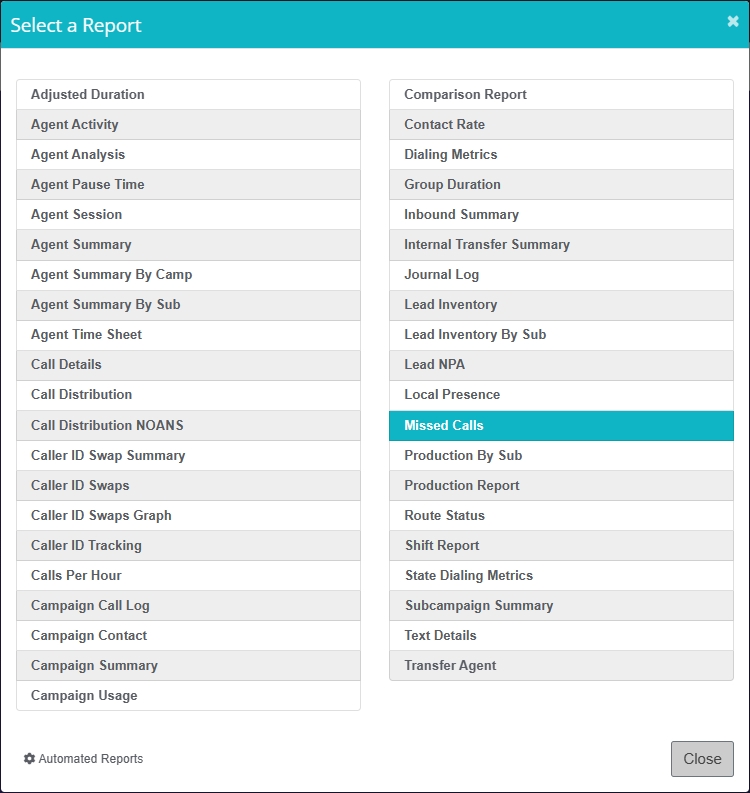
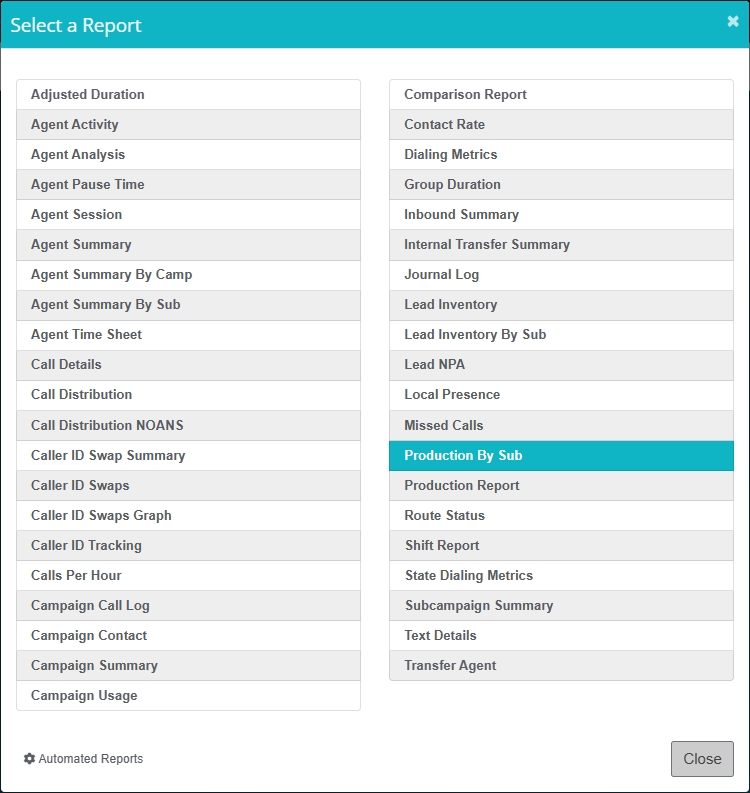
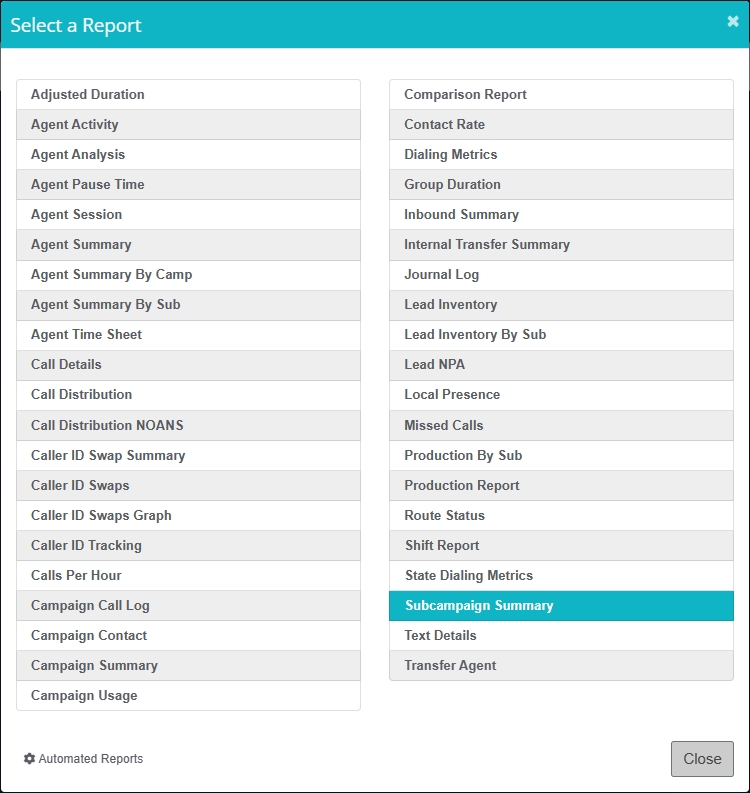
Through the Reports menu, a list of available reports is presented for you to select one and open the corresponding report area. Keep in mind that the list of reports may vary based on user’s specific deployment and permissions.
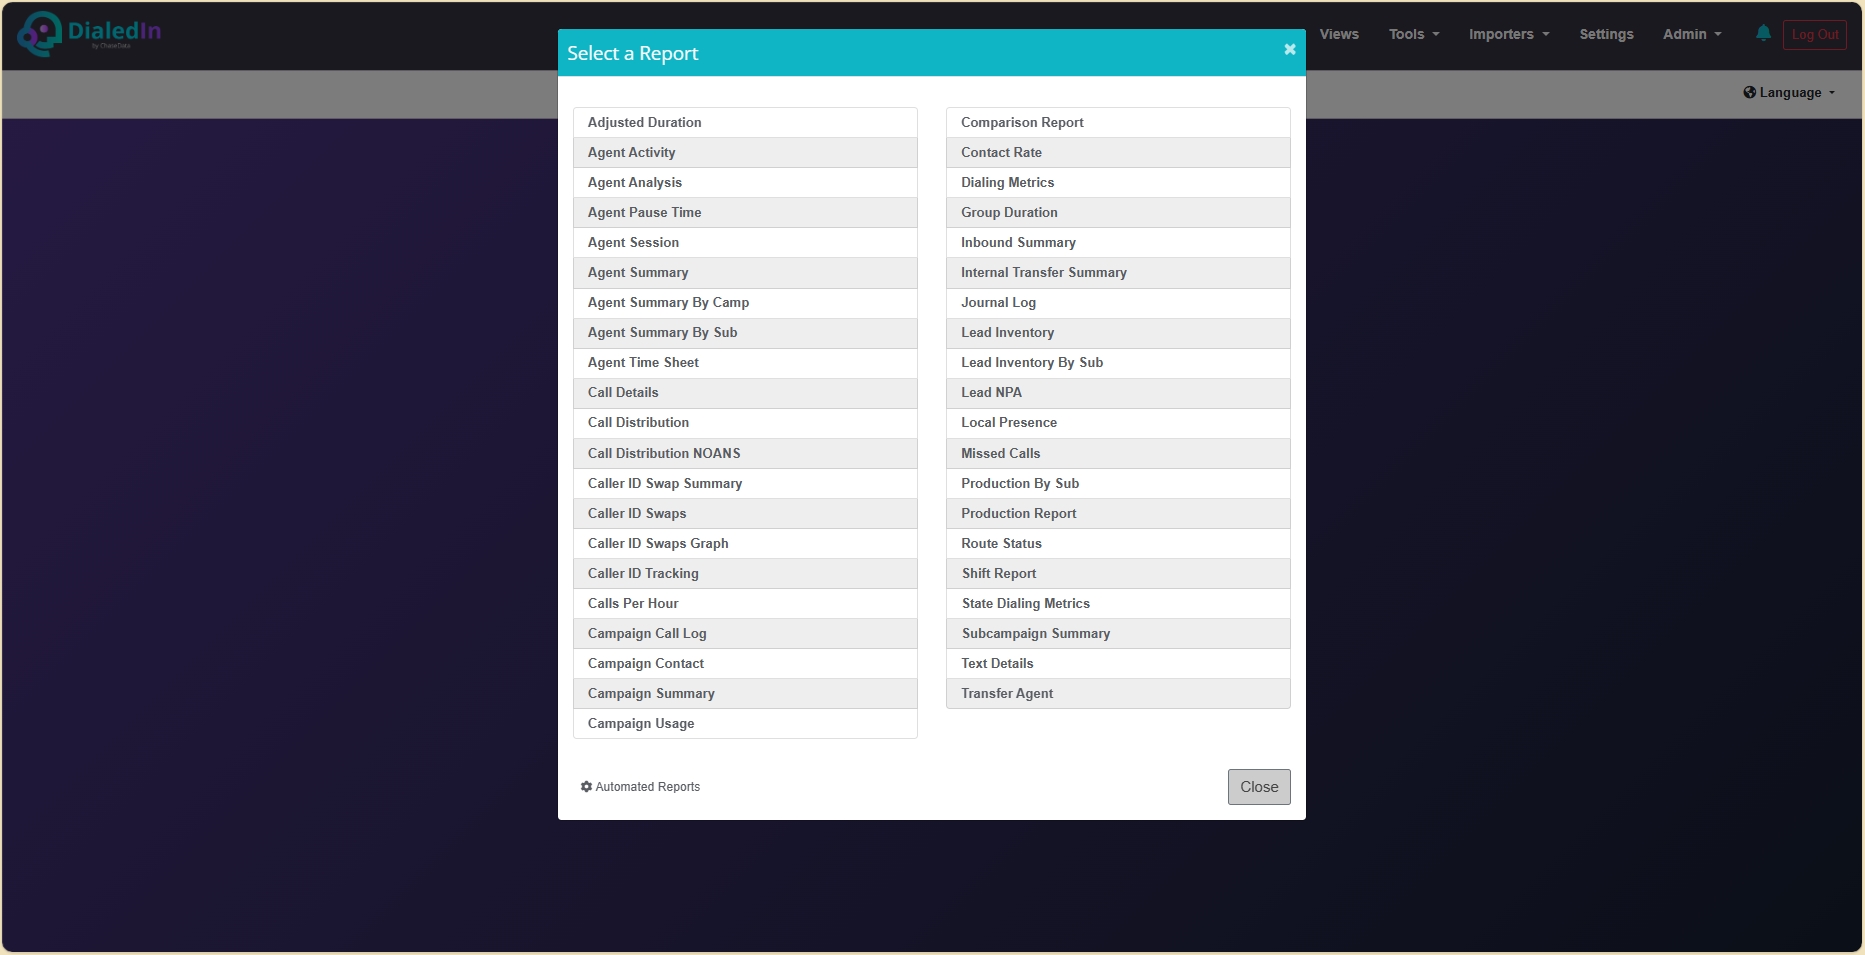
Following, we present a quick description of each report. Some reports are exclusively used by DialedIn Support for troubleshooting and similar situations, hence a description may not be included here.
Adjusted Duration
This is an internal report for use by DialedIn Support only
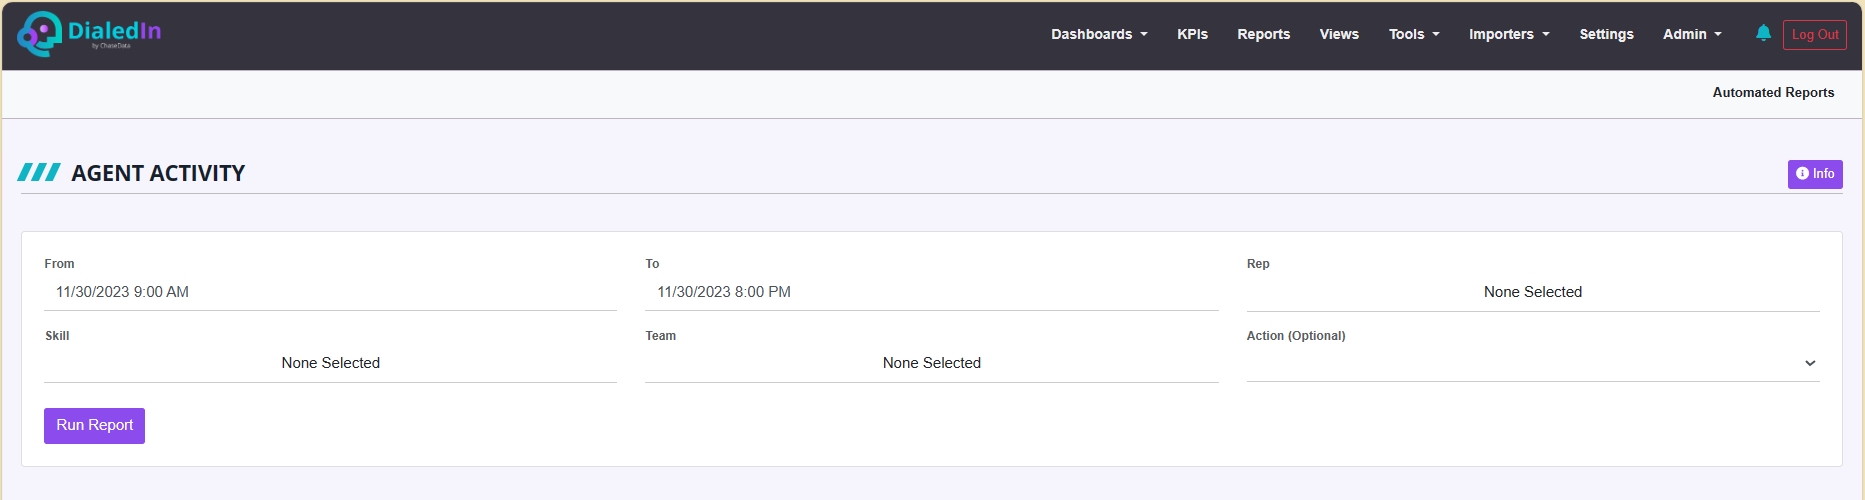
Agent Activity
This report lists all agent activity for the specified date range. Events such as Login, Waiting, Paused, etc. are listed along with the time of occurrence and any details attached to that event.
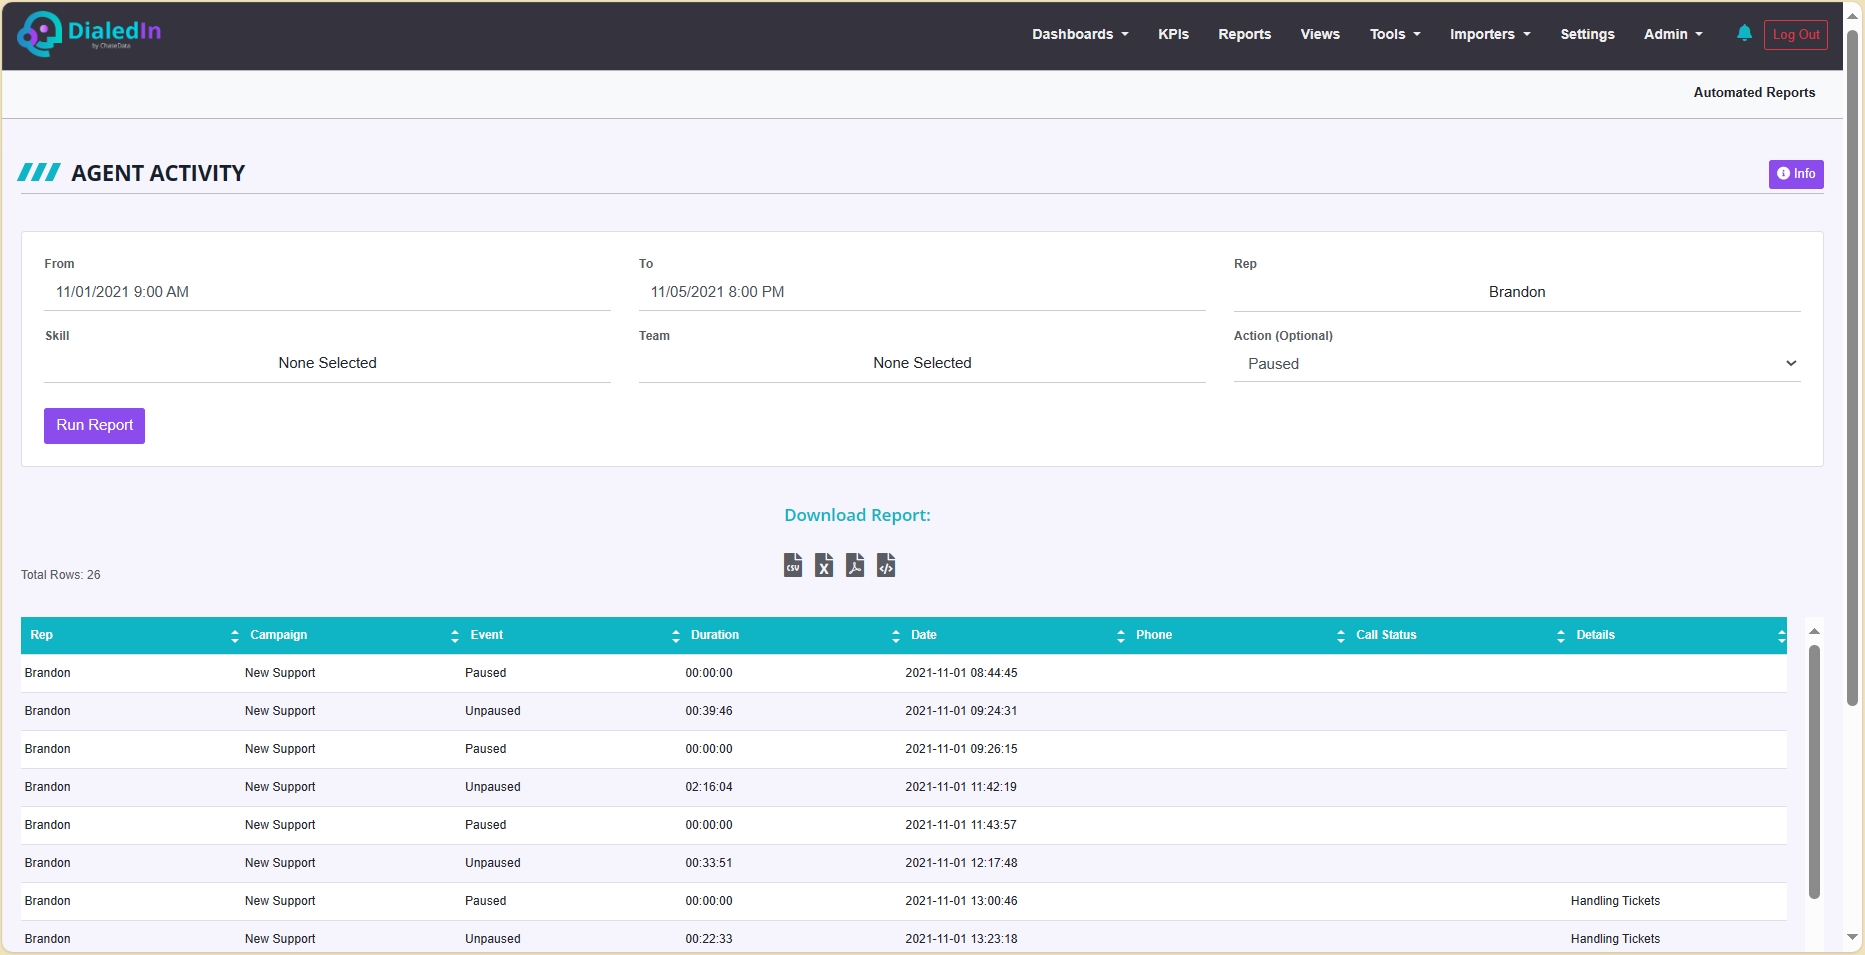
The table results include the following columns:
Rep |
Agent login name |
|---|---|
Campaign |
Dialer Campaign |
Event |
Agent Activity Event |
Duration |
Duration of Event or Call |
Date |
Date of Event or Call |
Phone |
Phone Number |
Call Status |
Disposition of Call |
Details |
Details Attached to Event or Call |
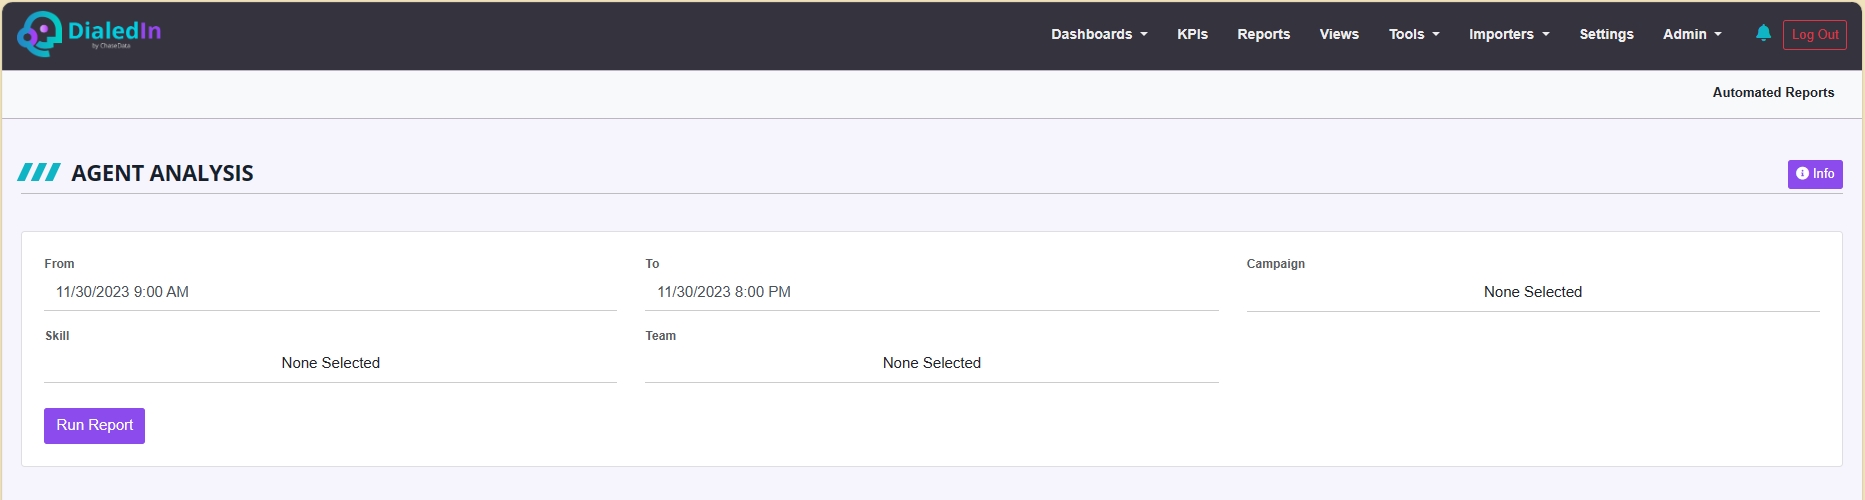
Agent Analysis
This report summarizes agent activity for the specified date range.
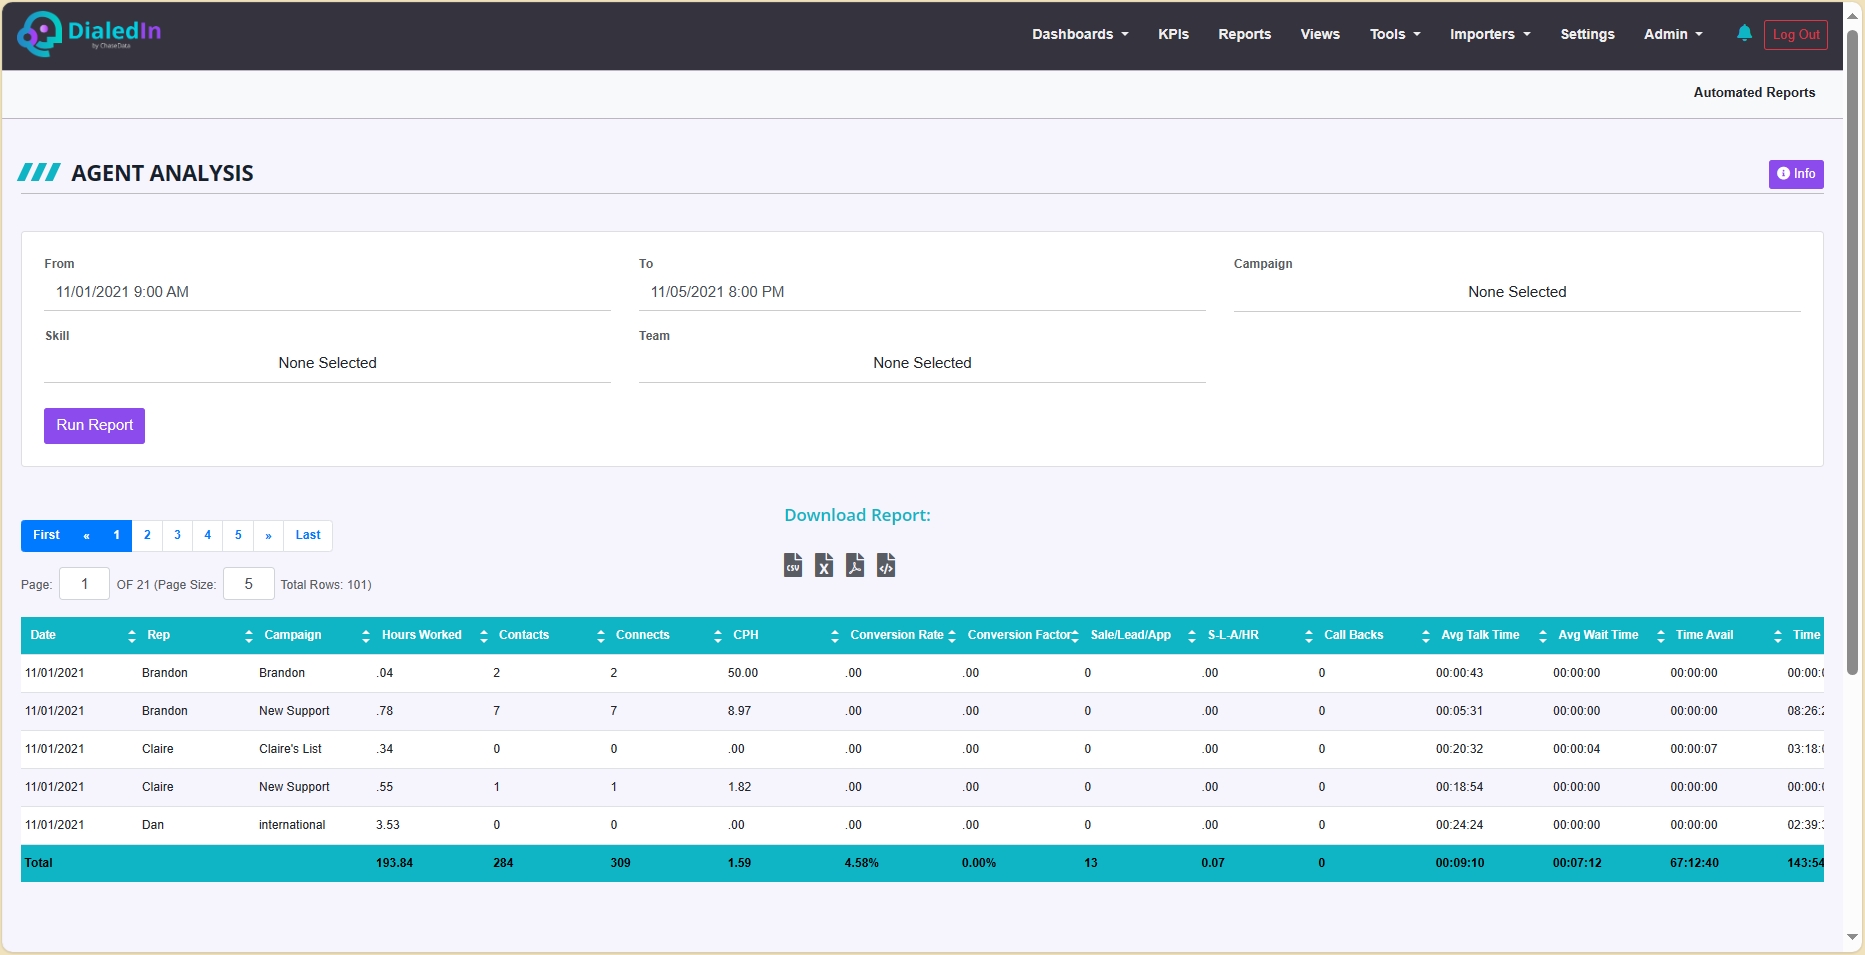
The table results include the following columns:
Date |
Date of Event or Call |
|---|---|
Rep |
Agent login name |
Campaign |
Dialing Campaign |
Hours Worked |
This is total logged in time minus the time spent on paused status. |
Contacts |
Calls where contact was made. This is determined by the disposition type on the wrap up code. |
Connects |
Calls that connected. This is determined by the disposition type on the wrap up code. |
CPH |
This is the total amount of connects divided by the total hours worked. |
Conversion Rate |
Ratio of Sales/Leads/App disposition divided by total contacts. |
Conversion Factor |
Sales/Leads/App per Contact per hour. |
Sale/Lead/App |
Sales/Leads/App call status. This is determined by the disposition type on the wrap up code. |
S-L-A/HR |
Total Sales/Leads/App dispositions divided by the worked hours. |
Call Backs |
Calls Dispositioned as AGENTSPCB |
Avg Talk Time |
Total time spent on calls divided by the number of calls passed to agents. |
Agent CPA
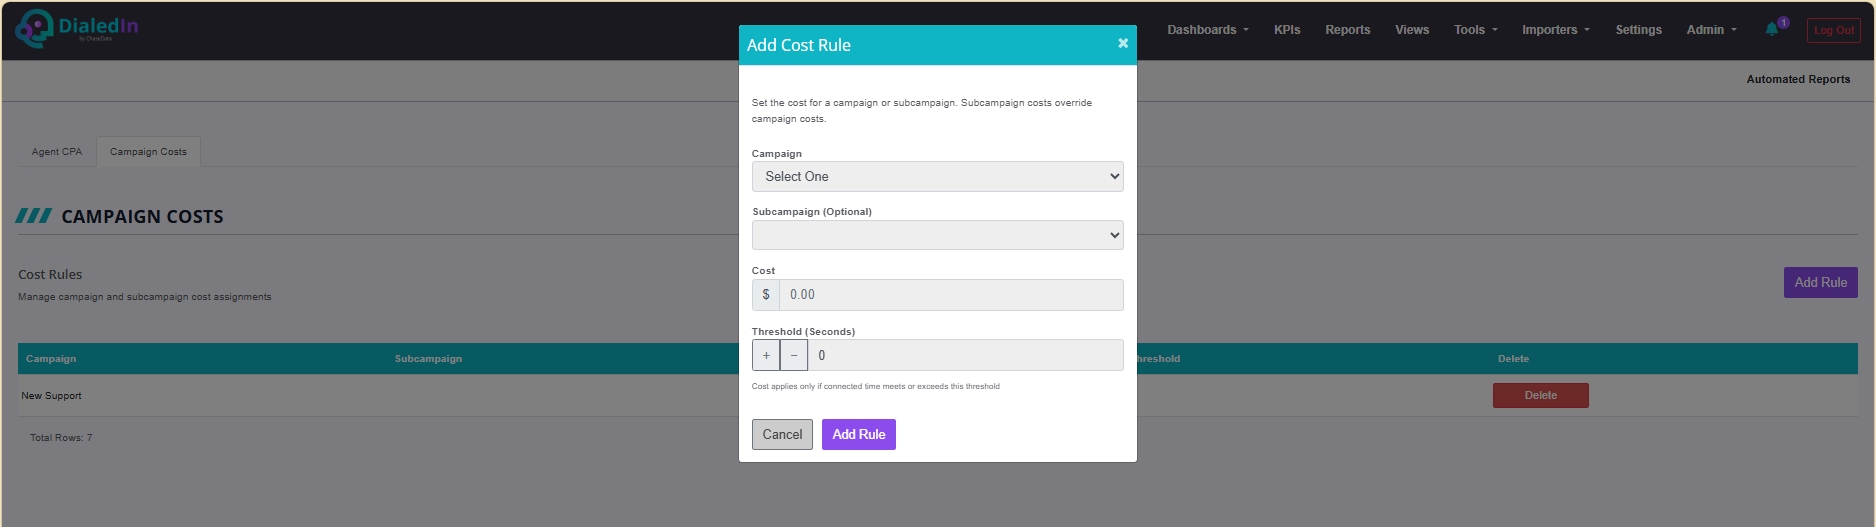
This report provides similar insight as the Agent Summary Report, but adding cost information, including the cost of campaign activity and the cost per acquisition (CPA), which can be split by campaign and sub-campaign. The cost calculations are based on the configured parameters that the user enters in the Campaign Costs tab.
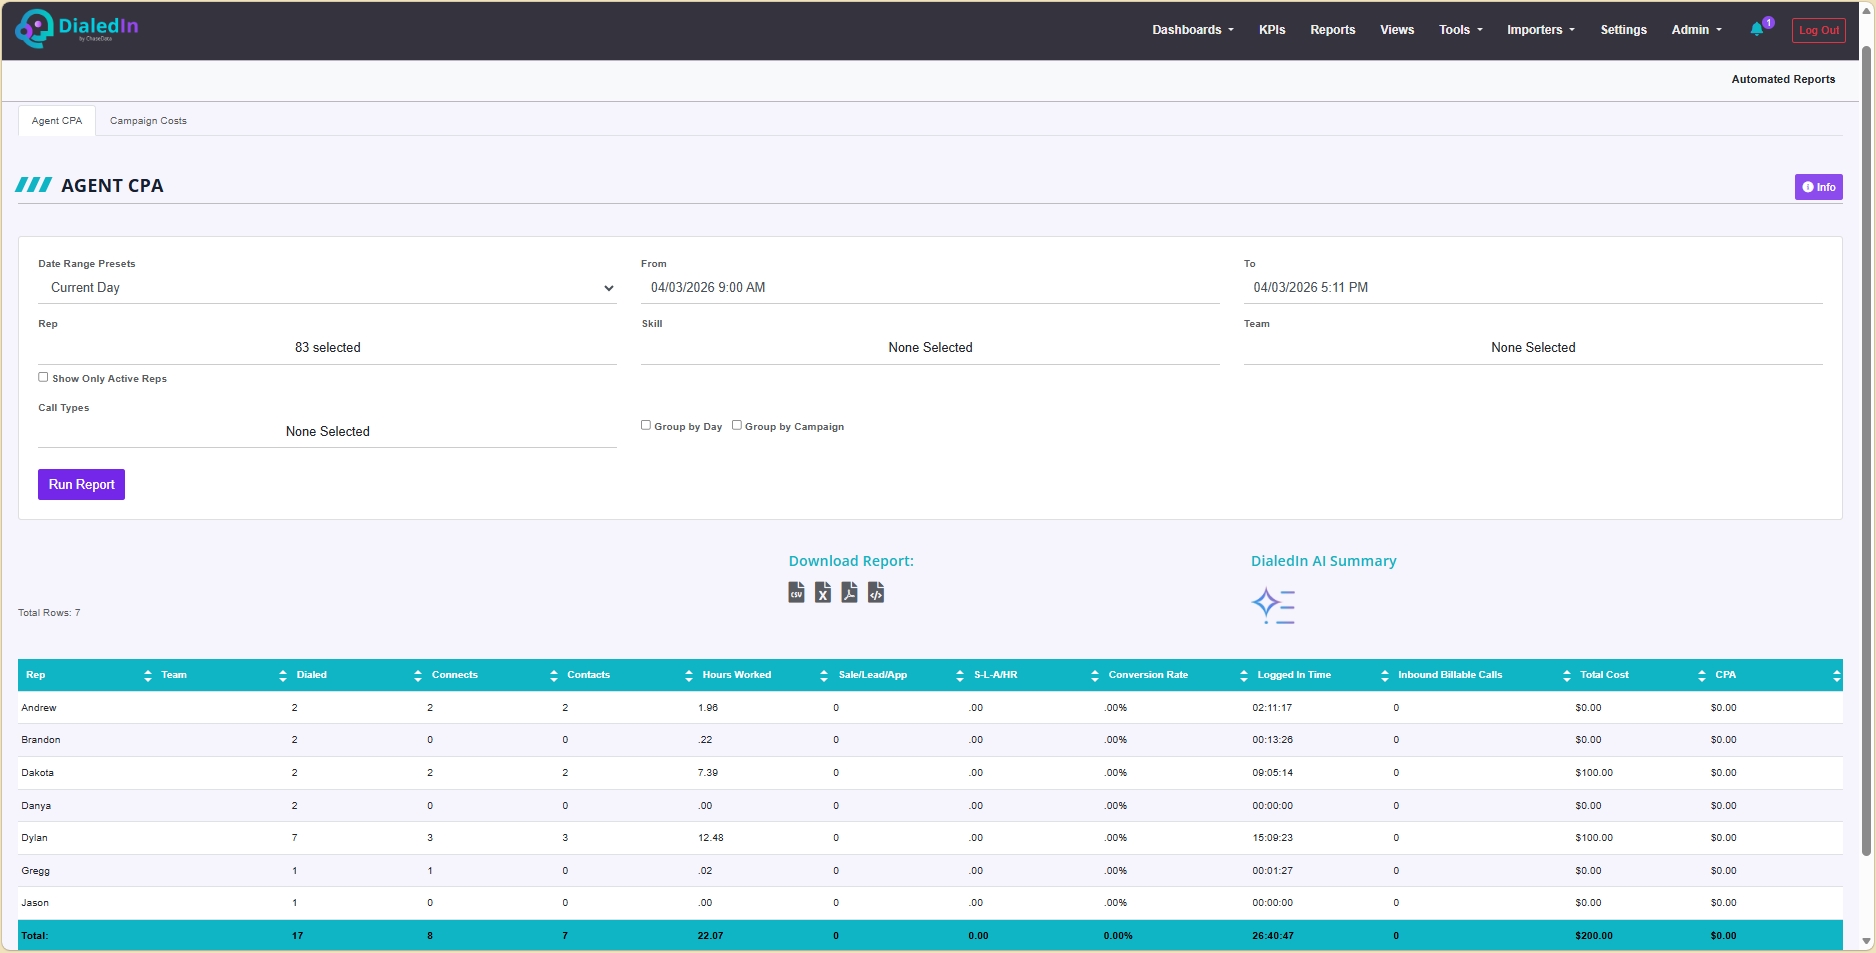
The table results include the following columns (within the date range selected):
Rep |
The agent's login identifier |
|---|---|
Team |
The |
Dialed |
The total number of |
Connects |
Number of calls that connected, as determined by the disposition type on the wrap up code |
Contacts |
Number of calls where a contact was made, as determined by the disposition type on the wrap up code |
Hours Worked |
The agent time resulting from substracting the time spent on paused status to the time that the agent was logged-in |
Sale/Lead/App |
Number of calls that resulted in a Sales/Leads/App status, as determined by the disposition type on the wrap up code |
S-L-A/HR |
The rate of Sales/Leads/App dispositions over Hours Worked |
Conversion Rate |
The rate of Sales/Leads/App dispositions over total Contacts |
Logged In Time |
The total time that the agent was logged-in |
Inbound Billable Calls |
Number of Inbound calls that were dispositioned as a Contact and that had an associated cost based on the campaign, sub-campaign and duration, as defined in the Campaign Costs tab |
Total Cost |
The cost of the Campaign/Sub-campaign multiplied by the number of Contacts. These costs are based on the rules defined in the Campaign Costs tab |
CPA |
CPA is Cost per Aquisition, which is the calculated cost per Sales/Lead/App over Total Cost, for those calls that satisfy the Threshold defined under the Campaign Costs tab |
Agent Pause Time
This report lists all of the breaks an agent took during the specified date range.
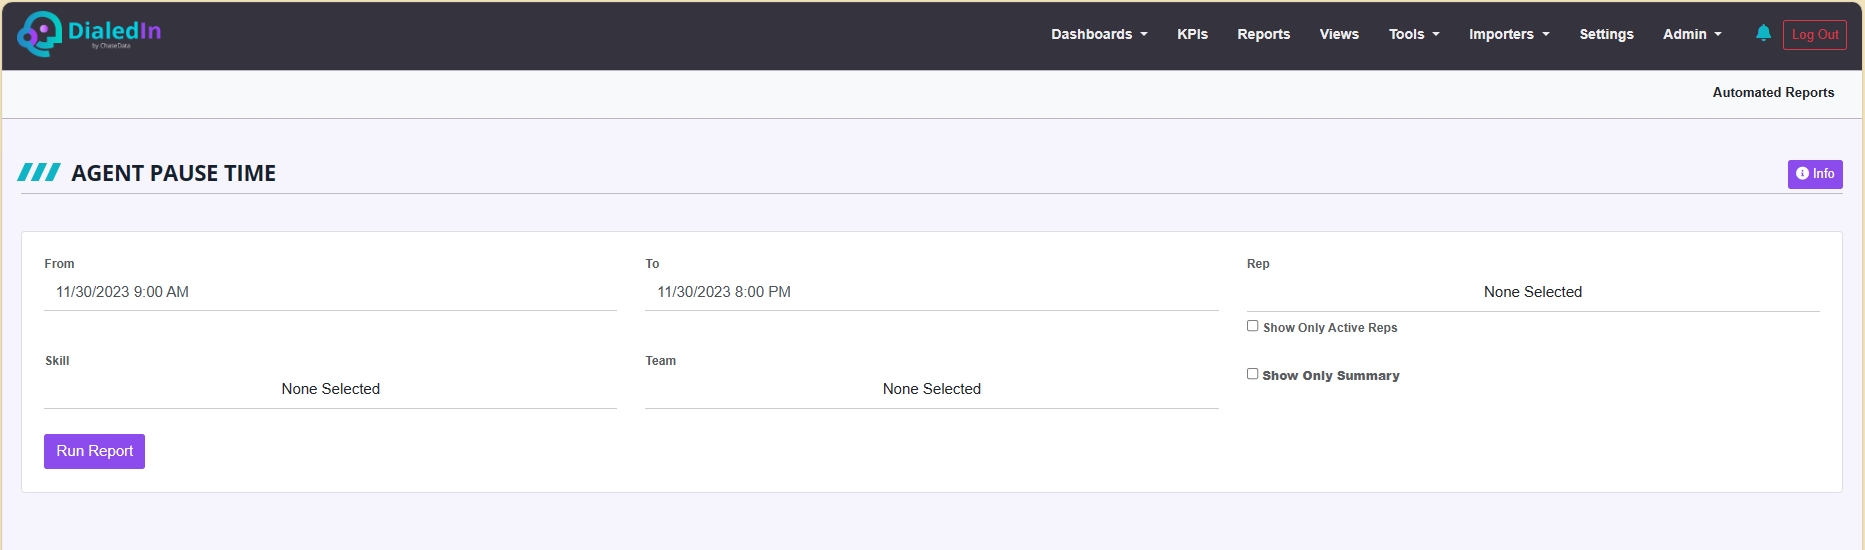
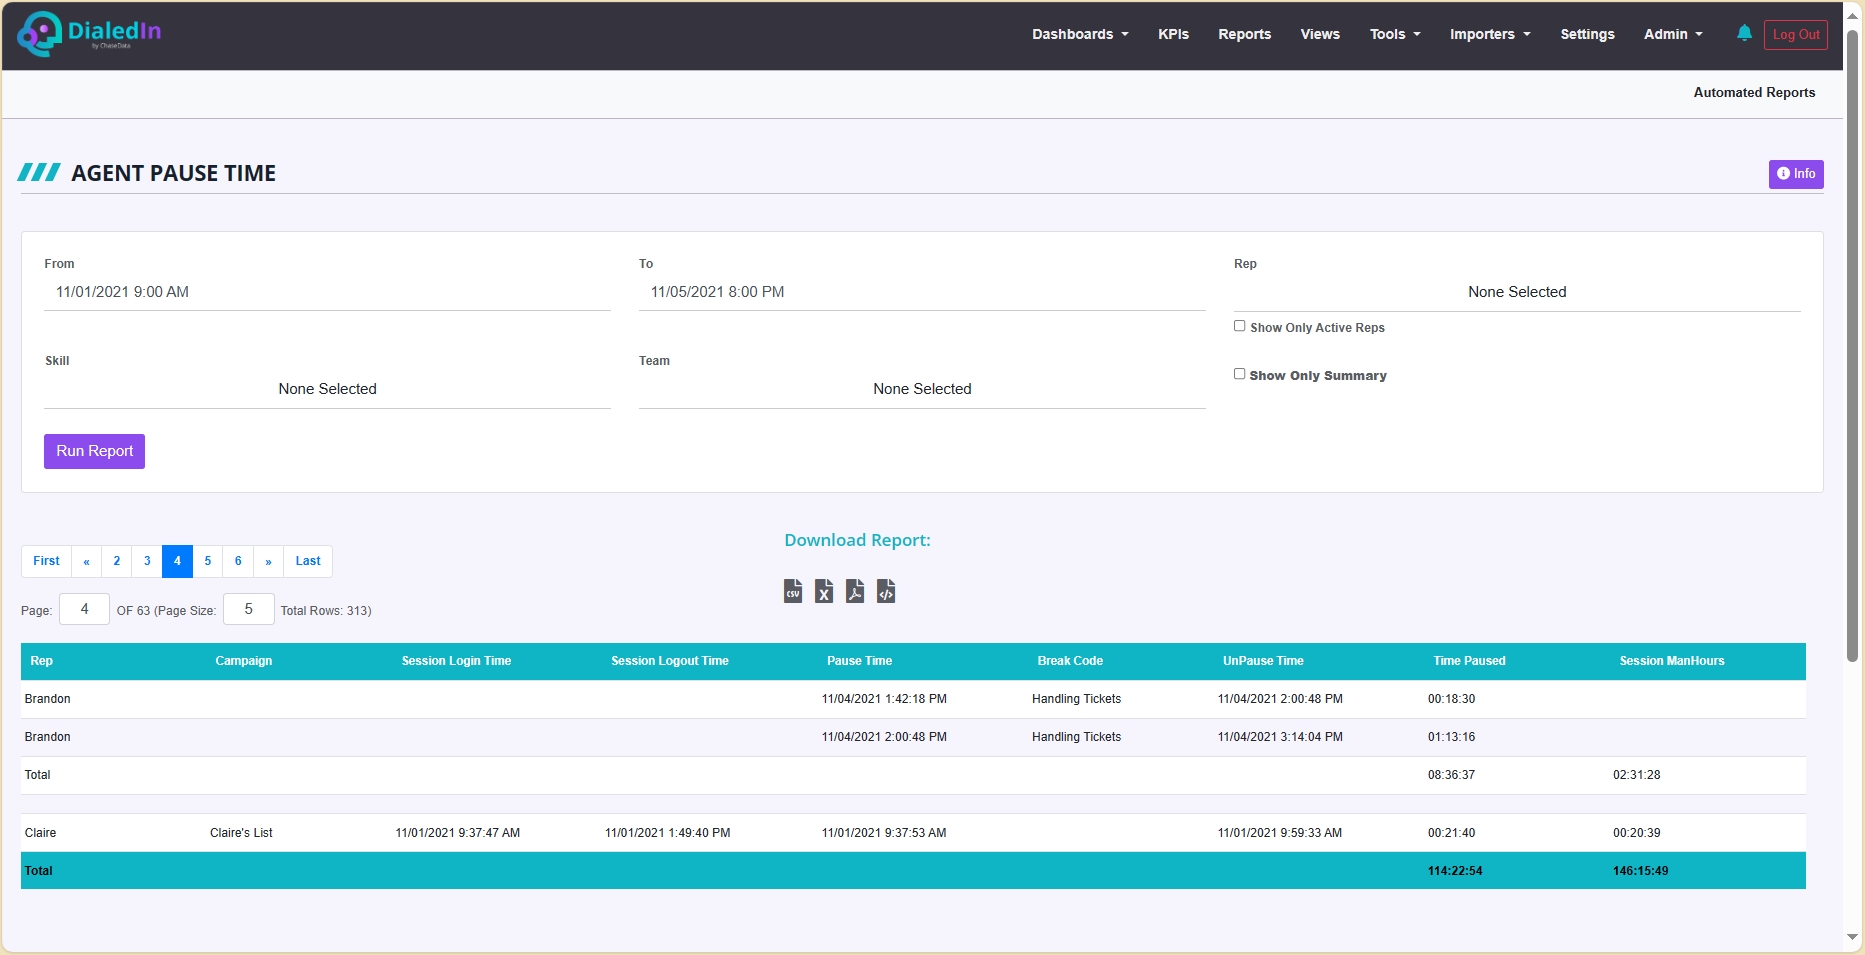
The table results include the following columns:
Rep |
Agent login name |
|---|---|
Campaign |
Dialing Campaign |
Session Login Time |
Session Login Time |
Session Logout Time |
Session Logout Time |
Pause Time |
Time the Agent Started a Pause |
Break Code |
Reason for Pause |
UnPause Time |
Time the Agent Ended a Pause |
Time Paused |
Total Time Paused |
Session ManHours |
Session Man-Hours |
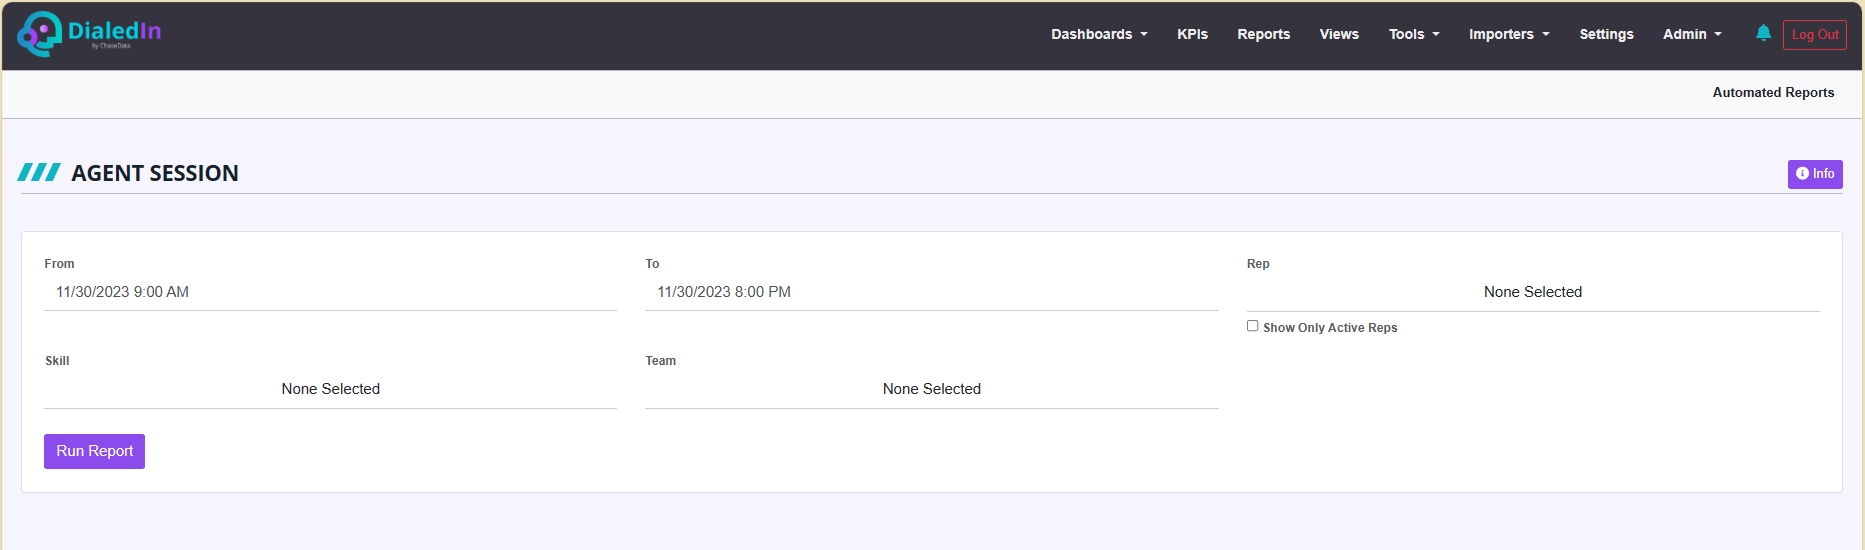
Agent Session
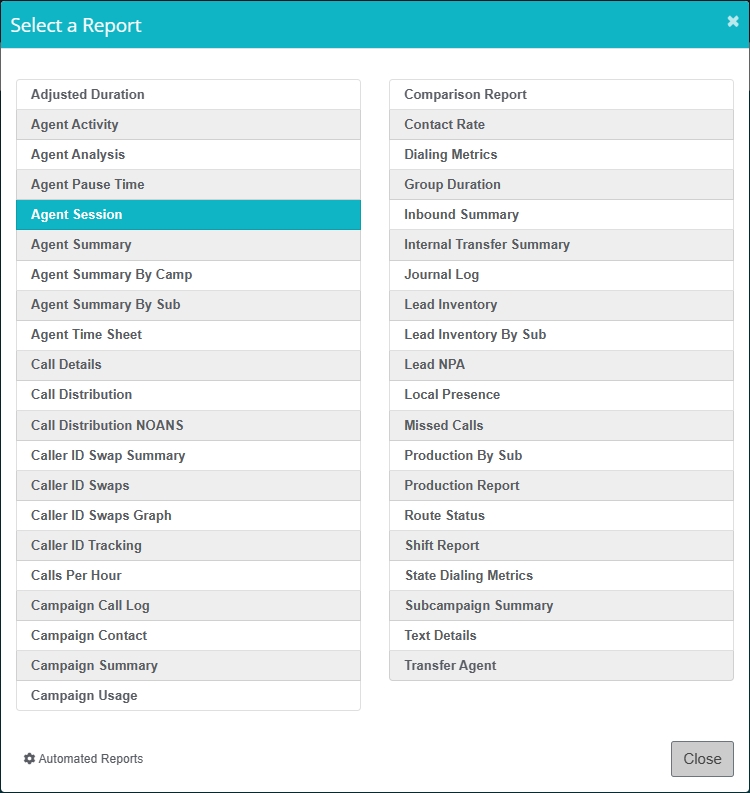
This report lists all the login sessions for each Rep by day, along with the time of their first call.
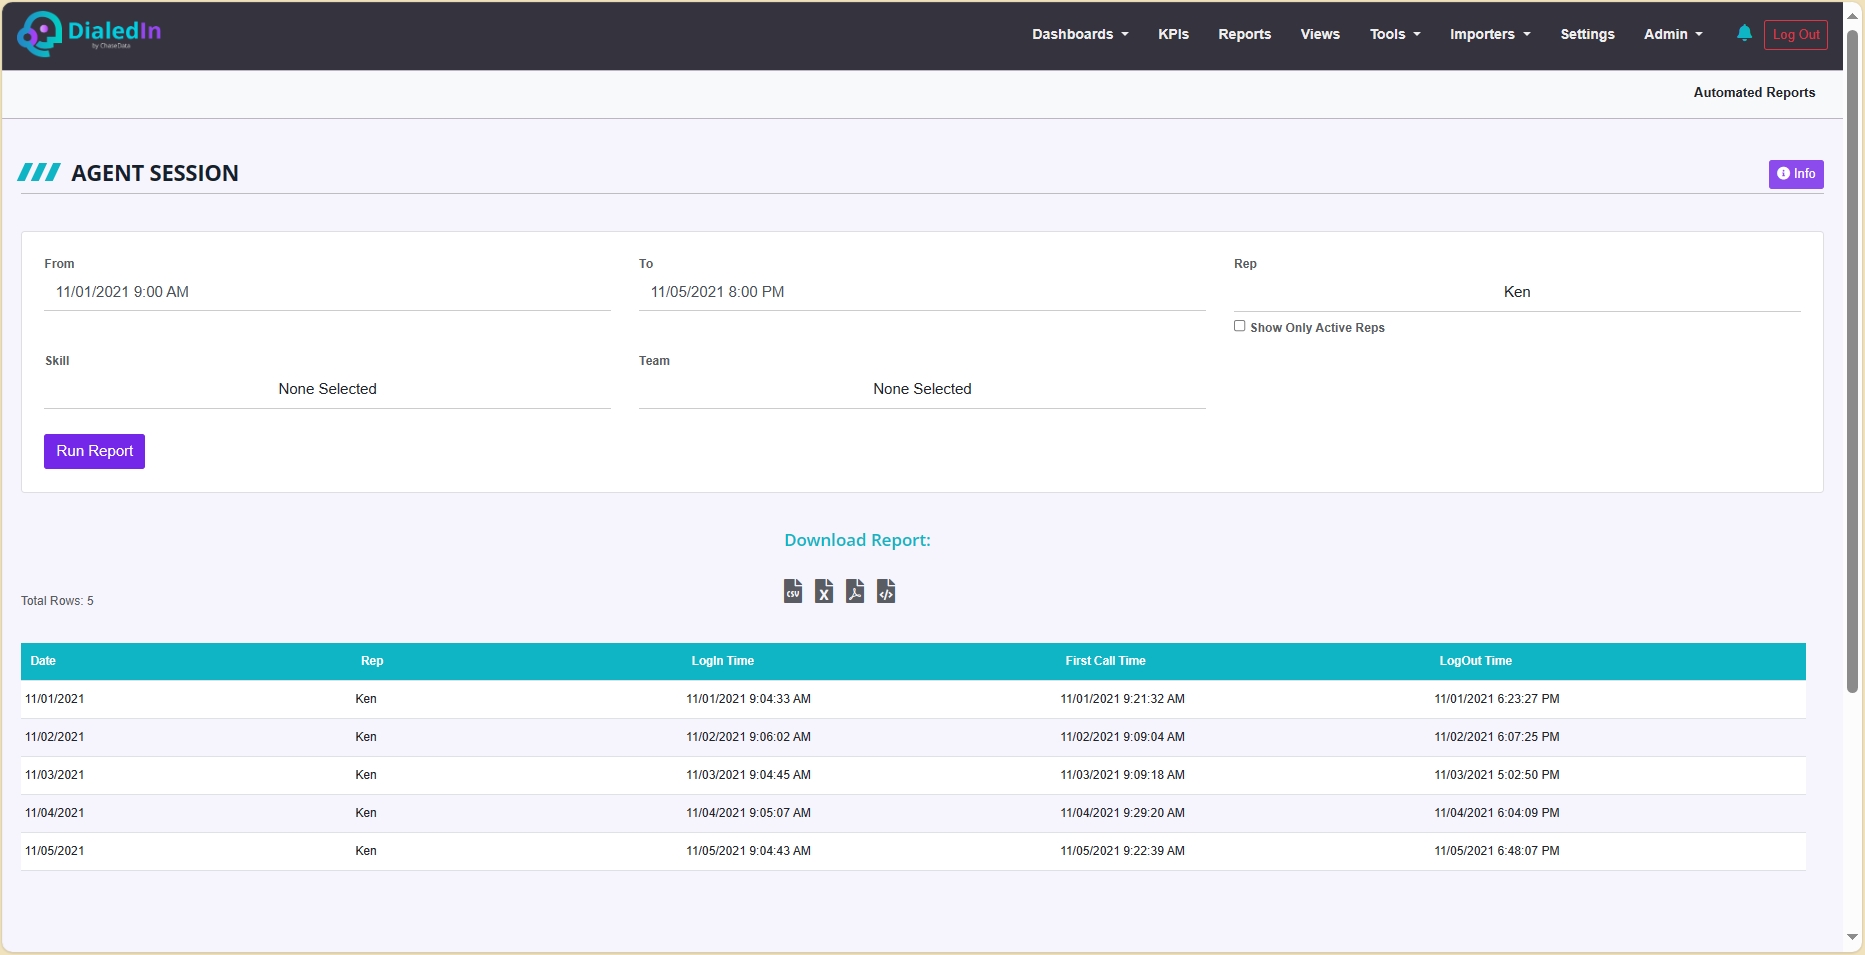
The table results include the following columns:
Date |
Date of Event or Call |
|---|---|
Rep |
Agent login name |
LogIn Time |
Time the Agent Logged In |
First Call Time |
Time the Agent made or received their first call |
LogOut Time |
Time the Agent Logged Out |
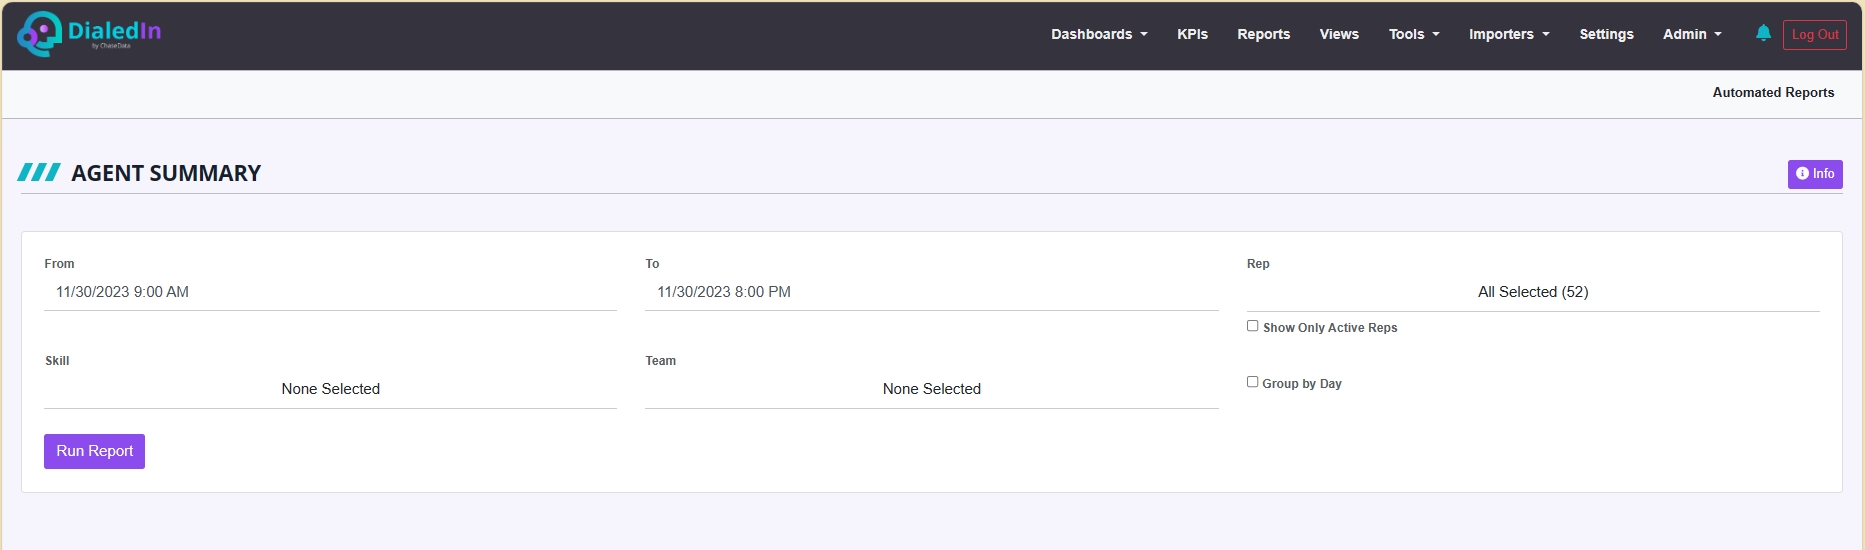
Agent Summary
This report summarizes agent activity for the specified date range.
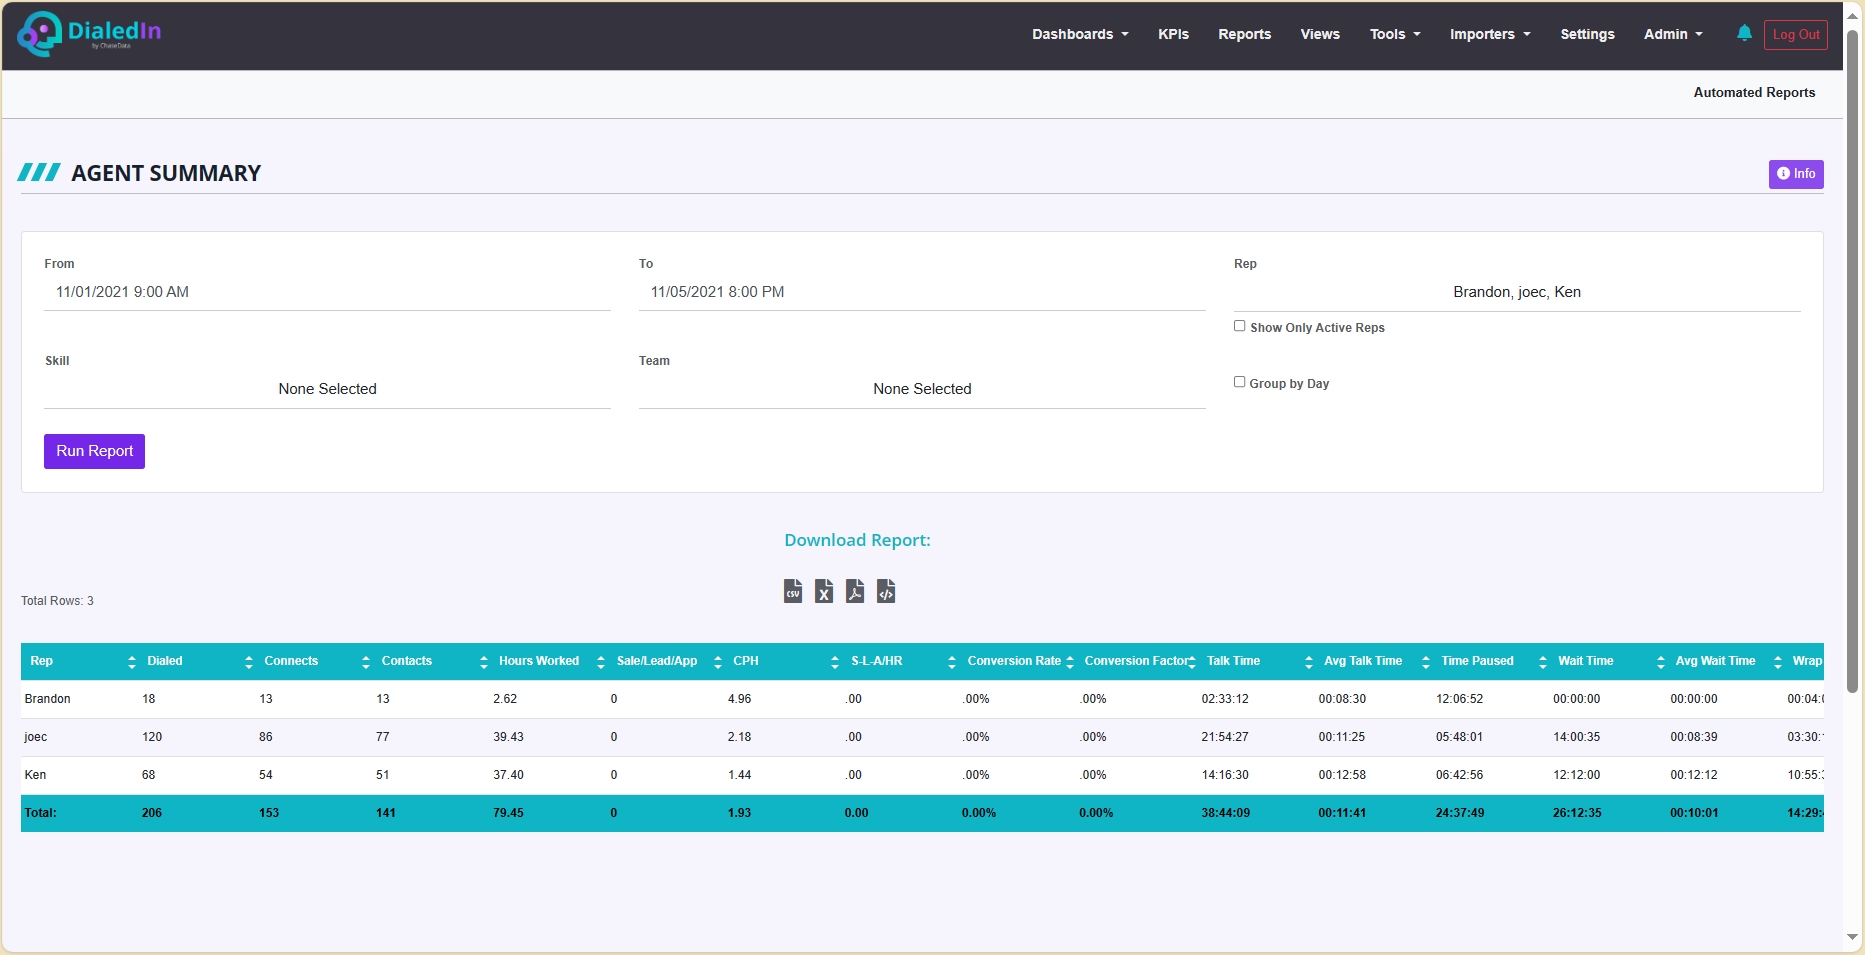
The table results include the following columns:
Date |
Date of Event or Call |
|---|---|
Rep |
Agent login name |
Dialed |
Total Dial Attempts |
Connects |
Calls that connected. This is determined by the disposition type on the wrap up code. |
Contacts |
Calls where contact was made. This is determined by the disposition type on the wrap up code. |
Hours Worked |
This is total logged in time minus the time spent on paused status. |
Sale/Lead/App |
Sales/Leads/App call status. This is determined by the disposition type on the wrap up code. |
CPH |
This is the total amount of connects divided by the total hours worked. |
S-L-A/HR |
Total Sales/Leads/App dispositions divided by the worked hours. |
Conversion Rate |
Ratio of Sales/Leads/App disposition divided by total contacts. |
Conversion Factor |
Sales/Leads/App per Contact per hour. |
Talk Time |
Total Time Spent on Calls |
Avg Talk Time |
Total time spent on calls divided by the number of calls passed to agents. |
Time Paused |
Total Time Paused |
Wait Time |
Total Time Spent Waiting |
Avg Wait Time |
Total Time Spent Waiting divided by the number of times the agent went into waiting status. |
Wrap Up Time |
Total Wrap-up Time. Wrap up time includes after call work and time spent previewing a lead. |
Avg Wrap Up Time |
Total Wrap Up Time divided by the number of times the agent went into wrap up time status. |
Logged In Time |
Total Time Logged In |
Agent Summary By Camp
This report summarizes agent activity for the selected campaigns and specified date range.
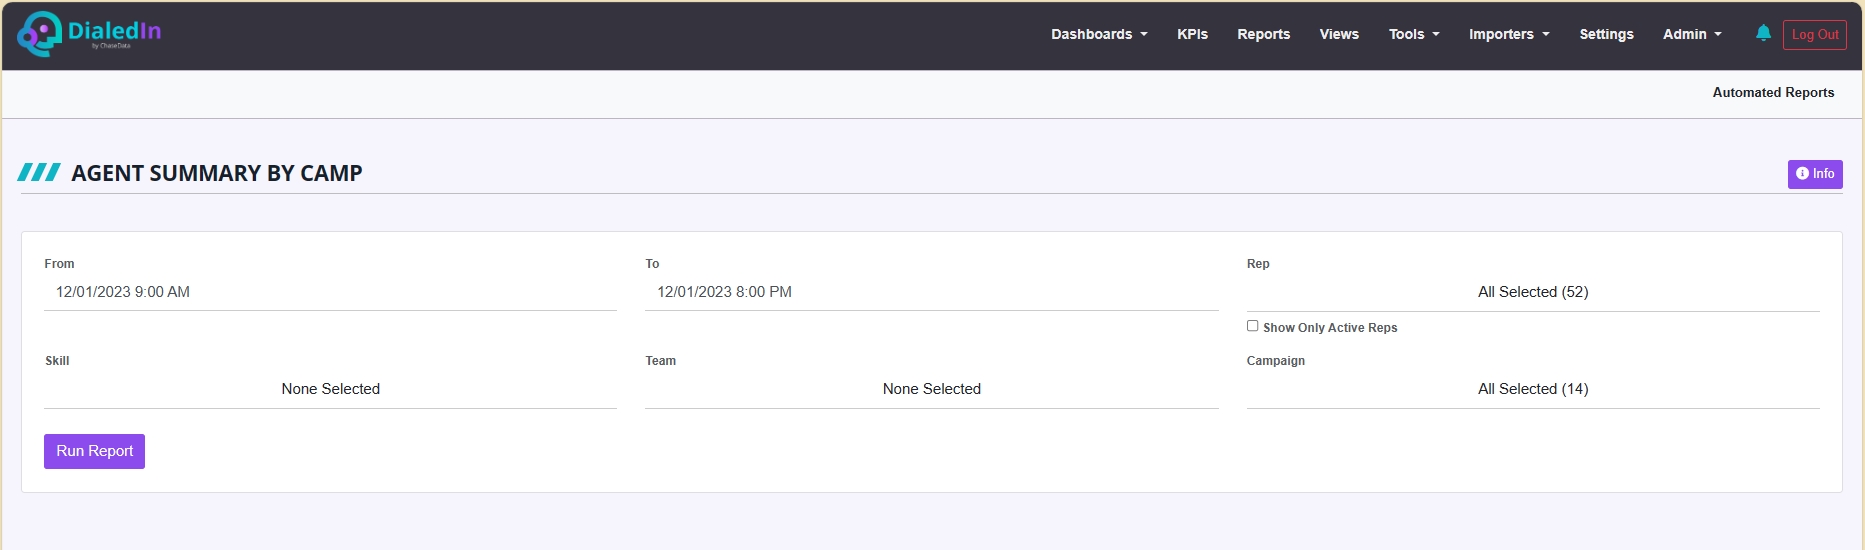
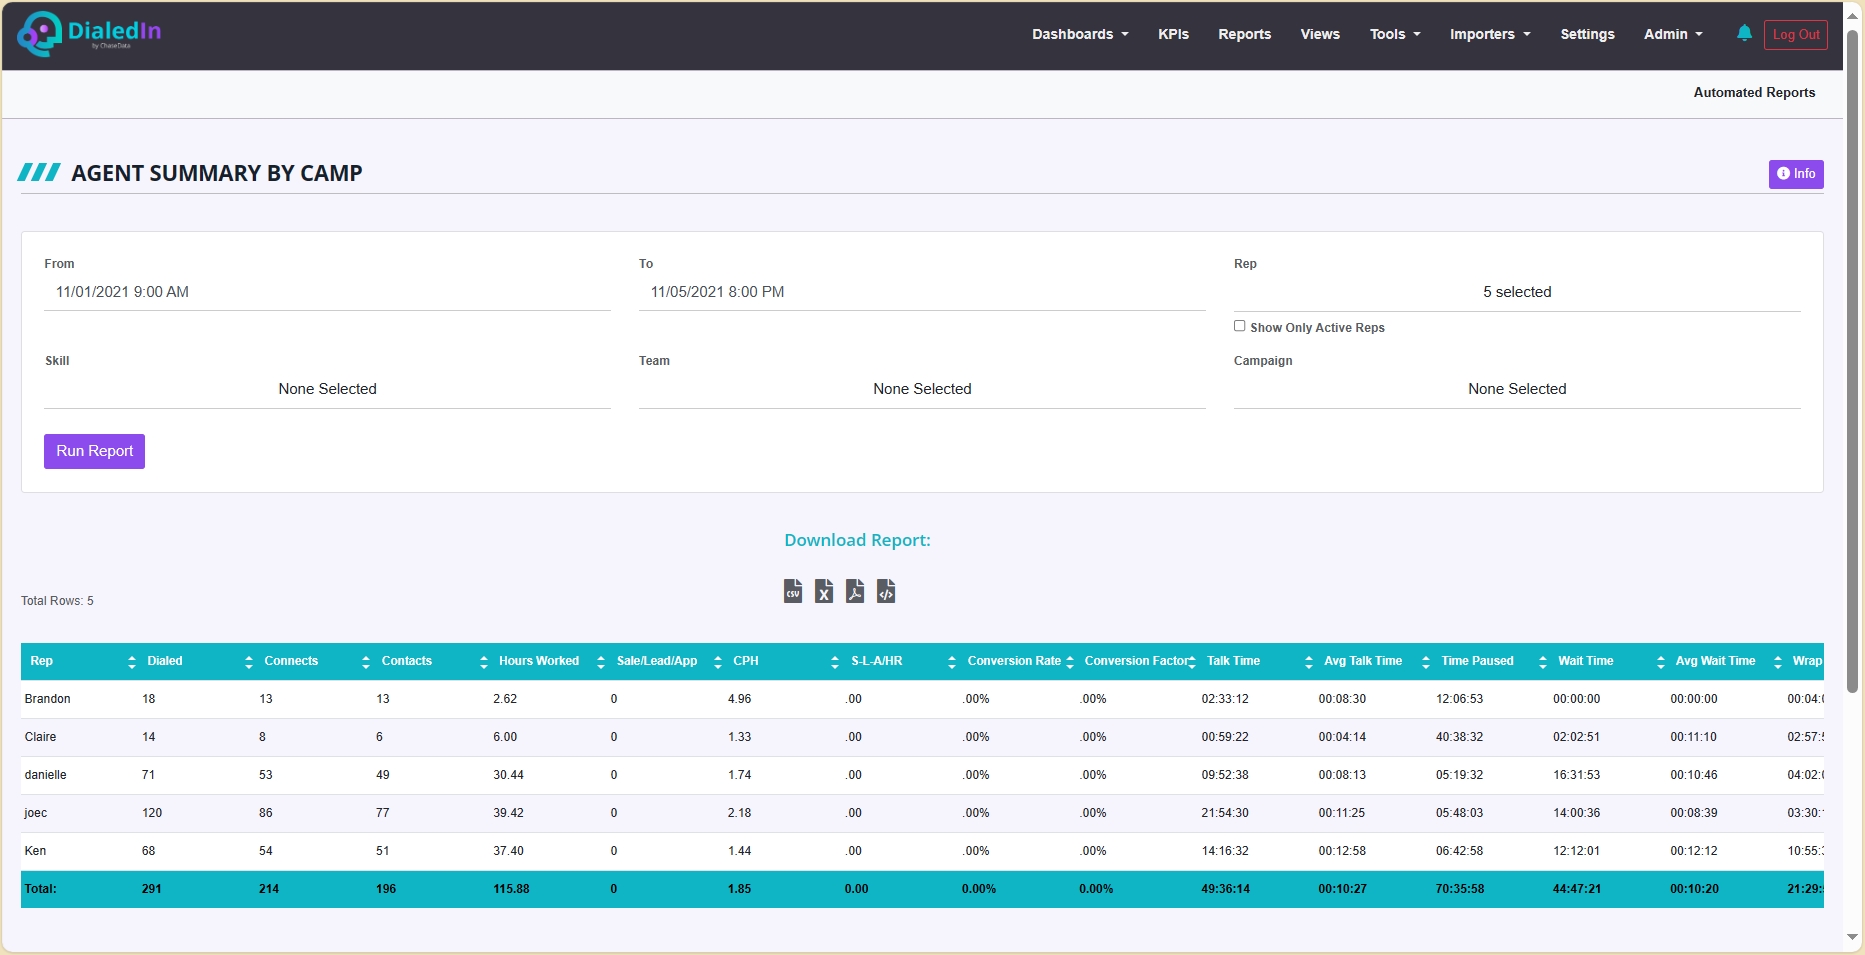
The table results include the following columns:
Rep |
Agent login name |
|---|---|
Dialed |
Total Dial Attempts |
Connects |
Calls that connected. This is determined by the disposition type on the wrap up code. |
Contacts |
Calls where contact was made. This is determined by the disposition type on the wrap up code. |
Hours Worked |
This is total logged in time minus the time spent on paused status. |
Sale/Lead/App |
Sales/Leads/App call status. This is determined by the disposition type on the wrap up code. |
CPH |
This is the total amount of connects divided by the total hours worked. |
S-L-A/HR |
Total Sales/Leads/App dispositions divided by the worked hours. |
Conversion Rate |
Ratio of Sales/Leads/App disposition divided by total contacts. |
Conversion Factor |
Sales/Leads/App per Contact per hour. |
Talk Time |
Total Time Spent on Calls |
Avg Talk Time |
Total time spent on calls divided by the number of calls passed to agents. |
Time Paused |
Total Time Paused |
Wait Time |
Total Time Spent Waiting |
Avg Wait Time |
Total Time Spent Waiting divided by the number of times the agent went into waiting status. |
Wrap Up Time |
Total Wrap-up Time. Wrap up time includes after call work and time spent previewing a lead. |
Avg Wrap Up Time |
Total Wrap Up Time divided by the number of times the agent went into wrap up time status. |
Logged In Time |
Total Time Logged In |
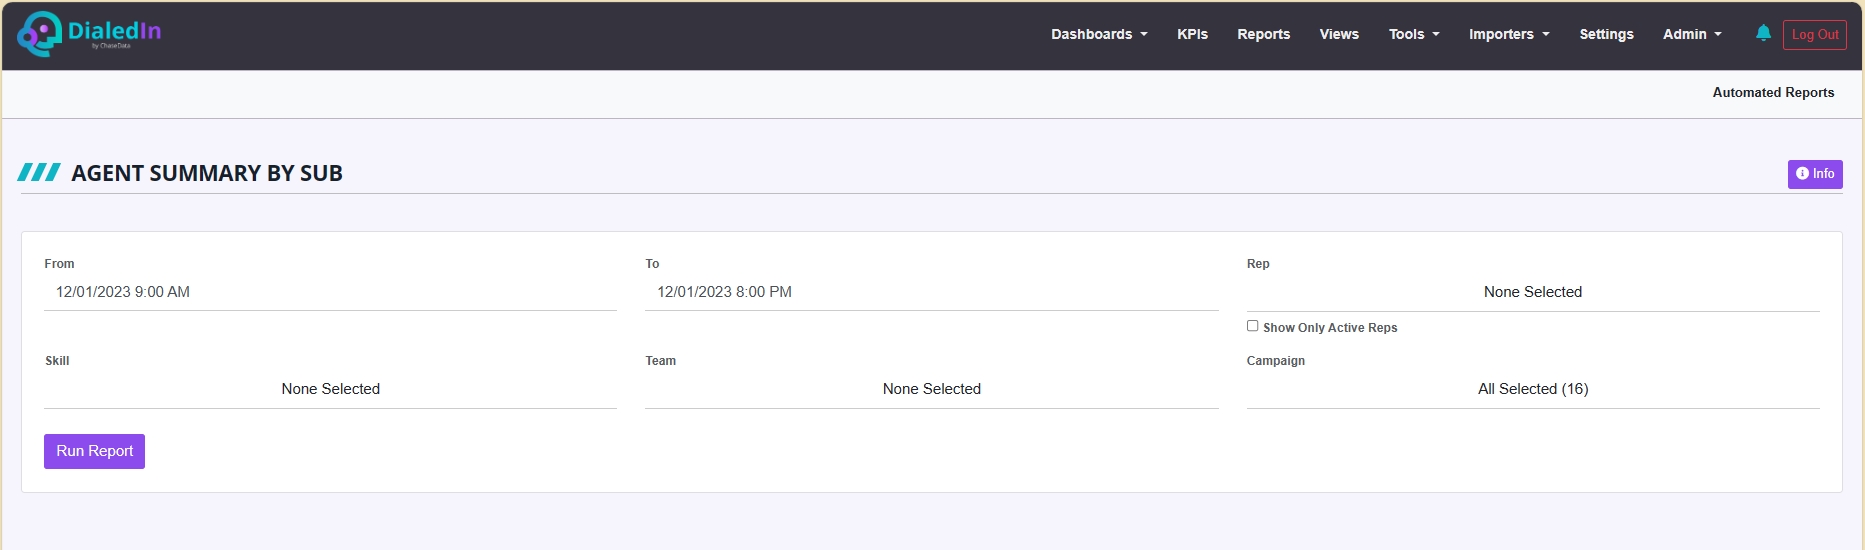
Agent Summary By Sub
This report summarizes agent activity by sub-campaign for the selected campaigns and specified date range.
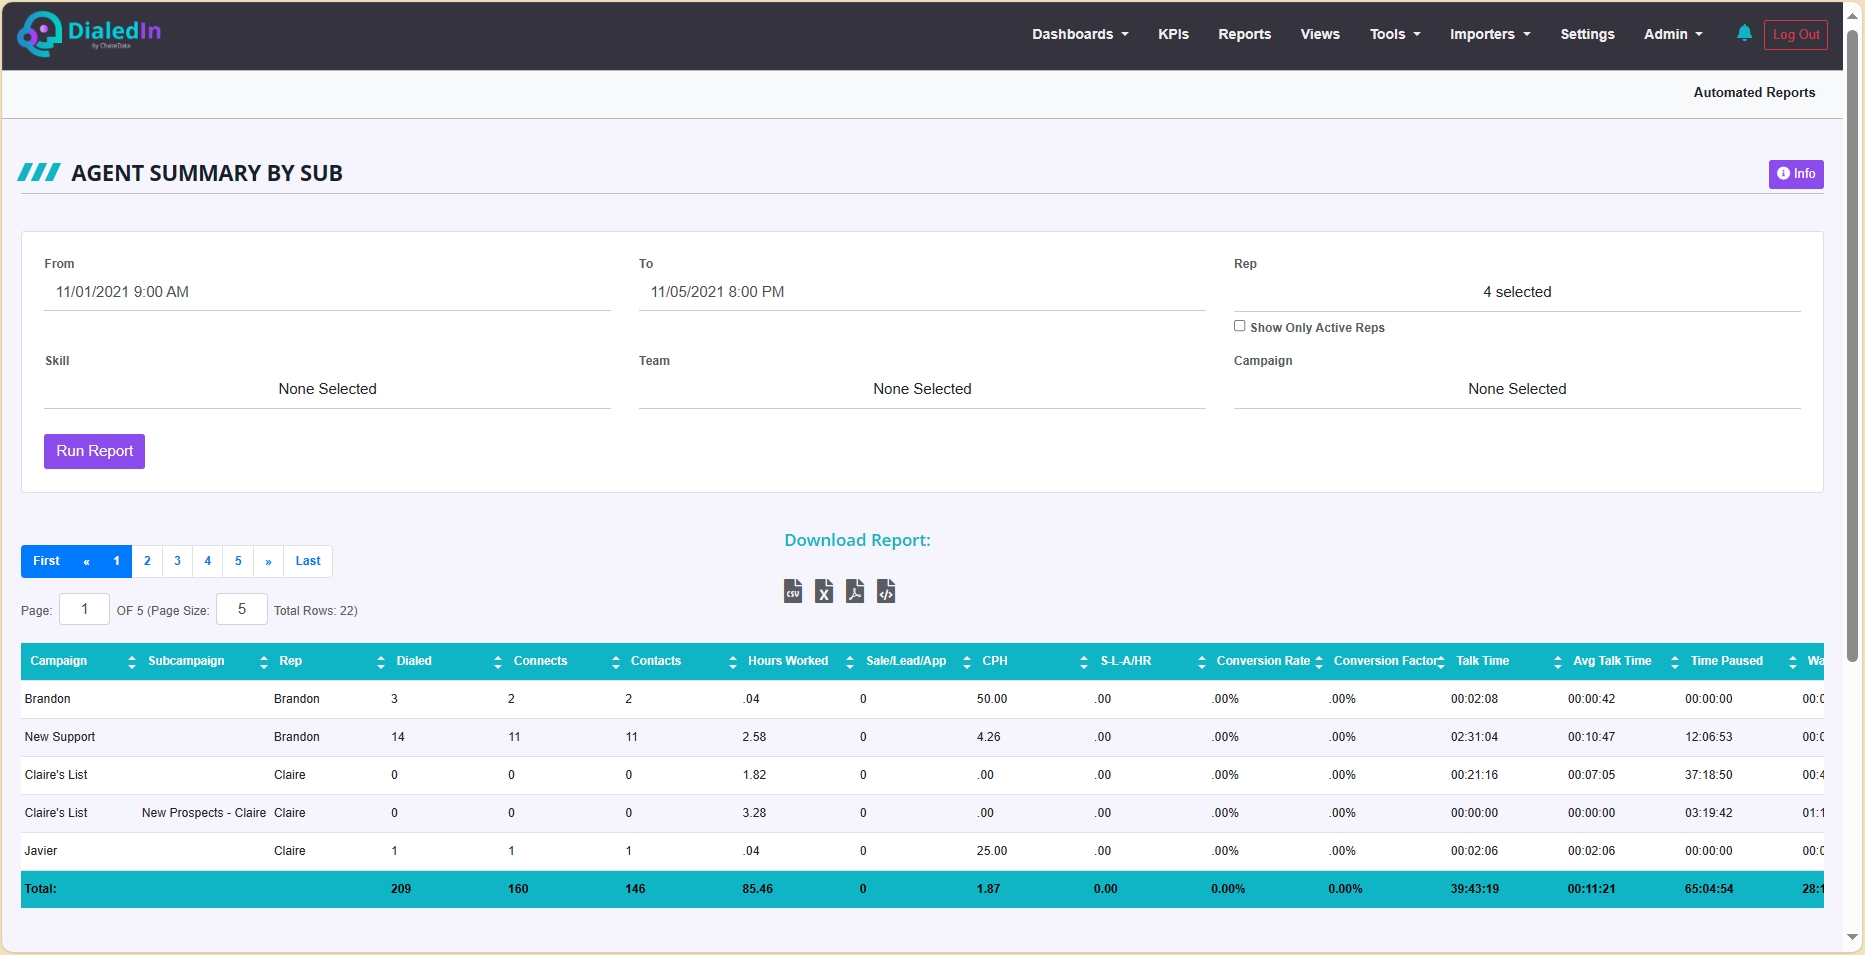
The table results include the following columns:
Campaign |
Dialing Campaign |
|---|---|
Subcampaign |
Dialing Sub-Campaign |
Rep |
Agent login name |
Dialed |
Total Dial Attempts |
Connects |
Calls that connected. This is determined by the disposition type on the wrap up code. |
Contacts |
Calls where contact was made. This is determined by the disposition type on the wrap up code. |
Hours Worked |
This is total logged in time minus the time spent on paused status. |
Sale/Lead/App |
Sales/Leads/App call status. This is determined by the disposition type on the wrap up code. |
CPH |
This is the total amount of connects divided by the total hours worked. |
S-L-A/HR |
Total Sales/Leads/App dispositions divided by the worked hours. |
Conversion Rate |
Ratio of Sales/Leads/App disposition divided by total contacts. |
Conversion Factor |
Sales/Leads/App per Contact per hour. |
Talk Time |
Total Time Spent on Calls |
Avg Talk Time |
Total time spent on calls divided by the number of calls passed to agents. |
Time Paused |
Total Time Paused |
Wait Time |
Total Time Spent Waiting |
Avg Wait Time |
Total Time Spent Waiting divided by the number of times the agent went into waiting status. |
Wrap Up Time |
Total Wrap-up Time. Wrap up time includes after call work and time spent previewing a lead. |
Avg Wrap Up Time |
Total Wrap Up Time divided by the number of times the agent went into wrap up time status. |
Logged In Time |
Total Time Logged In |
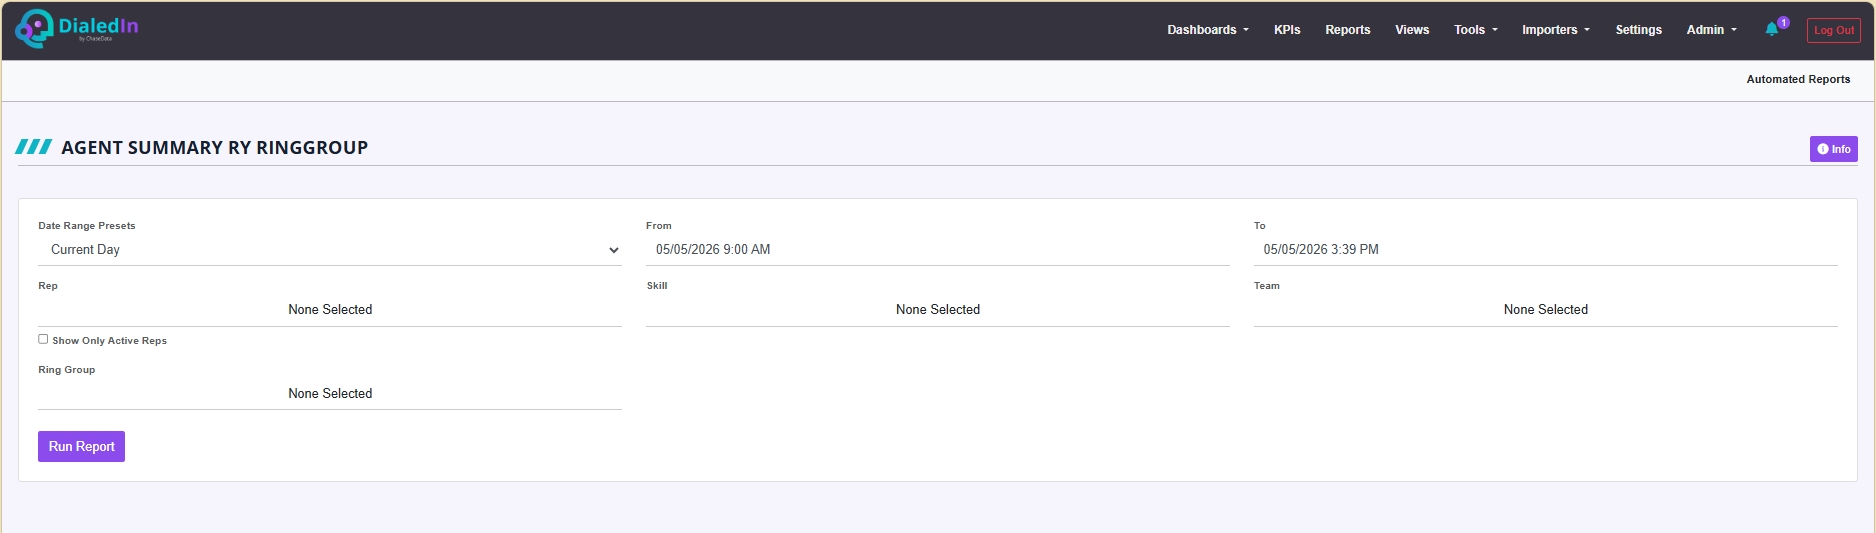
Agent Summary By Ring Group
This report summarizes agent activity for Inbound calls for the selected Ring Groups and the specified date range.
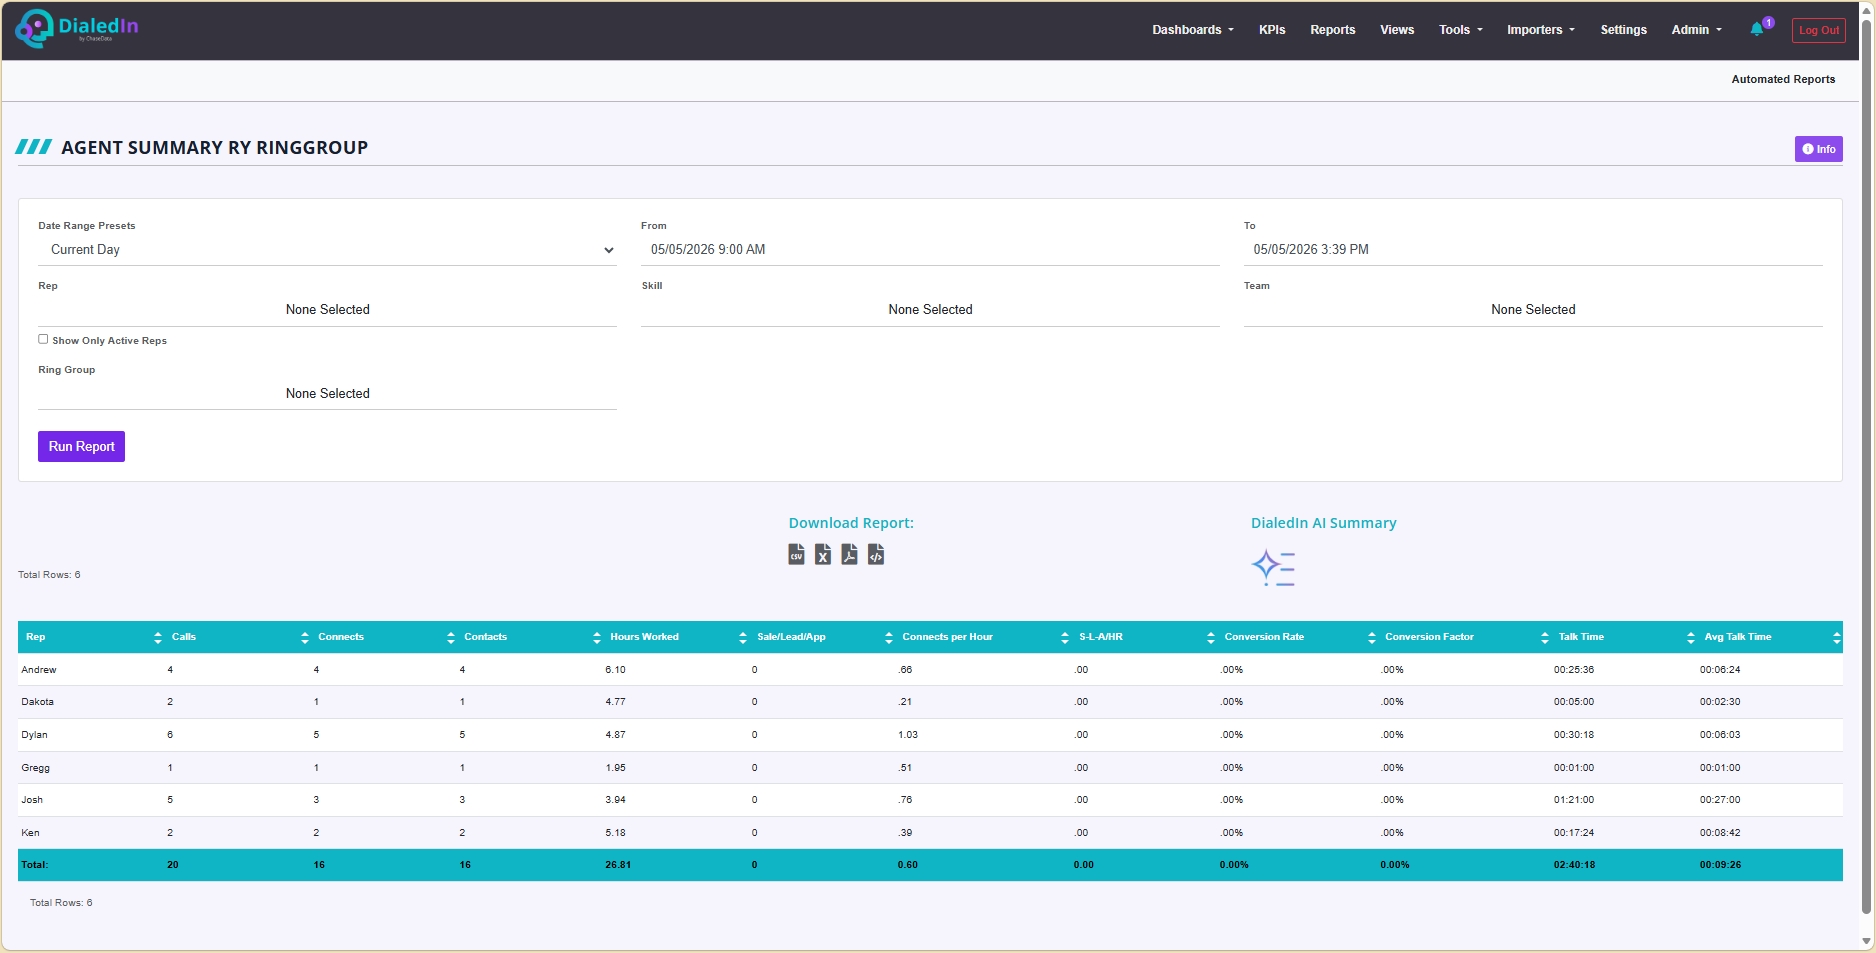
The table results include the following columns:
Rep |
The agent's login identifier |
|---|---|
Calls |
The total number of calls on this agent |
Connects |
Number of calls that connected, as determined by the disposition type on the wrap up code |
Contacts |
Number of calls where a contact was made, as determined by the disposition type on the wrap up code |
Hours Worked |
The agent time resulting from substracting the time spent on paused status to the time that the agent was logged-in. Hours Worked includes all hours, not just on the selected Ring Group |
Sale/Lead/App |
Number of calls that resulted in a Sales/Leads/App status, as determined by the disposition type on the wrap up code |
Connects per Hour |
The rate of Connects per Hours Worked |
S-L-A/HR |
The rate of Sales/Leads/App dispositions per Hours Worked |
Conversion Rate |
The rate of Sales/Leads/App of total Contacts |
Conversion Factor |
The rate of Sales/Leads/App of total Contacts per hour |
Talk Time |
The total time spent on calls |
Avg Talk Time |
The total time spent on calls divided by the amount of calls passed to agents |
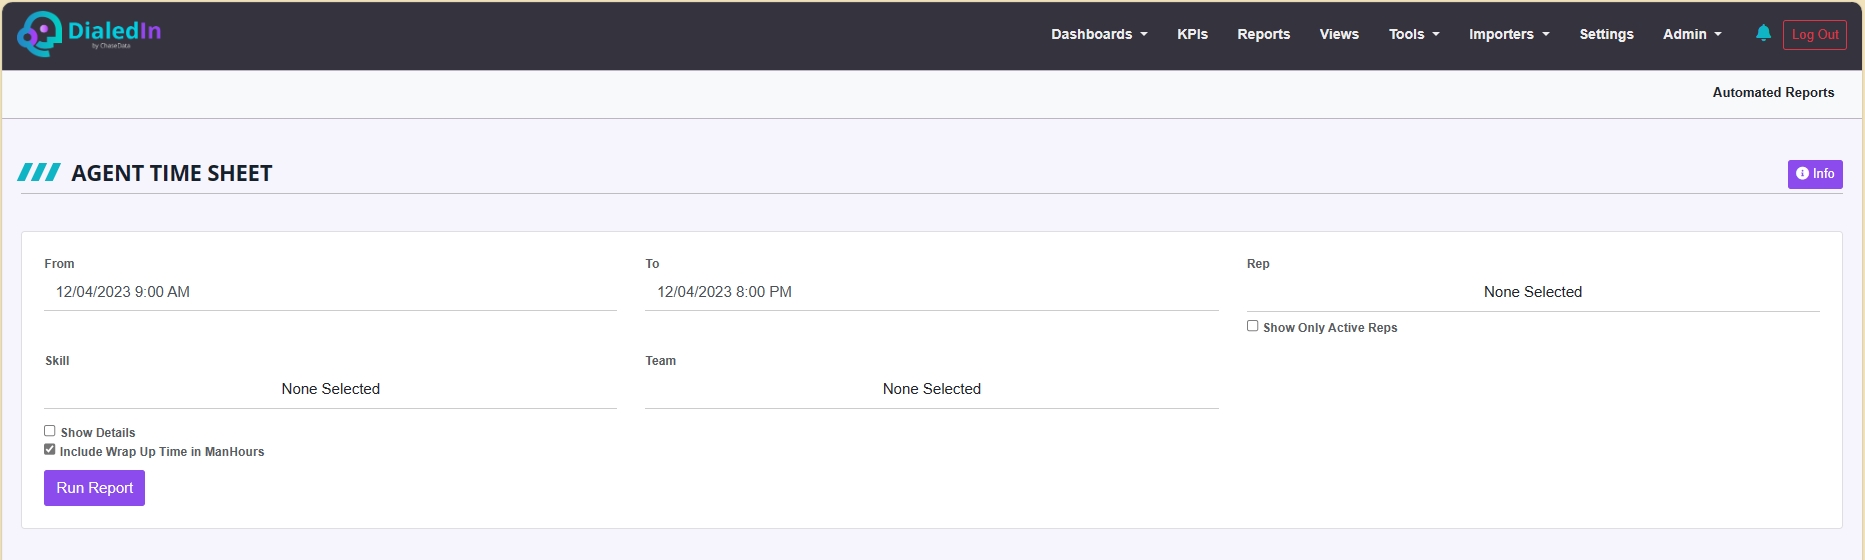
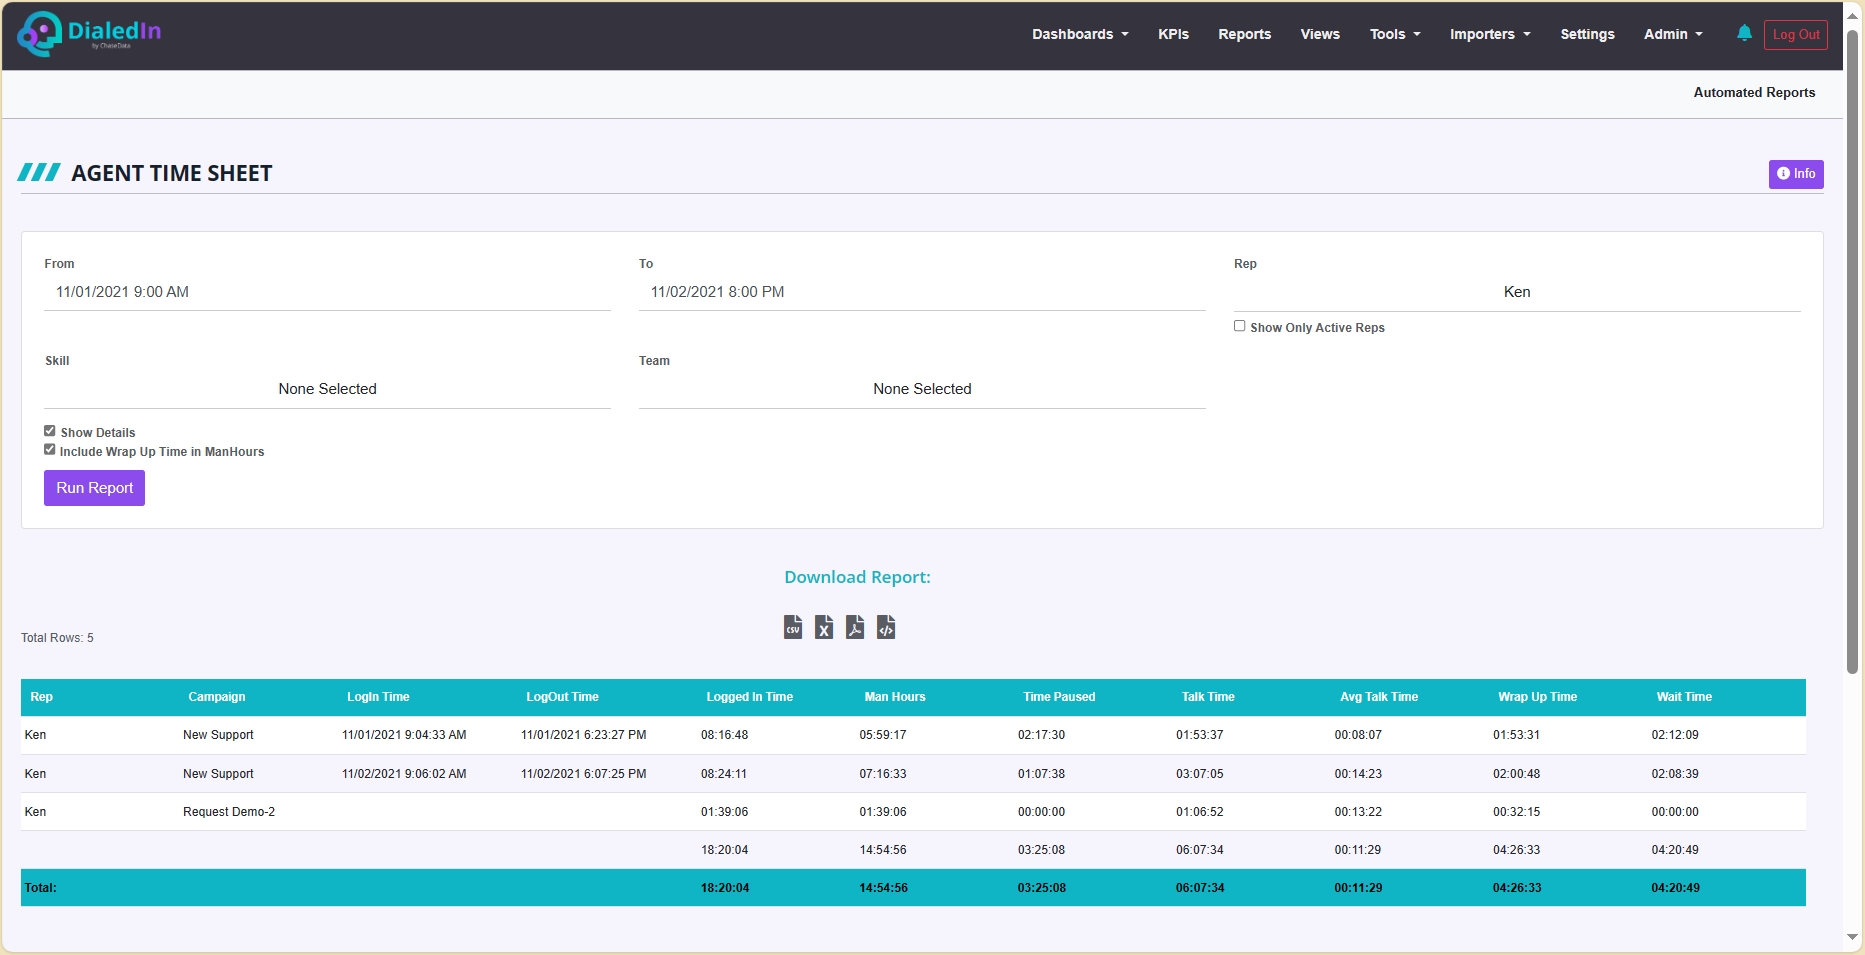
Agent Time Sheet
This report lists all the login sessions for a Rep, along with the total Man Hours and Logged in Time.
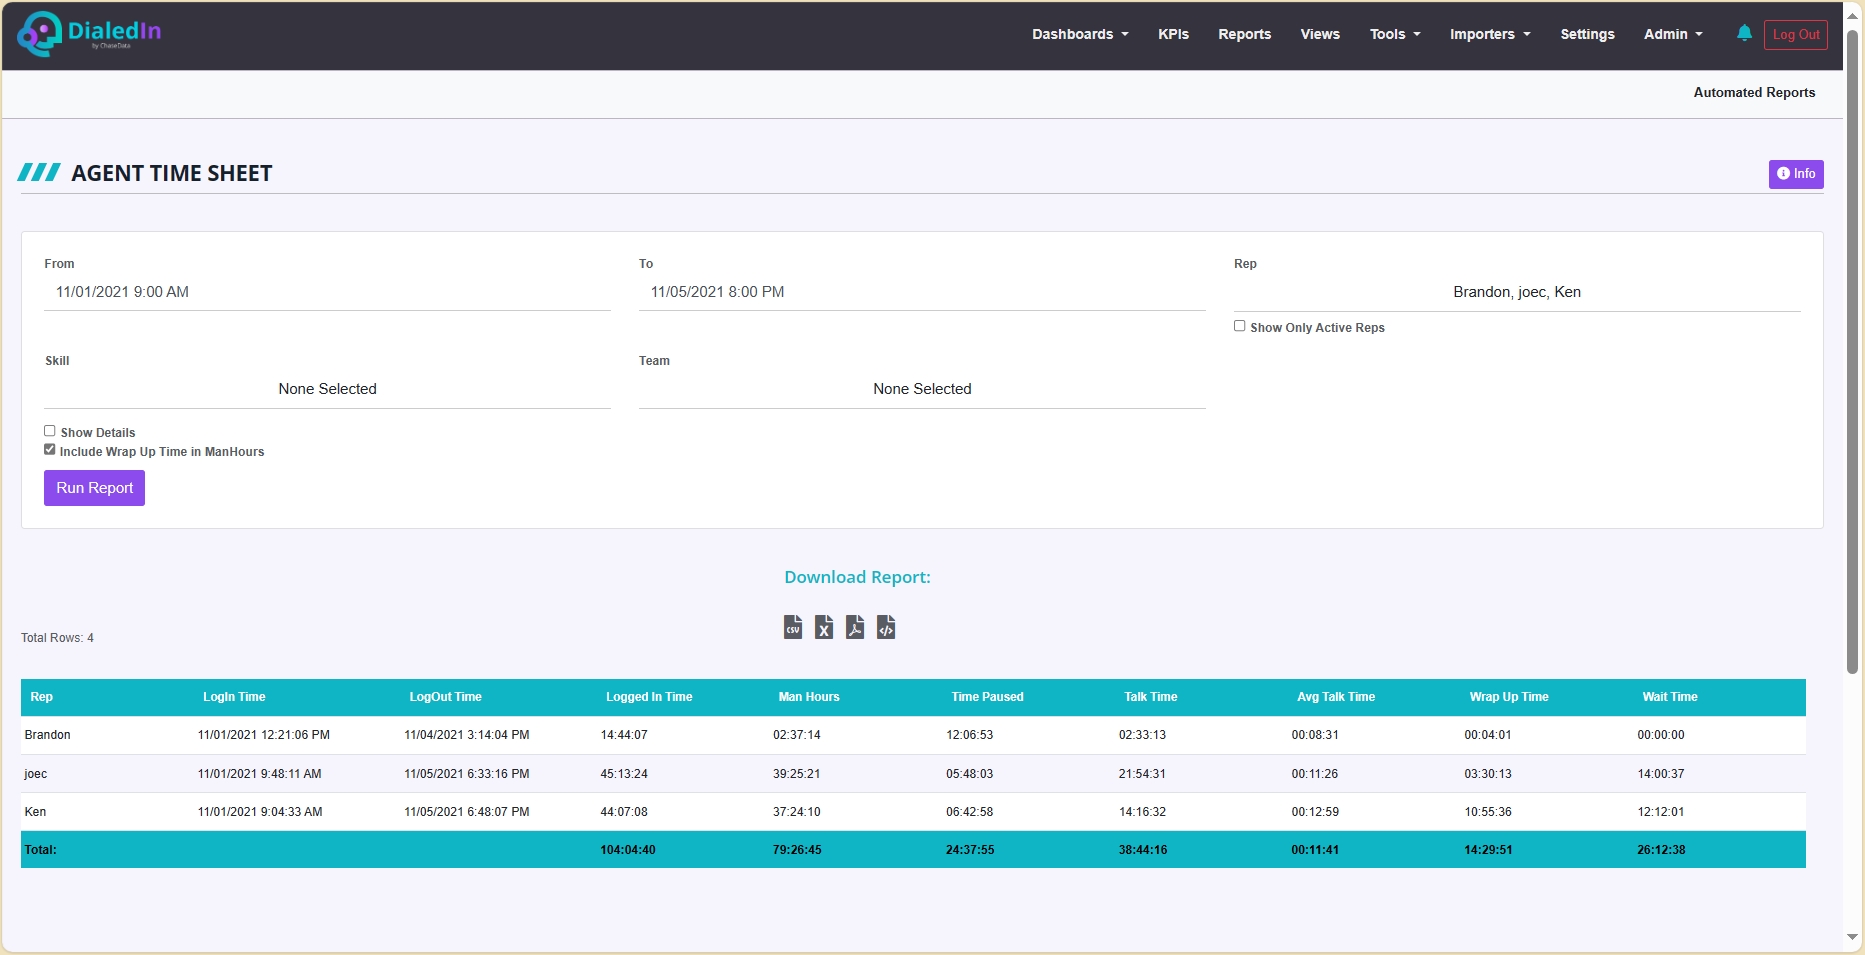
The table results include the following columns:
Rep |
Agent login name |
|---|---|
Campaign |
Dialing Campaign |
LogIn Time |
Time the Agent Logged In |
LogOut Time |
Time the Agent Logged Out |
Logged In Time |
Total Time Logged In |
Man Hours |
Total Time Logged In, Not in Pause |
Time Paused |
Total Time Paused |
Talk Time |
Total Time Spent on Calls |
Avg Talk Time |
Total time spent on calls divided by the number of calls passed to agents. |
Wrap Up Time |
Total Wrap-up Time. Wrap up time includes after call work and time spent previewing a lead. |
Wait Time |
Total Time Spent Waiting |
Blind Transfer
This report lists every Blind Transfer call record for the parameters specified.
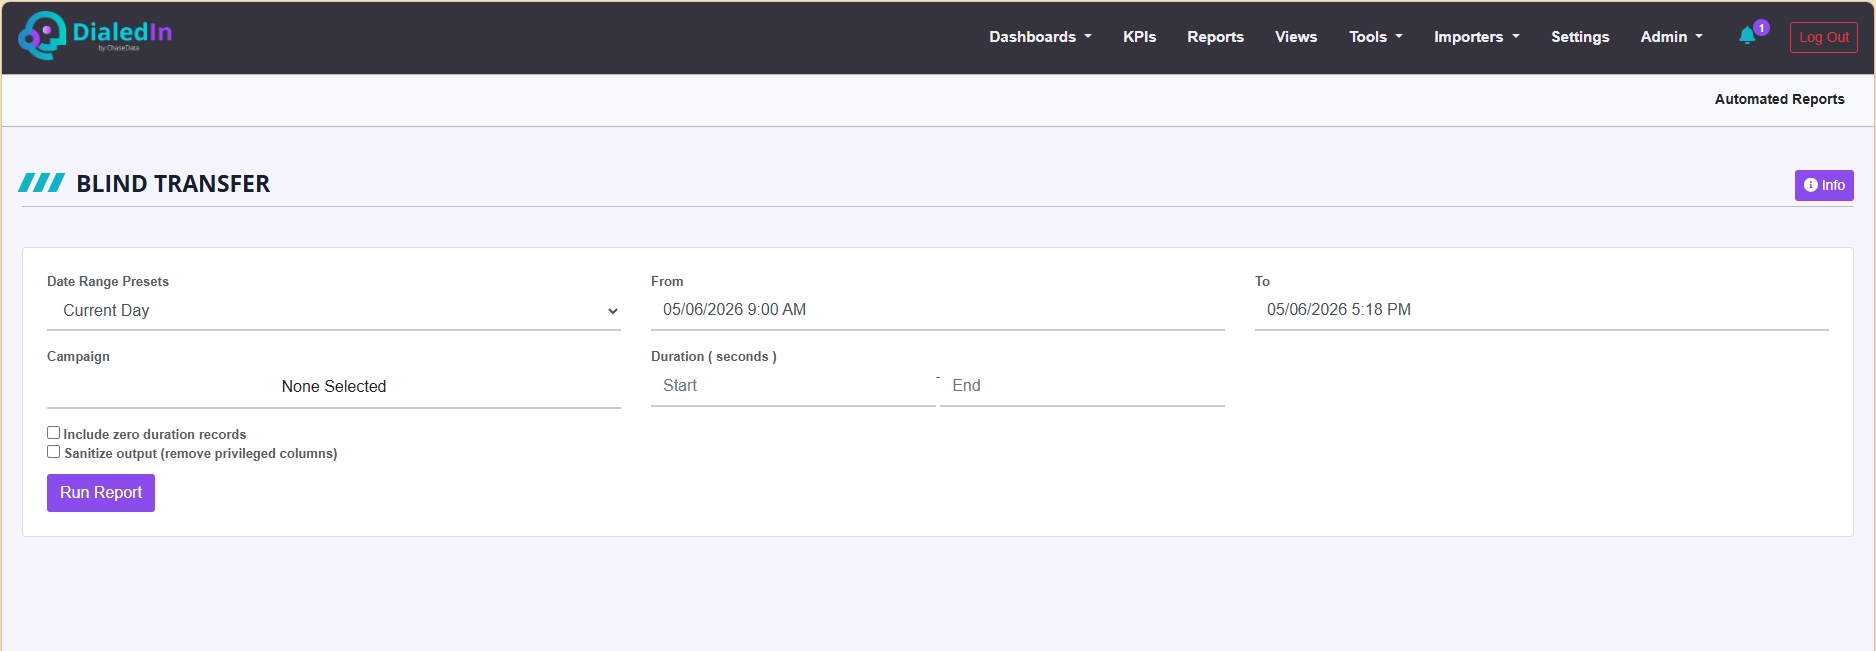
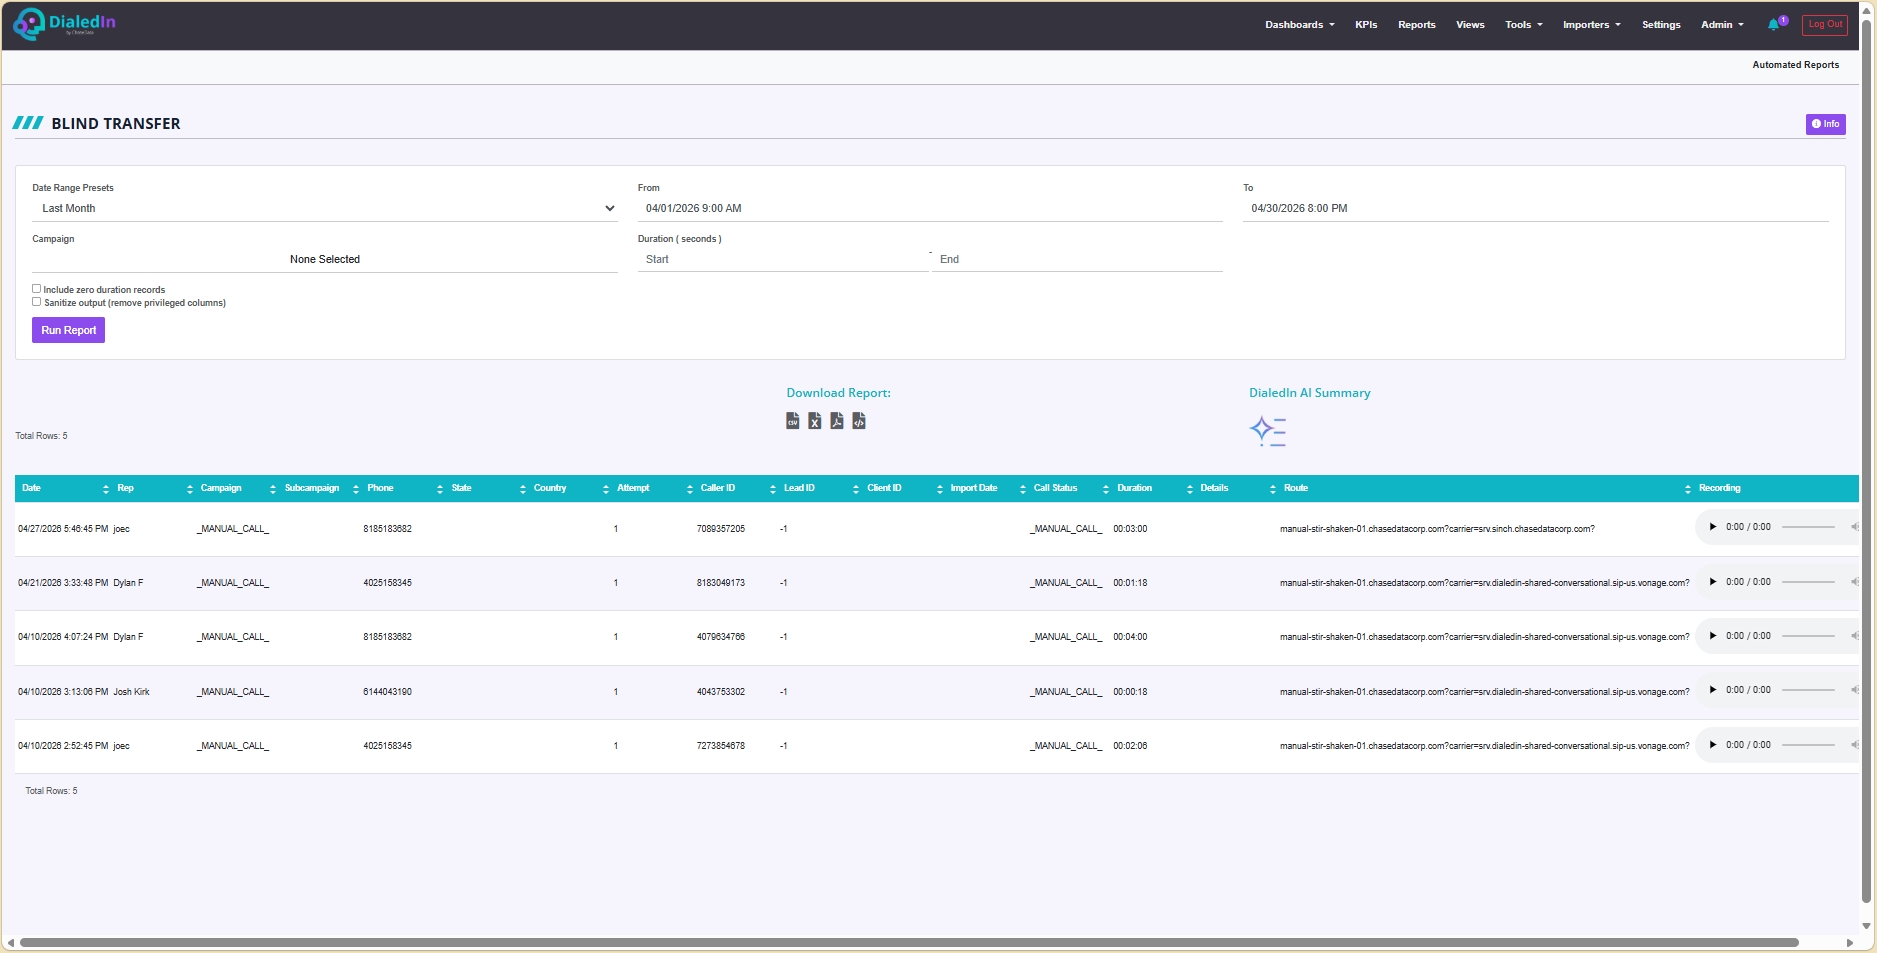
The table results include the following columns:
Date |
The date and time when the event or call took place |
|---|---|
Rep |
The agent's login identifier |
Campaign |
The Campaign involved in the call |
Subcampaign |
The Sub-campaign involved in the call |
Phone |
The number of the lead or contact that was transferred |
State |
The state indicated, if any, in the lead's record for the phone number |
Country |
The country indicated, if any, in the lead's record for the phone number |
Attempt |
The number of call attempts on the phone number |
Caller ID |
The caller ID of the number transferred to |
Lead ID |
The lead ID of the lead's record for the phone number |
Client ID |
The client ID, if any, of the lead's record for the phone number |
Import Date |
The date that the lead was imported into the system, if it was |
Call Status |
The disposition that was applied to the call |
Duration |
The duration of the call or event |
Details |
Any details attached to the event or call record |
Route |
Internal descriptors to diagnose call routing |
Recording |
Access to the voice recording of the call, if available |
Call Details
This report details each dial attempt made for the given parameters. If a custom table is specified, then the lead information fields from that table will also be displayed.
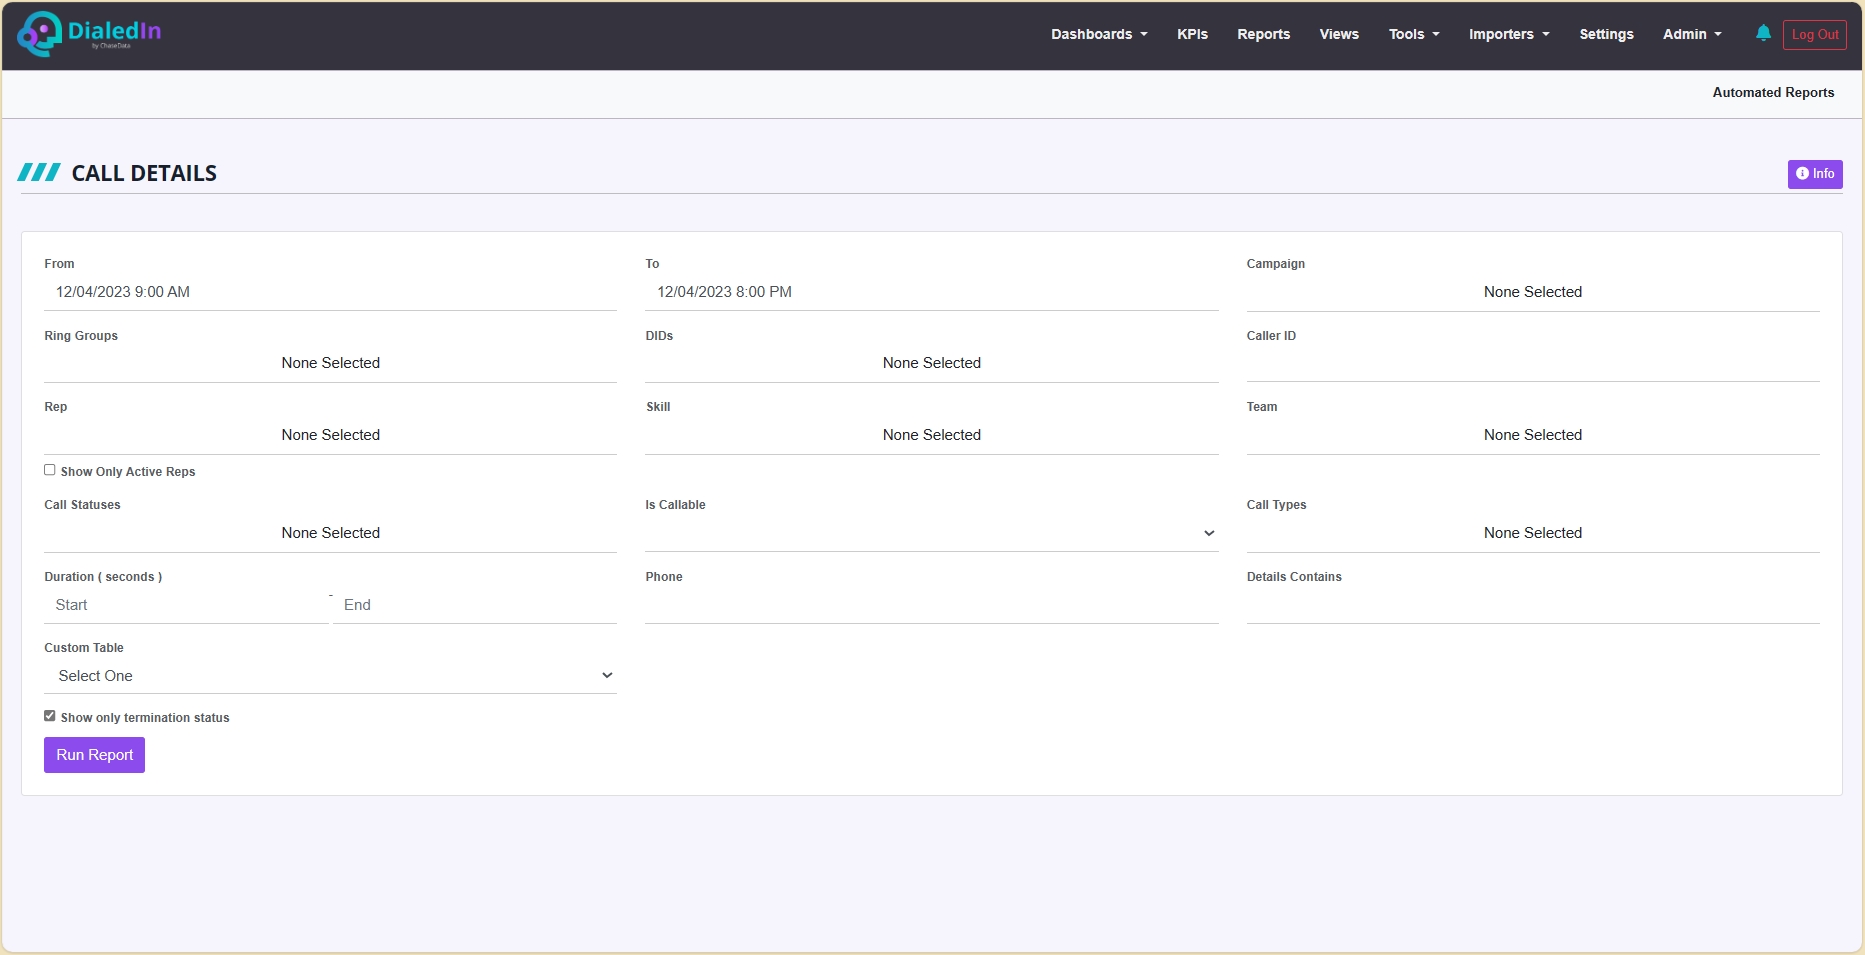
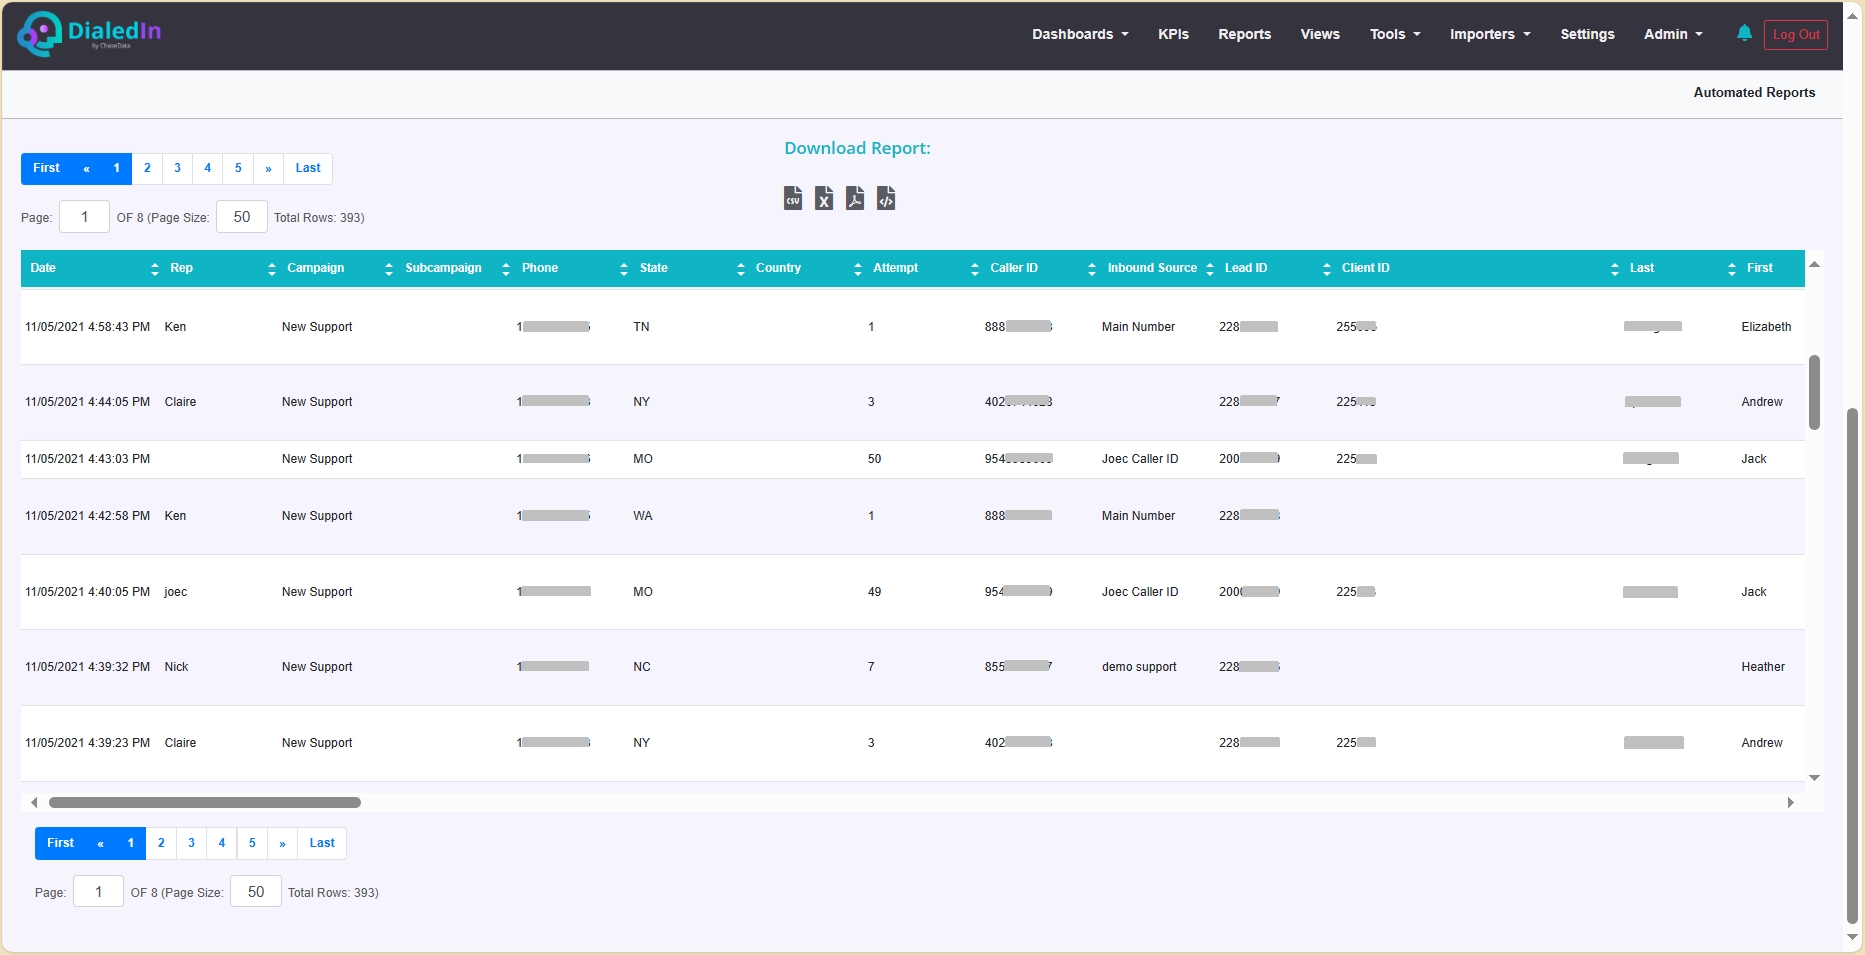
The table results include the following columns:
Date |
Date of Event or Call |
|---|---|
Rep |
Agent login name |
Campaign |
Dialing Campaign |
Subcampaign |
Dialing Sub-Campaign |
Phone |
Phone Number |
State |
State Dialed |
Country |
Country Dialed |
Attempt |
Dialing Attempt Number |
Caller ID |
Caller ID for the dialing campaign/sub-campaign |
Inbound Source |
Caller ID and Description |
Lead ID |
Called party Lead ID |
Client ID |
Called party Client ID |
Last |
Lead Last Name |
First |
Lead First Name |
Import Date |
Date Lead Was Imported |
Call Status |
Disposition of Call |
Is Callable |
Disposition 'Is Callable' |
Duration |
Duration of Event or Call |
Call Type |
Type of Call |
Details |
Details Attached to Event or Call |
Hangup |
Indicates if the Agent hung up on the call |
HoldTime |
The amount of time that the call is on hold |
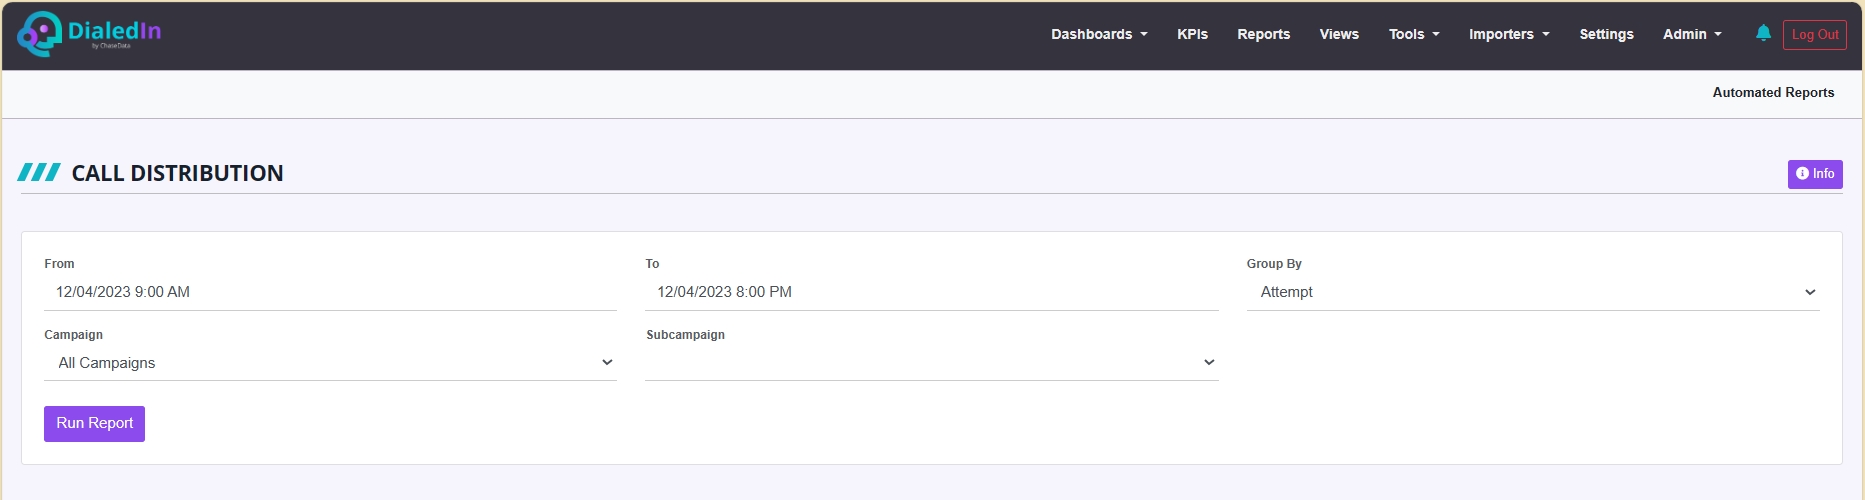
Call Distribution
This report shows the distribution of call attempts based on the call attempt instance for the corresponding lead. It can be grouped by call attempt or by the age of the lead.
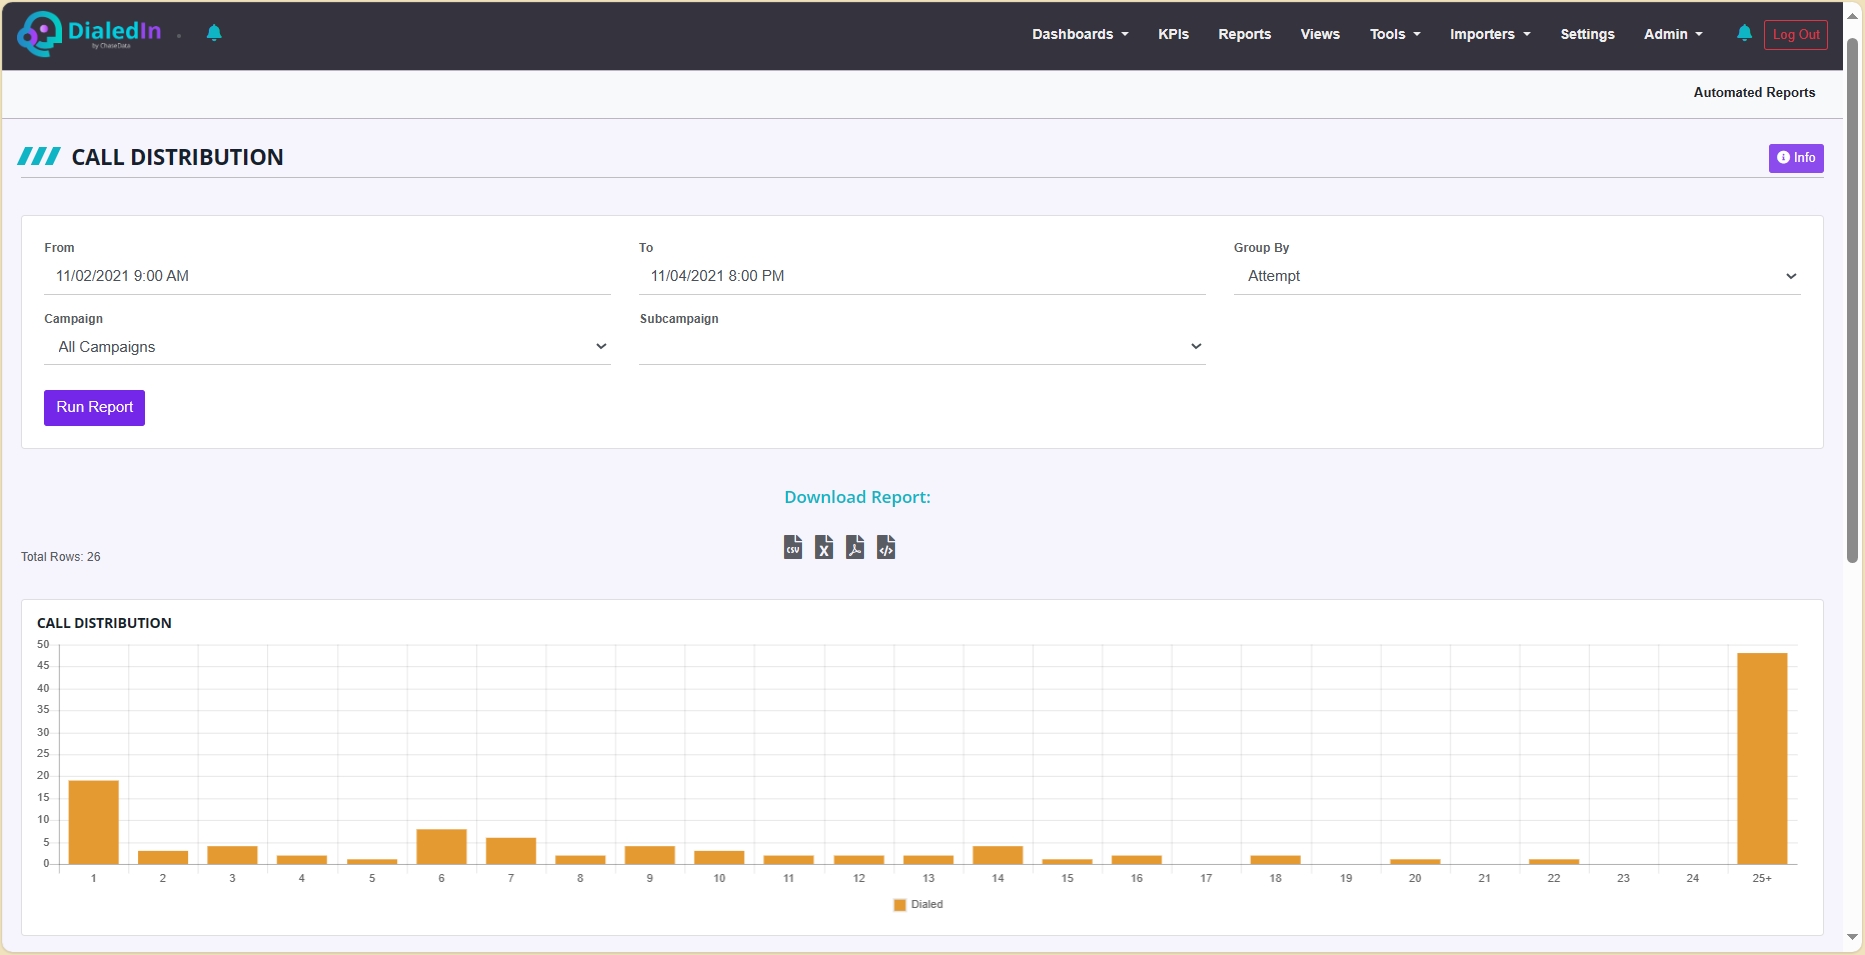
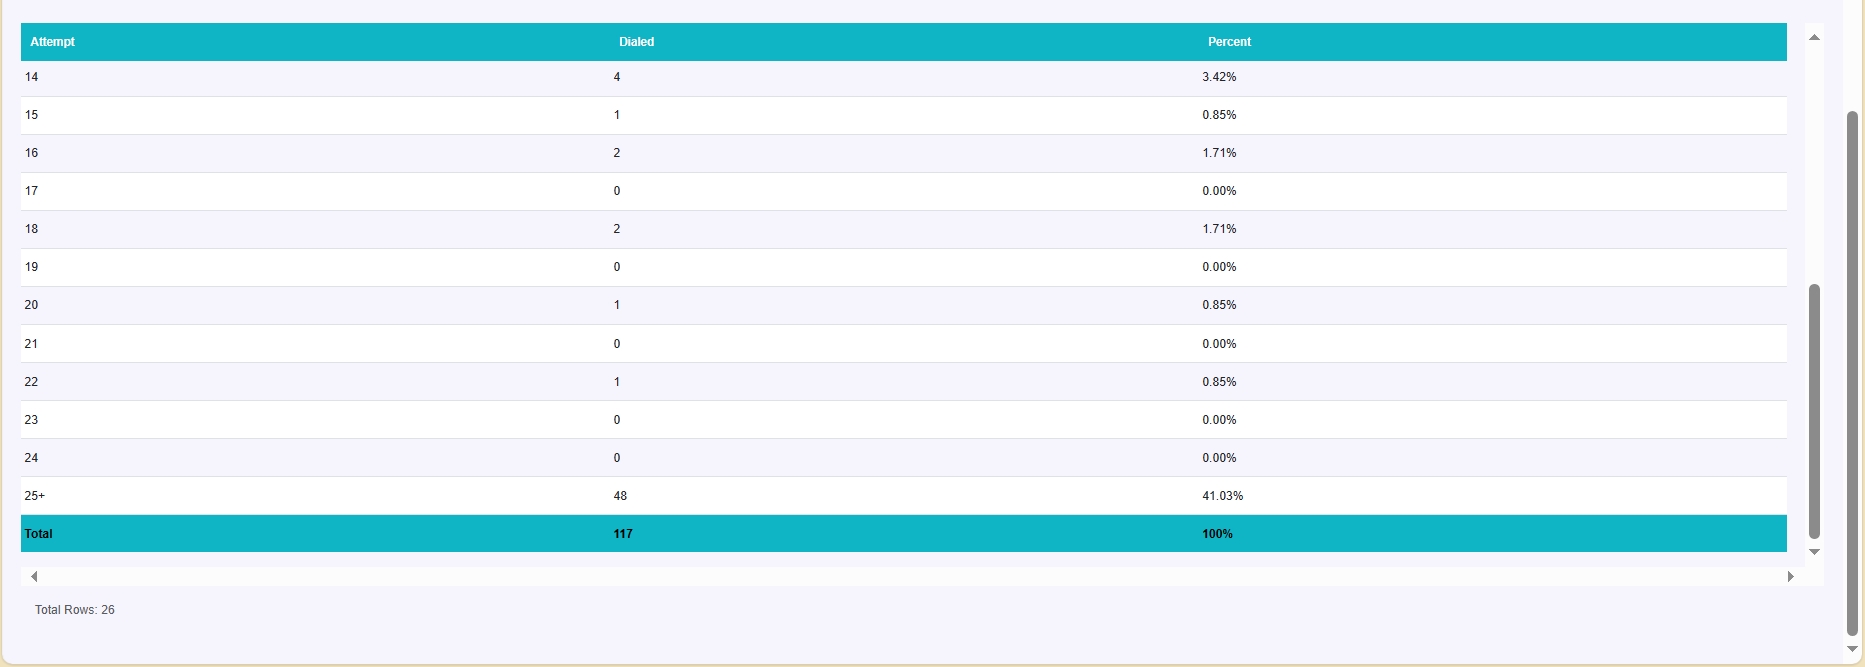
The table results include the following columns:
Attempt |
Dialing Attempt Number |
|---|---|
Dialed |
Total Dial Attempts |
Percent |
Percentage |
Call Distribution NOANS
This is an internal report for use by DialedIn Support only
Caller ID Swap Summary
This is an internal report for use by DialedIn Support only
Caller ID Swaps
This report lists all Caller IDs that have been replaced because they were flagged as spam. The number of calls and connect percentage looks back at the previous 30 days. Connects are calls that went through, which is not necessarily the same as what you may have configured as a "connect".
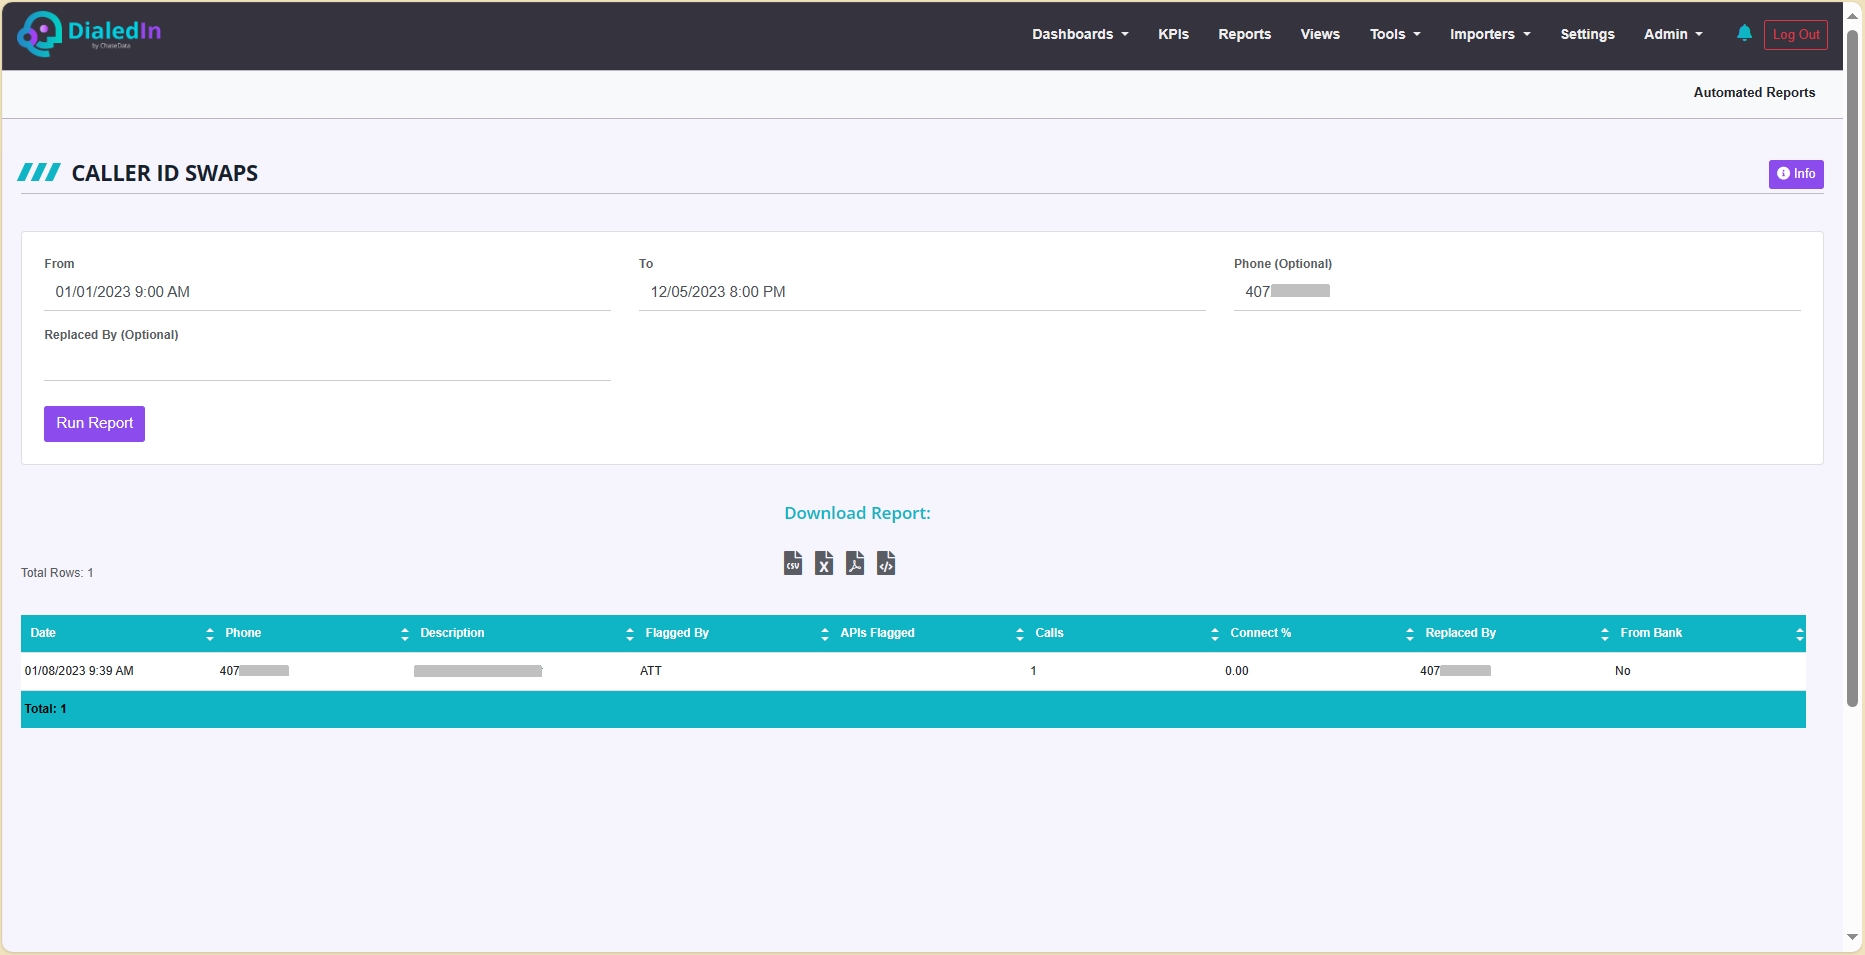
The table results include the following columns:
Date |
Date of Event or Call |
|---|---|
Phone |
Phone Number |
Description |
Ring Group Description |
Flagged By |
Entity or entities that flagged the number |
APIs Flagged |
|
Calls |
Number of Calls |
Connect % |
Percentage of Calls Connected |
Replaced By |
The Caller ID that replaced the original |
From Bank |
Whether replacement number was taken from banked numbers |
Caller ID Swap Graph
This is an internal report for use by DialedIn Support only
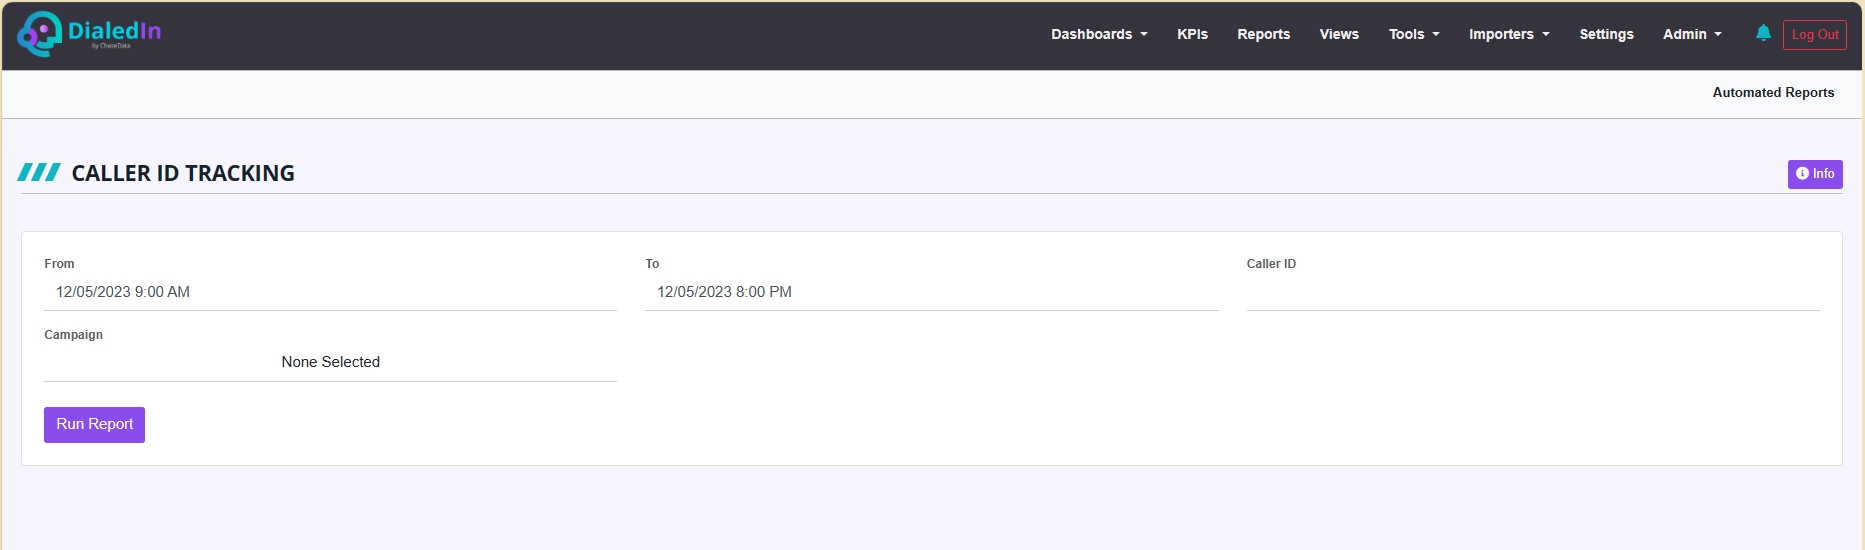
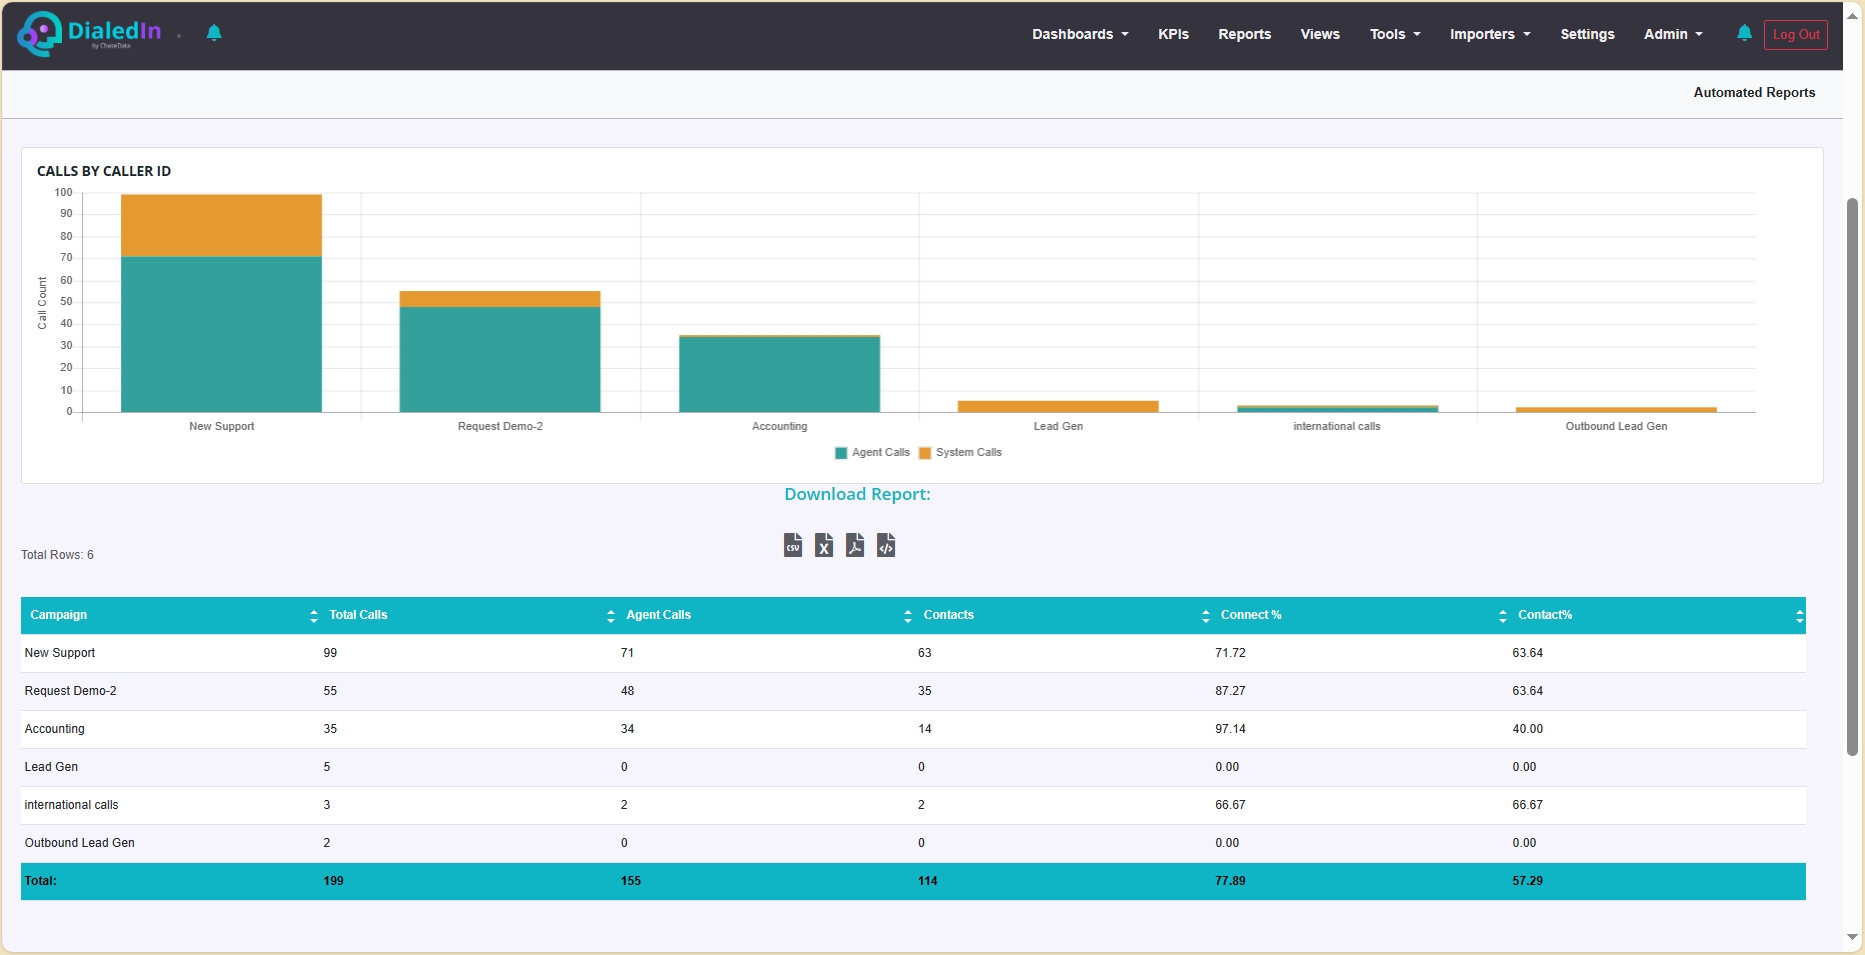
Caller ID Tracking
This report summarizes outbound calls by the Caller ID used. Note that the graphic chart will not be included when the report is exported.
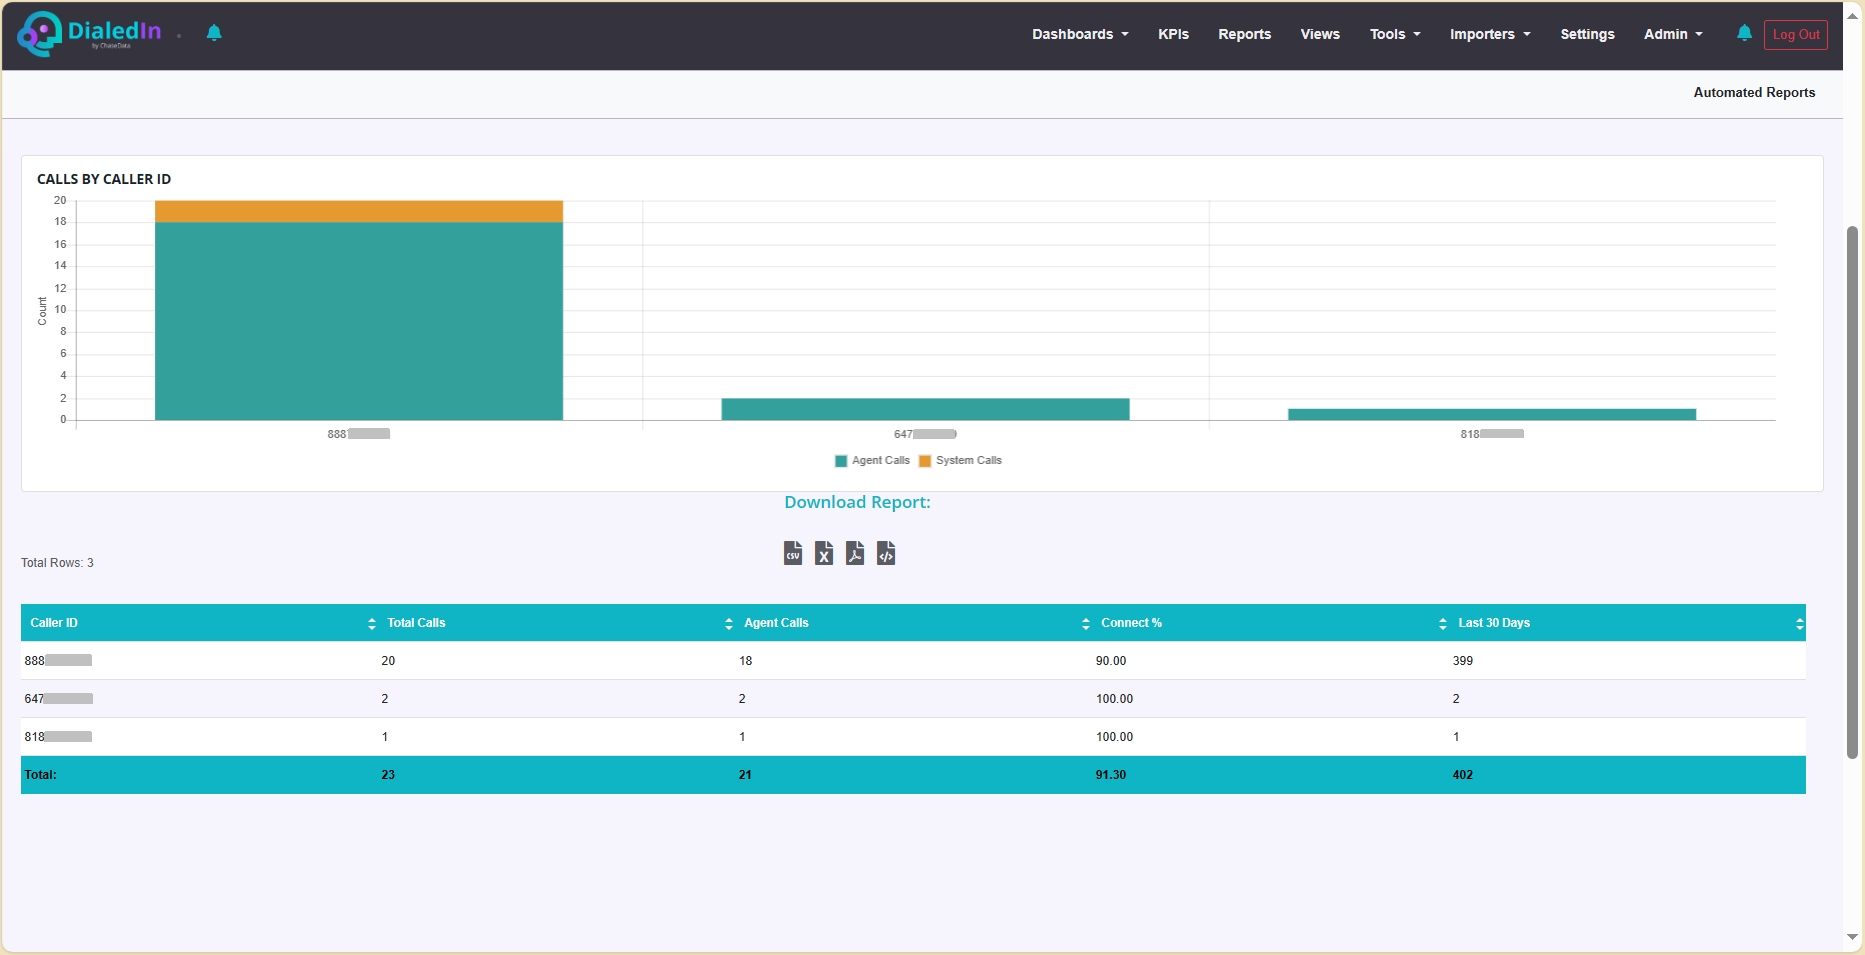
The table results include the following columns:
Caller ID |
Caller ID used by the dialing campaign |
|---|---|
Total Calls |
Total Dials Made |
Agent Calls |
Number of Calls Dispositioned by an Agent |
Connect % |
Percentage of Calls Connected |
Last 30 Days |
Number of times this Caller ID has been used in the last 30 days |
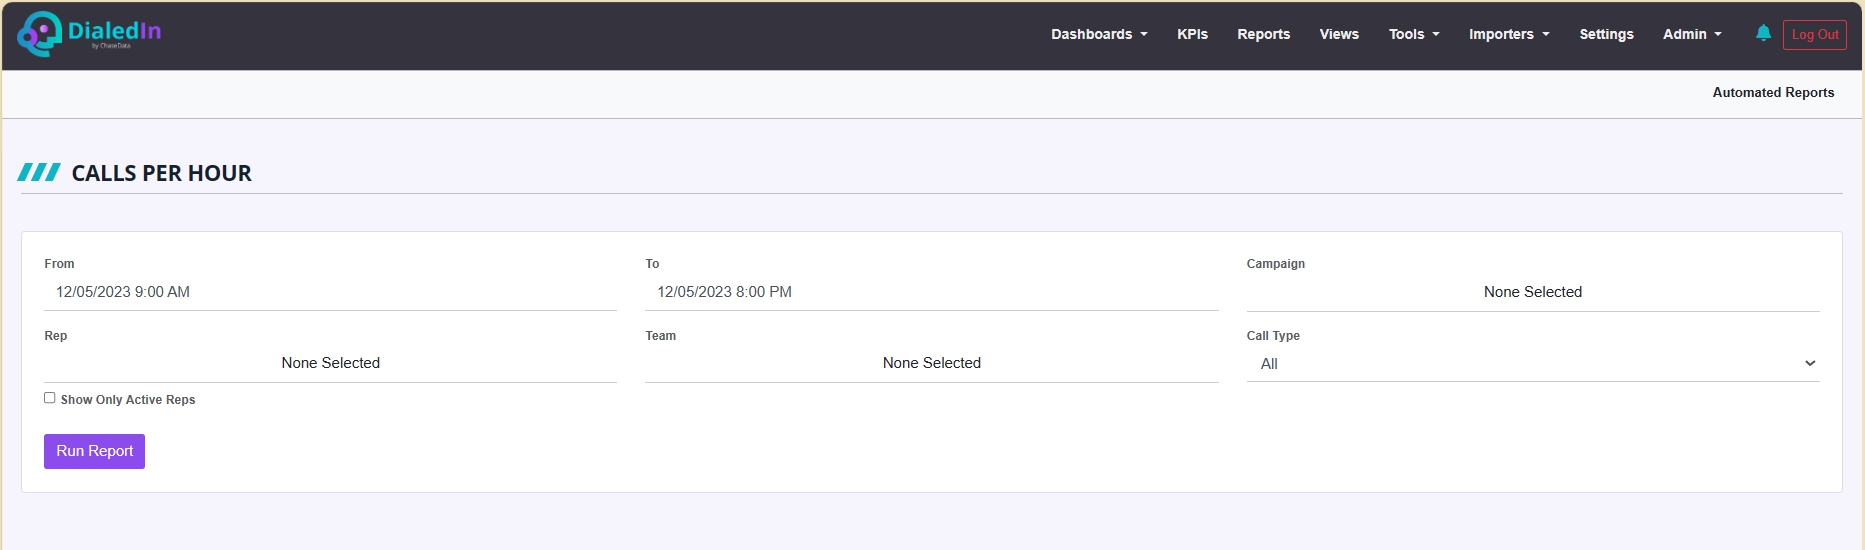
Calls Per Hour
The purpose of this report is to show how call volume fluctuates over each hour of the day.
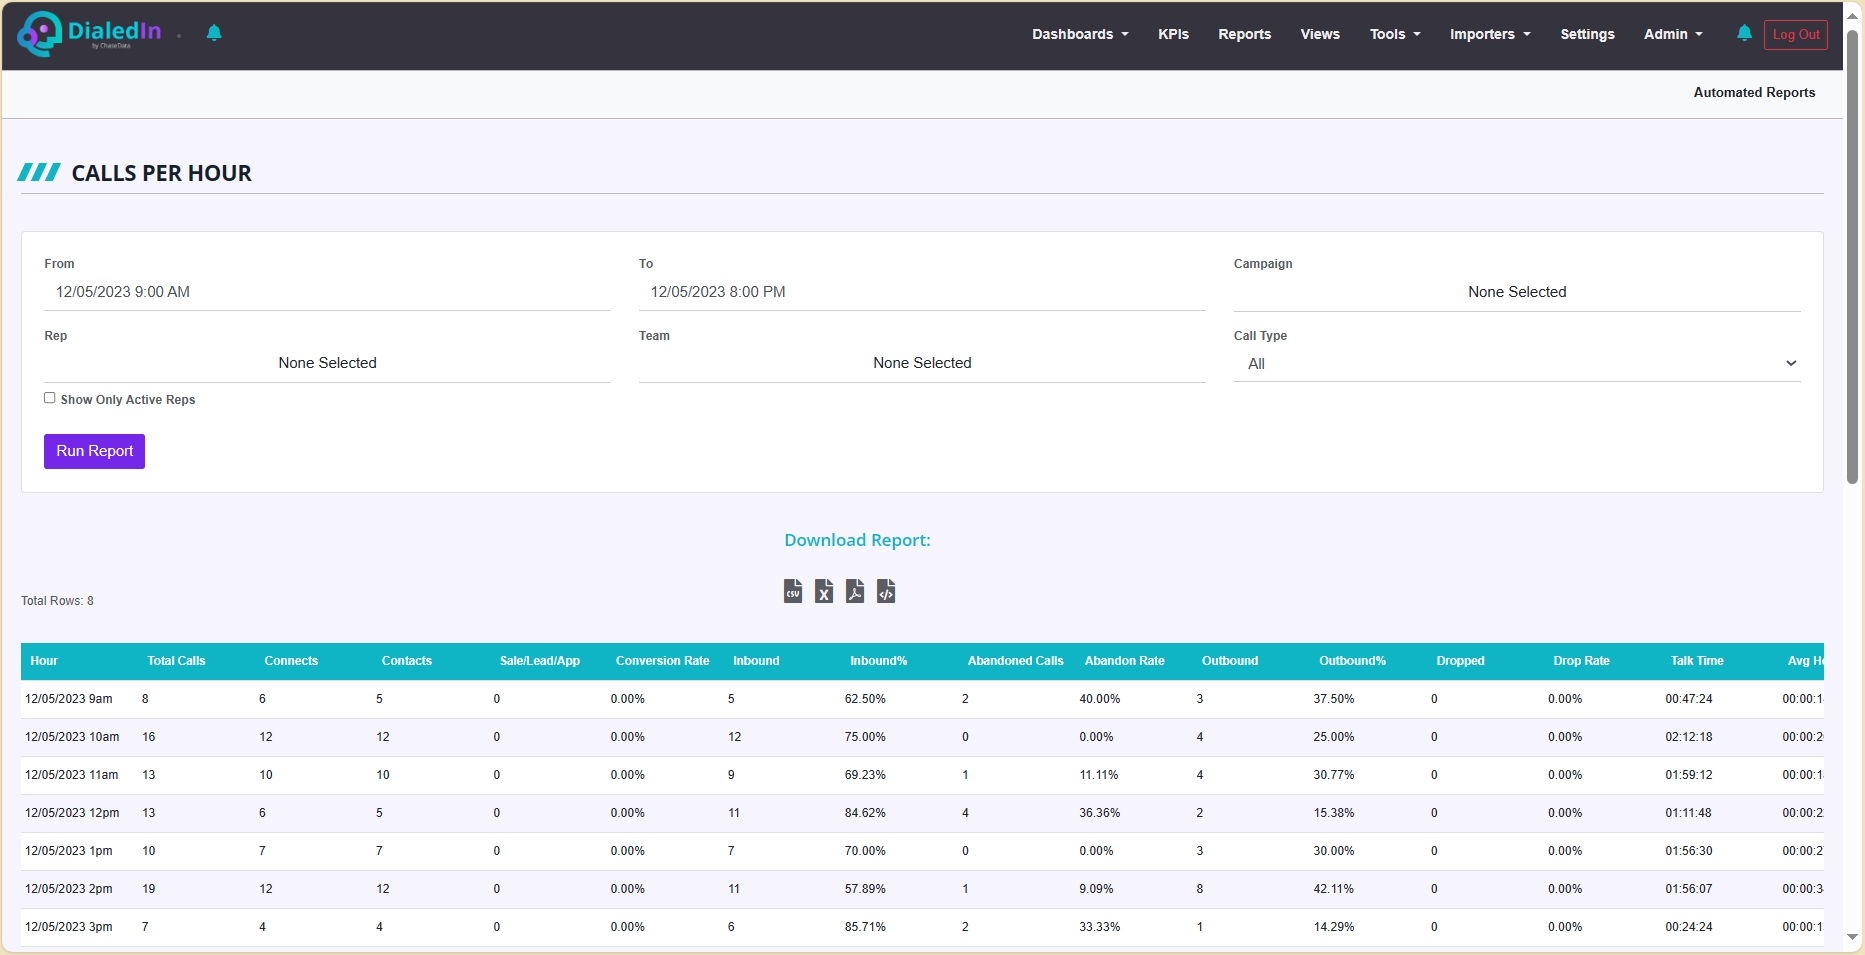
The table results include the following columns:
Hour |
The hour of the day for the call counts |
|---|---|
Total Calls |
Total number of calls |
Connects |
Number of calls that resulted in a connect, i.e., a call attempt that was successful reaching a person or answering machine |
Contacts |
Number of calls that resulted in a contact, i.e., a call attempt that was Connected and, in addition, the person answering was identified as the right contact |
Sales/Lead/App |
Number of calls that resulted in a sale, i.e., a call attempt that was Connected, the person answering was identified as the right Contact, and a positive action resulted from the call |
Conversion Rate |
The percentage of contact calls that resulted in a sale |
Inbound |
The number of calls that were inbound |
Inbound% |
The percentage of calls that were inbound |
Abandoned Calls |
The number of inbound calls that were abandoned by caller |
Abandoned Rate |
The percentage of inbound calls that were abandoned by caller |
Outbound |
The number of calls that were outbound |
Outbound% |
The percentage of calls that were outbound |
Dropped |
The number of outbound calls that were dropped by called party |
Dropped Rate |
The percentage of outbound calls that were dropped by called party |
Talk Time |
The aggregated amount of time talking during all calls |
Avg Hold Time |
The average amount of time that calls are parked, or put on hold |
Avg Wait Time |
The average amount of time that an inbound caller waits to be connected to an agent |
Contact% |
The percentage of calls that result in a ‘Contact’ |
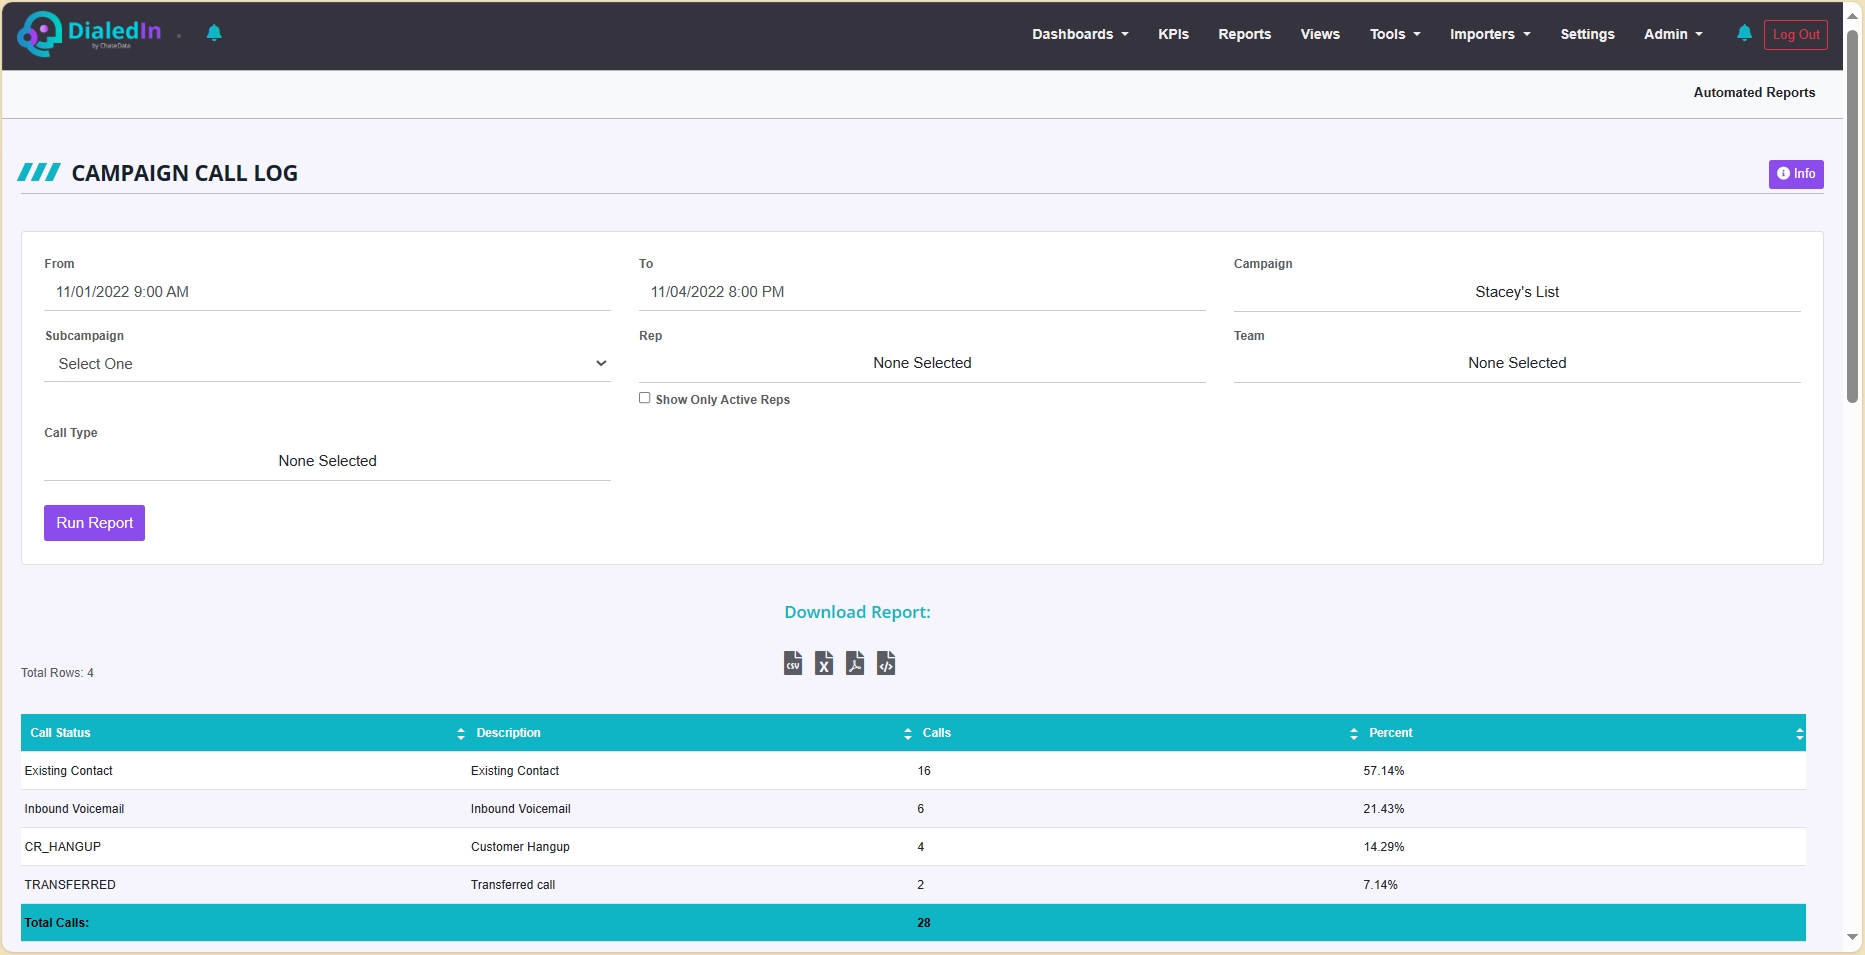
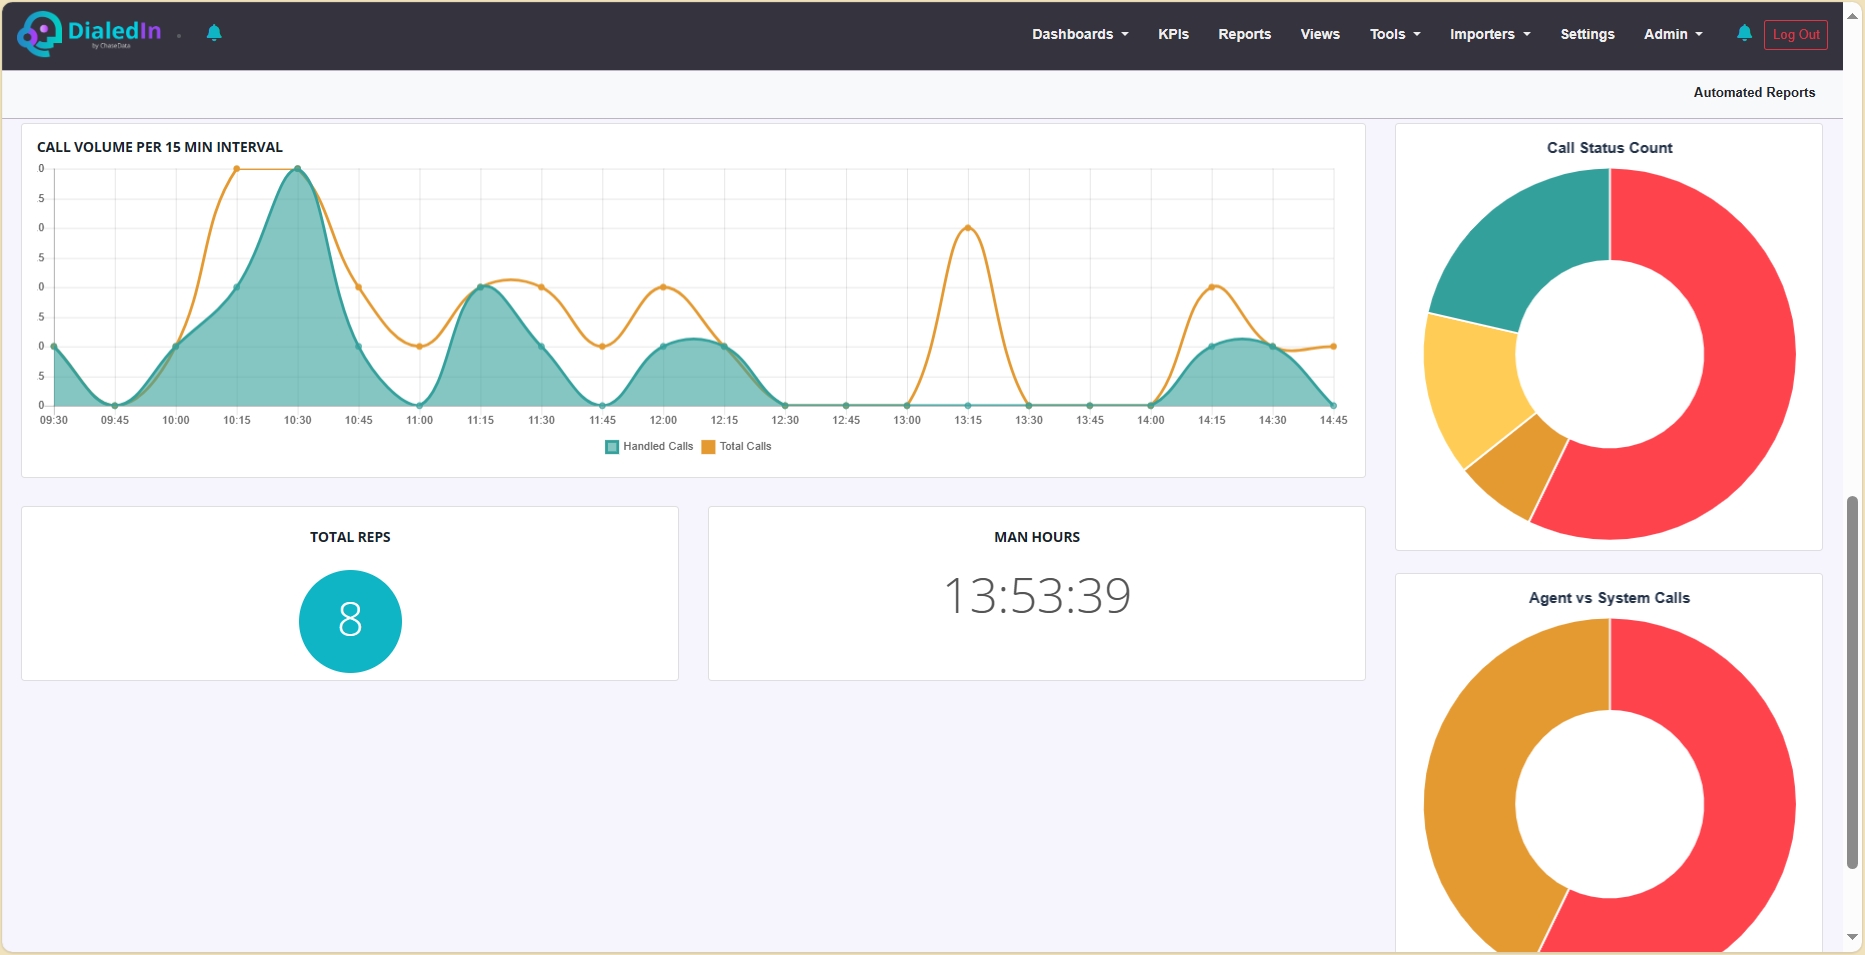
Campaign Call Log
This report summarizes all dials by their disposition. Charts break down the call volume by 15 minute intervals, as well as graphical depictions of agent vs system handled calls and call status distribution.
Note that the charts will not be included when the report is exported.
The table results include the following columns:
Call Status |
Disposition of Call |
|---|---|
Description |
Description of Call Status |
Calls |
Total Count of calls for this disposition |
Percent |
Percentage of calls for this disposition |
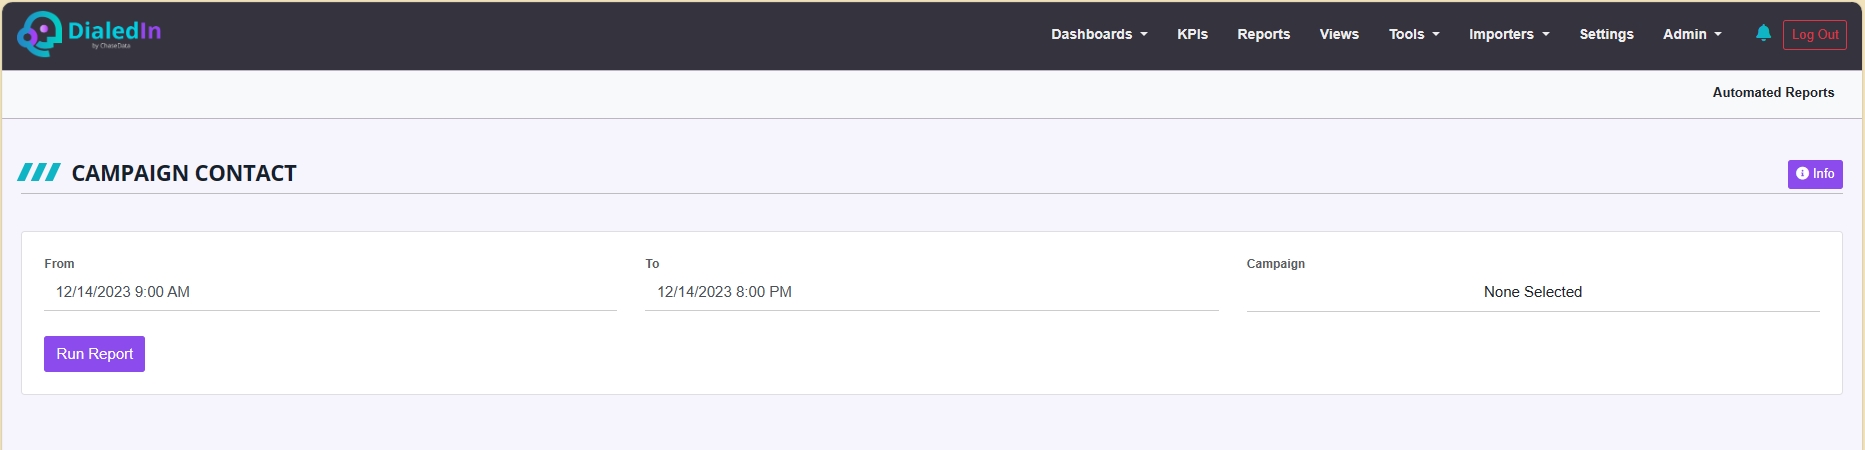
Campaign Contact
This report summarizes outbound calls by Campaign.
Note that the graphic chart will not be included when the report is exported.
The table results include the following columns:
Campaign |
Dialing Campaign |
|---|---|
Total Calls |
Total Dials Made |
Agent Calls |
Number of Calls Dispositioned by an Agent |
Contacts |
Calls where contact was made. This is determined by the disposition type on the wrap up code. |
Connect % |
Percentage of Calls Connected |
Contact% |
Percentage of Calls Contacted |
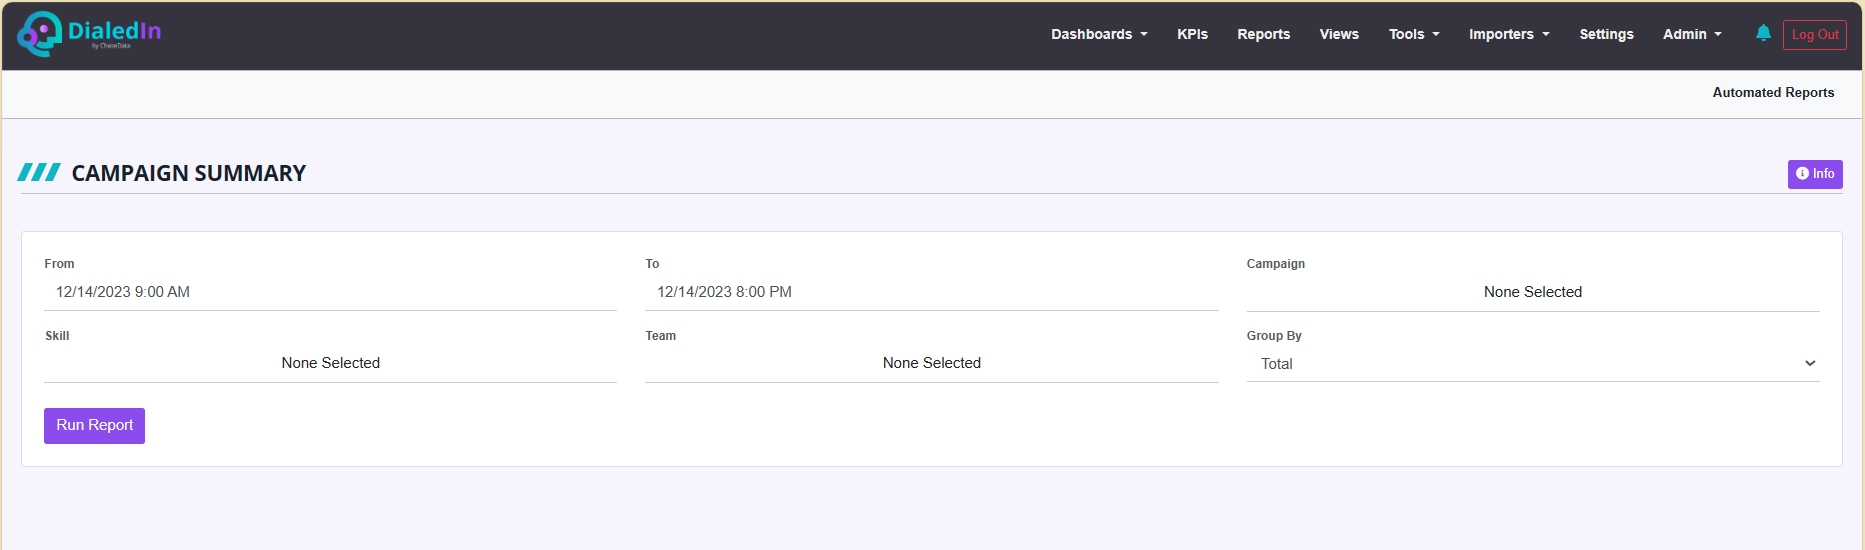
Campaign Summary
This report summarizes campaign activity for the specified date range.
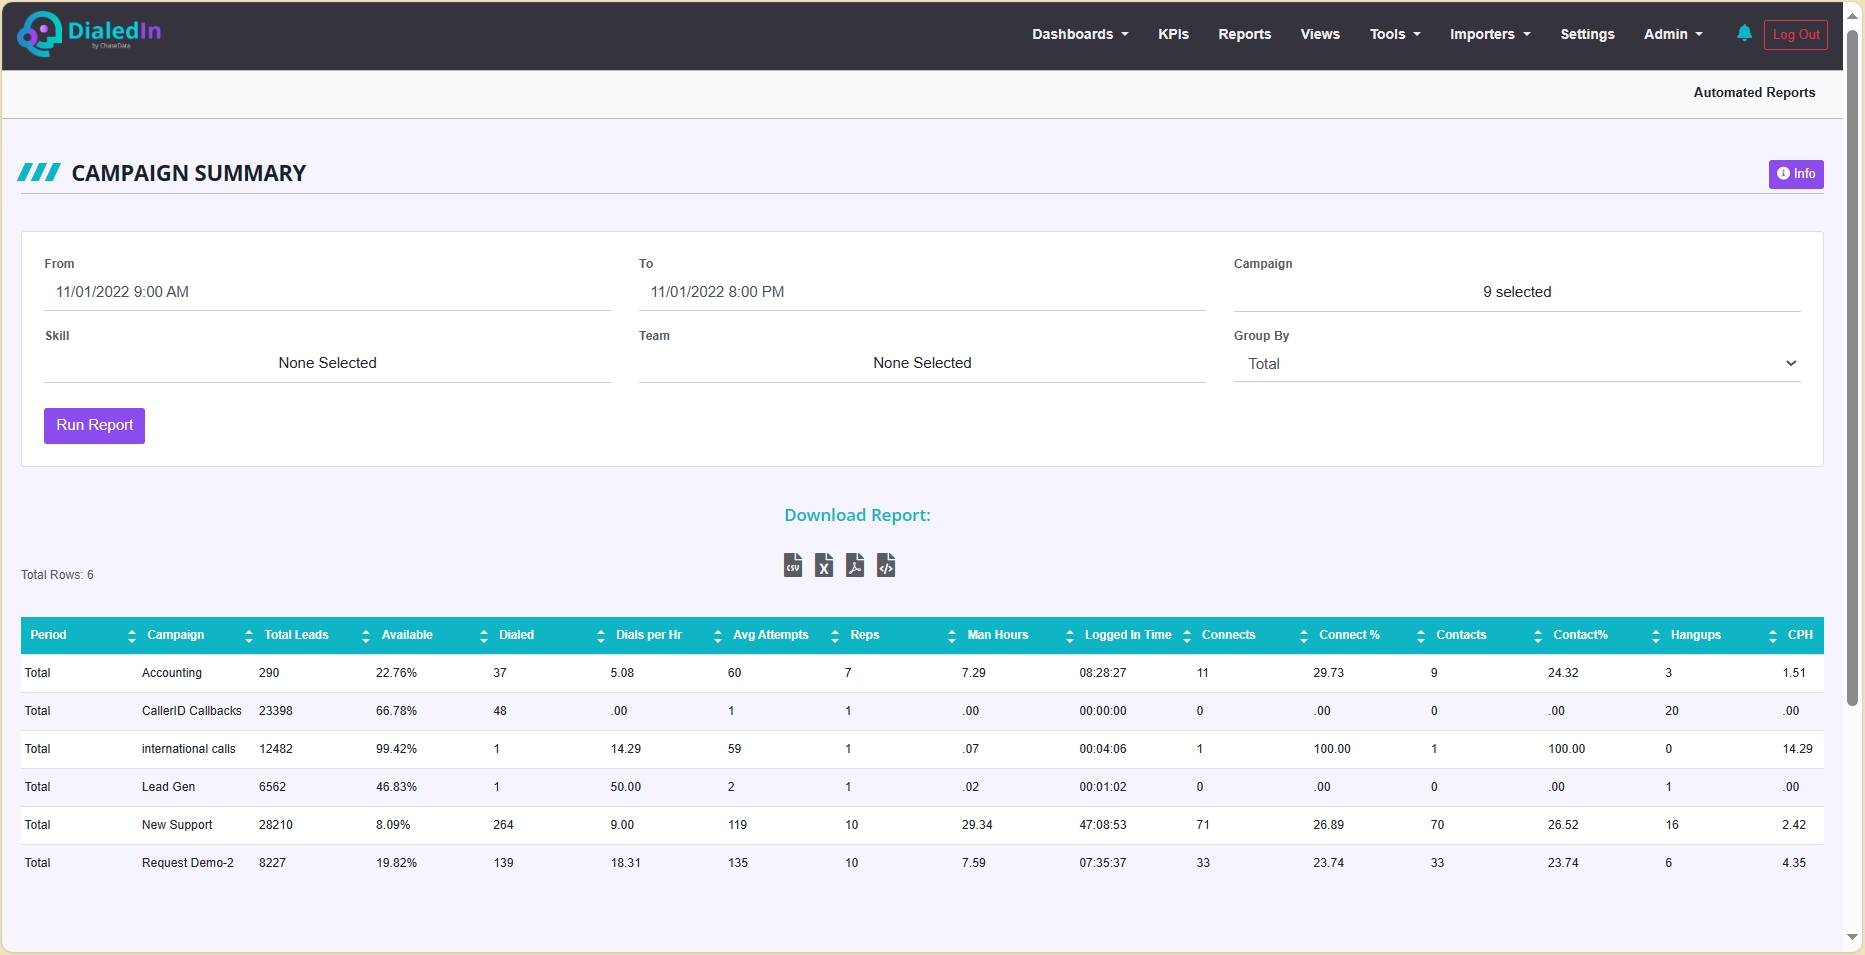
The table results include the following columns:
Period |
Period included in the summary |
|---|---|
Campaign |
Dialing Campaign |
Total Leads |
Total Number of Leads in the campaign |
Available |
Callable Leads |
Dialed |
Total Dial Attempts |
Dials per Hr |
Dial Attempts per Hr |
Avg Attempts |
Average Dial Attempts on Leads in a campaign that has activity within the date range selected |
Reps |
Number of Agents included in the summary |
Man Hours |
This is total logged in time minus the time spent on paused status. |
Logged In Time |
Total Agent Time Logged In |
Connects |
Number of calls that connected. This is determined by the disposition type on the wrap up code. |
Connect % |
Percentage of Calls that resulted in a Connect |
Contacts |
Number of calls where a contact was made. This is determined by the disposition type on the wrap up code. |
Contact% |
Percentage of Calls that resulted in a Contact |
Hangups |
Number of calls that were hung up on |
CPH |
Connects Per Hour - this is the total amount of connects divided by the total hours worked. |
Conversion Rate |
Ratio of Sales/Leads/App disposition divided by total contacts. |
Conversion Factor |
Sales/Leads/App per Contact per hour. |
Sale/Lead/App |
Sales/Leads/App call status. This is determined by the disposition type on the wrap up code. |
S-L-A/HR |
Total Sales/Leads/App dispositions divided by the hours worked. |
NoAns Rate |
Percentage of calls that did not answer |
Norb Rate |
Percentage of calls that do not ring back |
Drop Rate |
Percentage of Connected Calls that were Dropped |
Avg Wait Time |
Total Time Spent Waiting divided by the number of times the agent went into waiting status. |
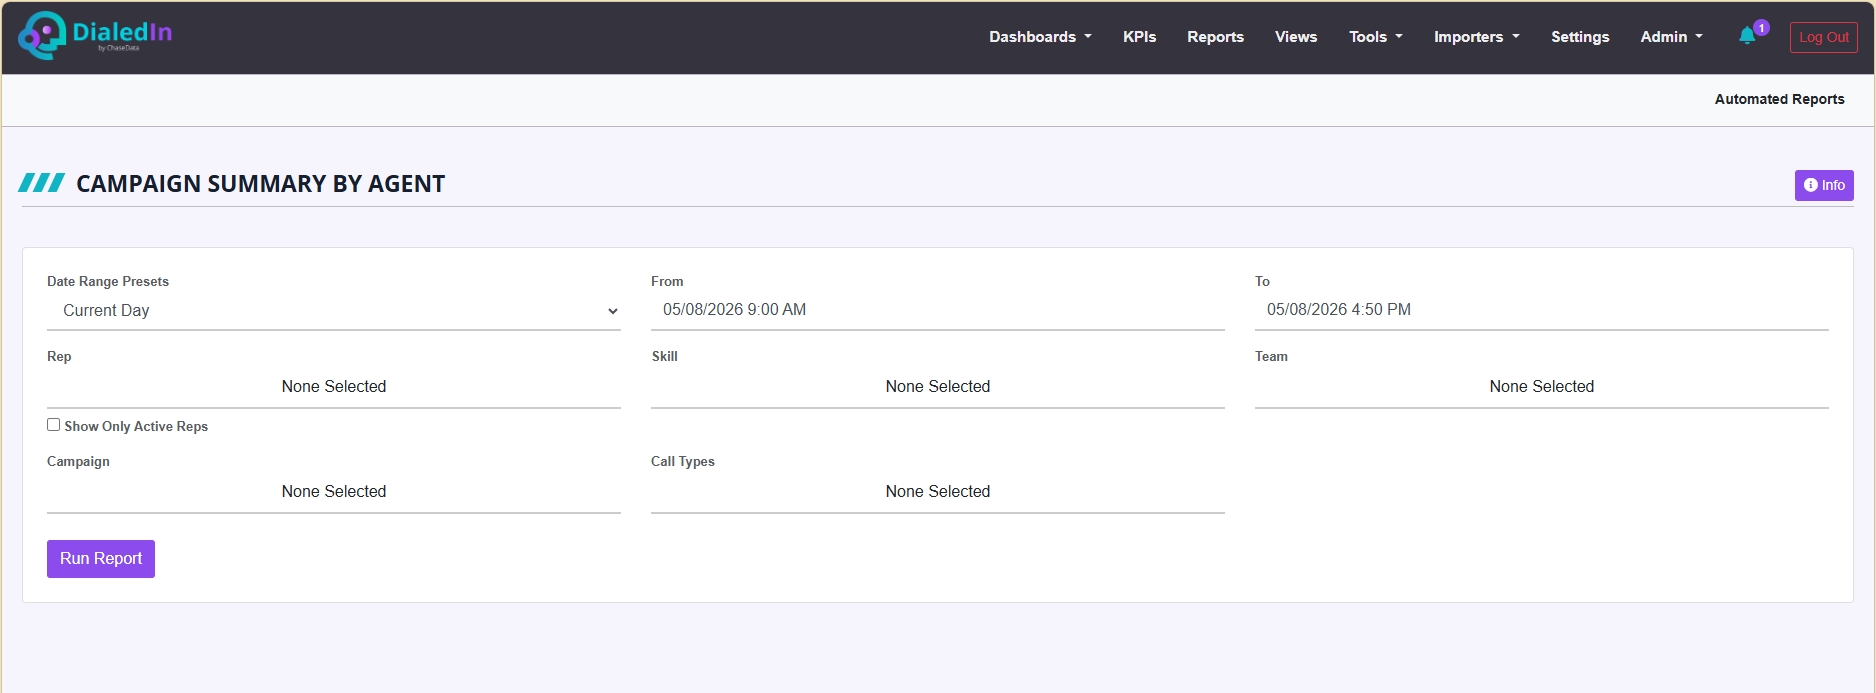
Campaign Summary by Agent
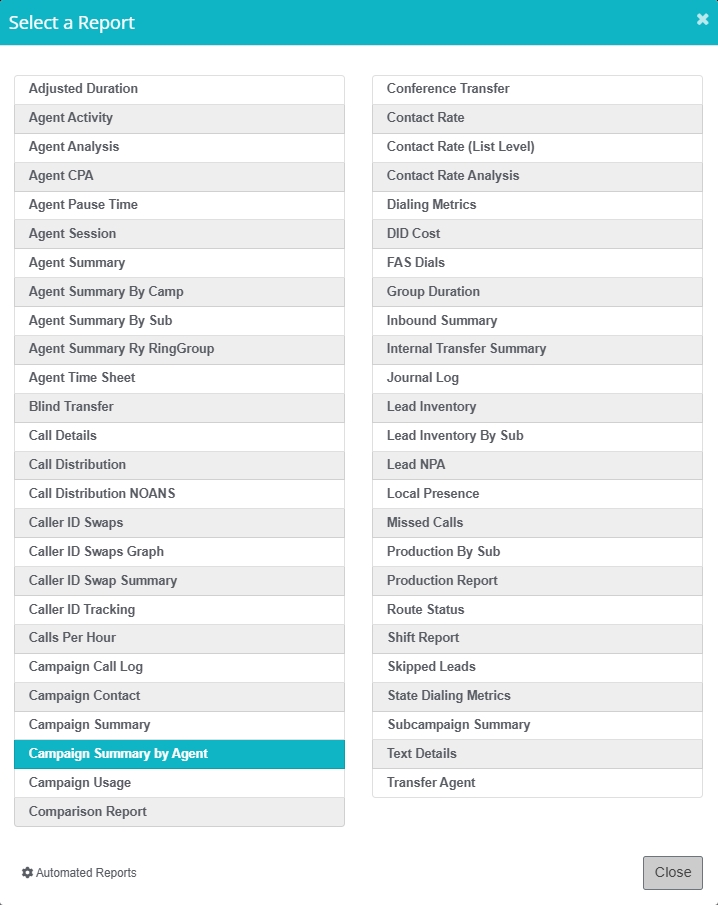
This report summarizes campaign activity for the specified date range, for specific Agents.
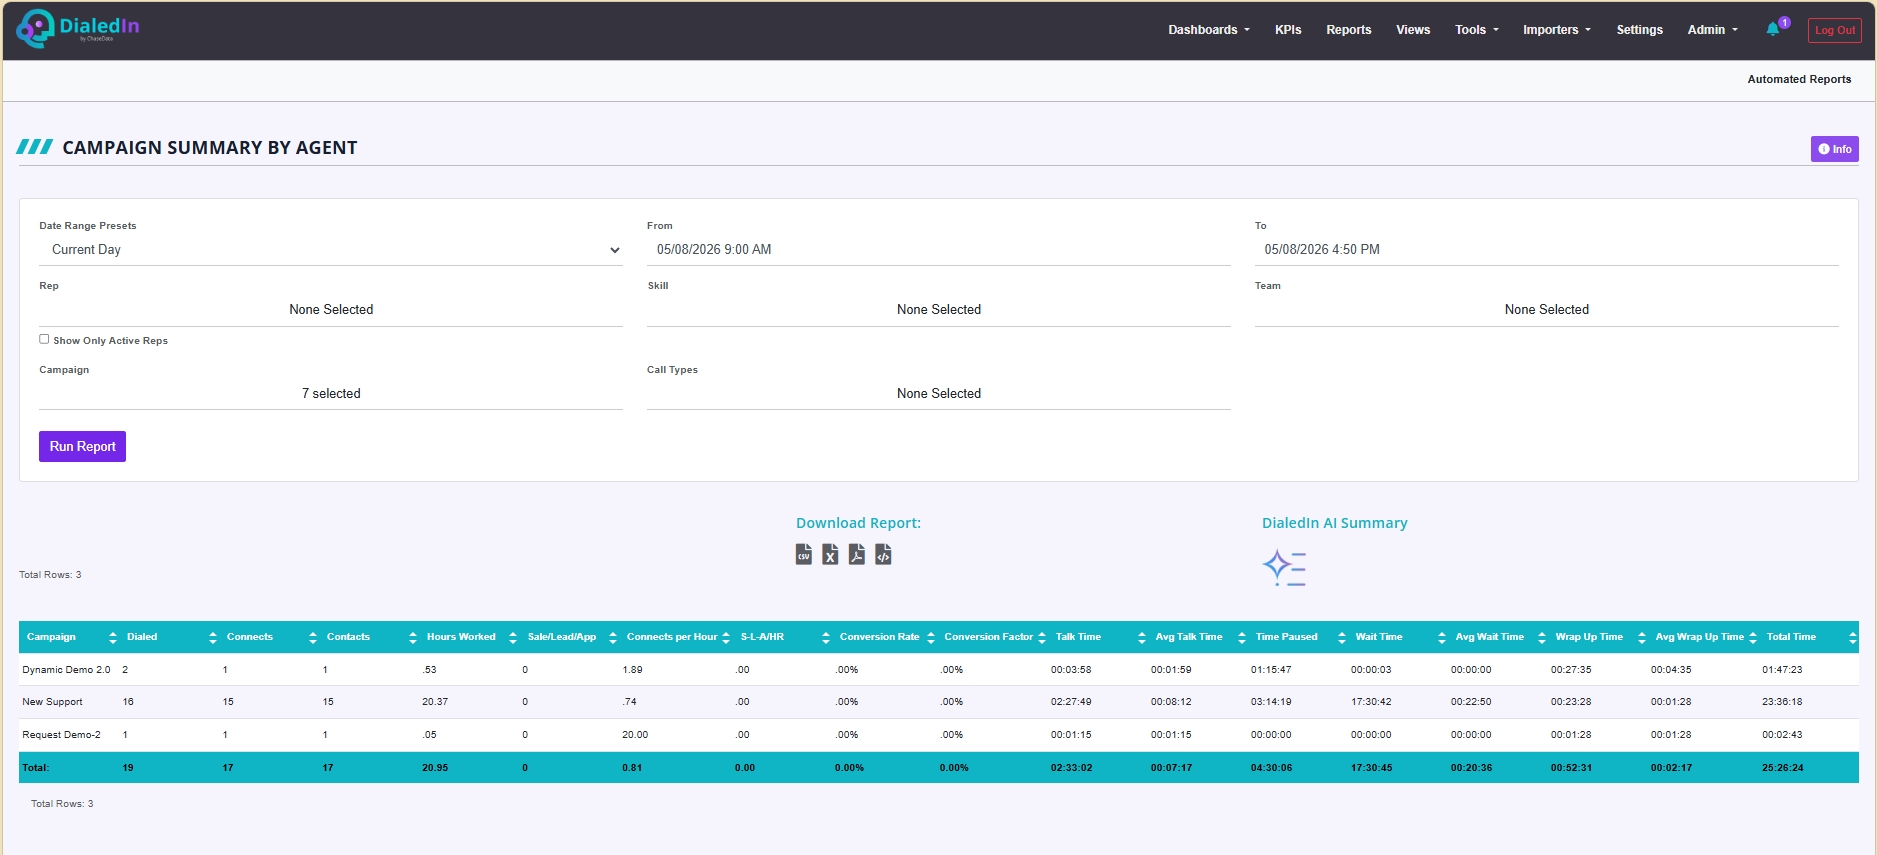
The table results include the following columns:
Campaign |
The campaign for which the summary line is presented |
|---|---|
Dialed |
The number of dial attempts associated with the campaign |
Connects |
Number of calls that connected, as determined by the disposition type on the wrap up code |
Hours Worked |
The agent time resulting from substracting the time spent on paused status to the time that the agent was logged-in |
Sale/Lead/App |
Number of calls that resulted in a Sales/Leads/App status, as determined by the disposition type on the wrap up code |
Connects per Hour |
The rate of Connect dispositions over Hours Worked |
S-L-A/HR |
The rate of Sales/Leads/App dispositions over Hours Worked |
Conversion Rate |
The ratio of Sales/Leads/App dispositions over total Contacts |
Conversion Factor |
The rate of Sales/Leads/App dispositions per Contact per hour |
Talk Time |
The aggregated amount of time talking during all calls |
Avg Talk Time |
Total time spent talking on calls divided by the number of those calls |
Time Paused |
The agent time spent on paused status while logged-in |
Wait Time |
The agent time spent in waiting status while logged-in |
Avg Wait Time |
The total Wait Time divided by the number of times in waiting status |
Wrap Up Time |
The agent time spent wrapping up calls; it includes both after-call work and time spent previewing a lead |
Avg Wrap Up Time |
The Wrap Up Time divided by the number of times in wrap-up status |
Total Time |
The sum of of Talk Time, Time Paused, Wait Time, and Disposition Time |
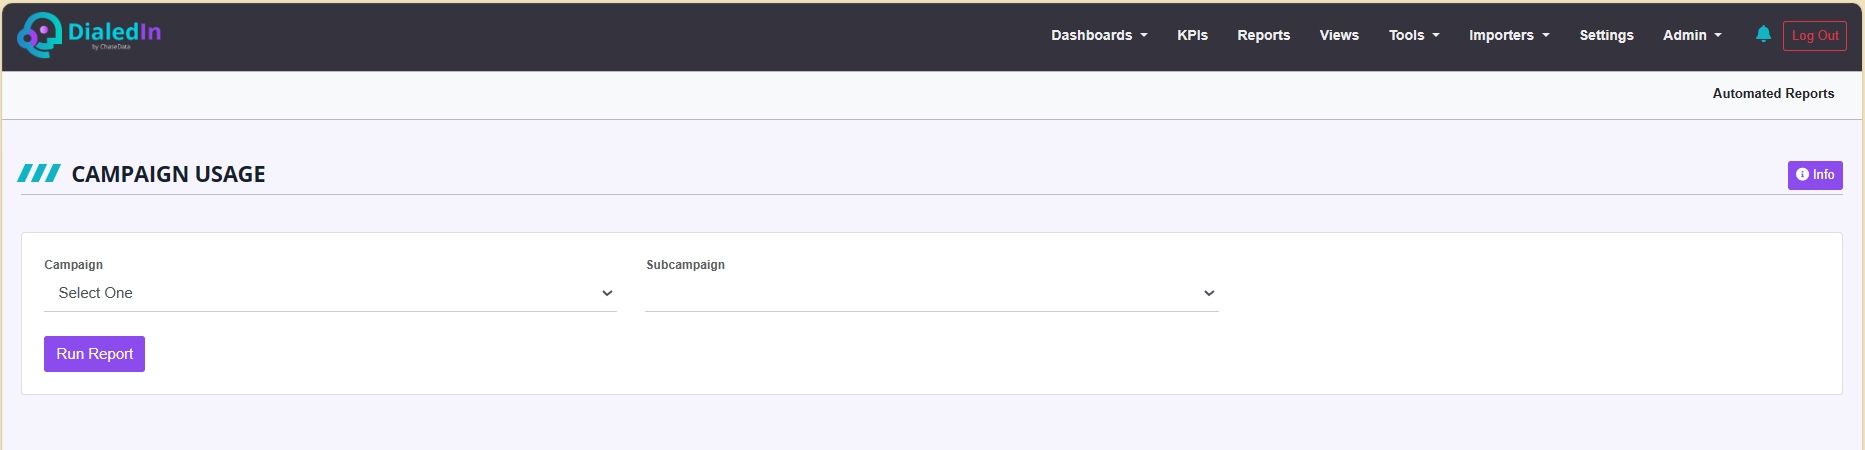
Campaign Usage
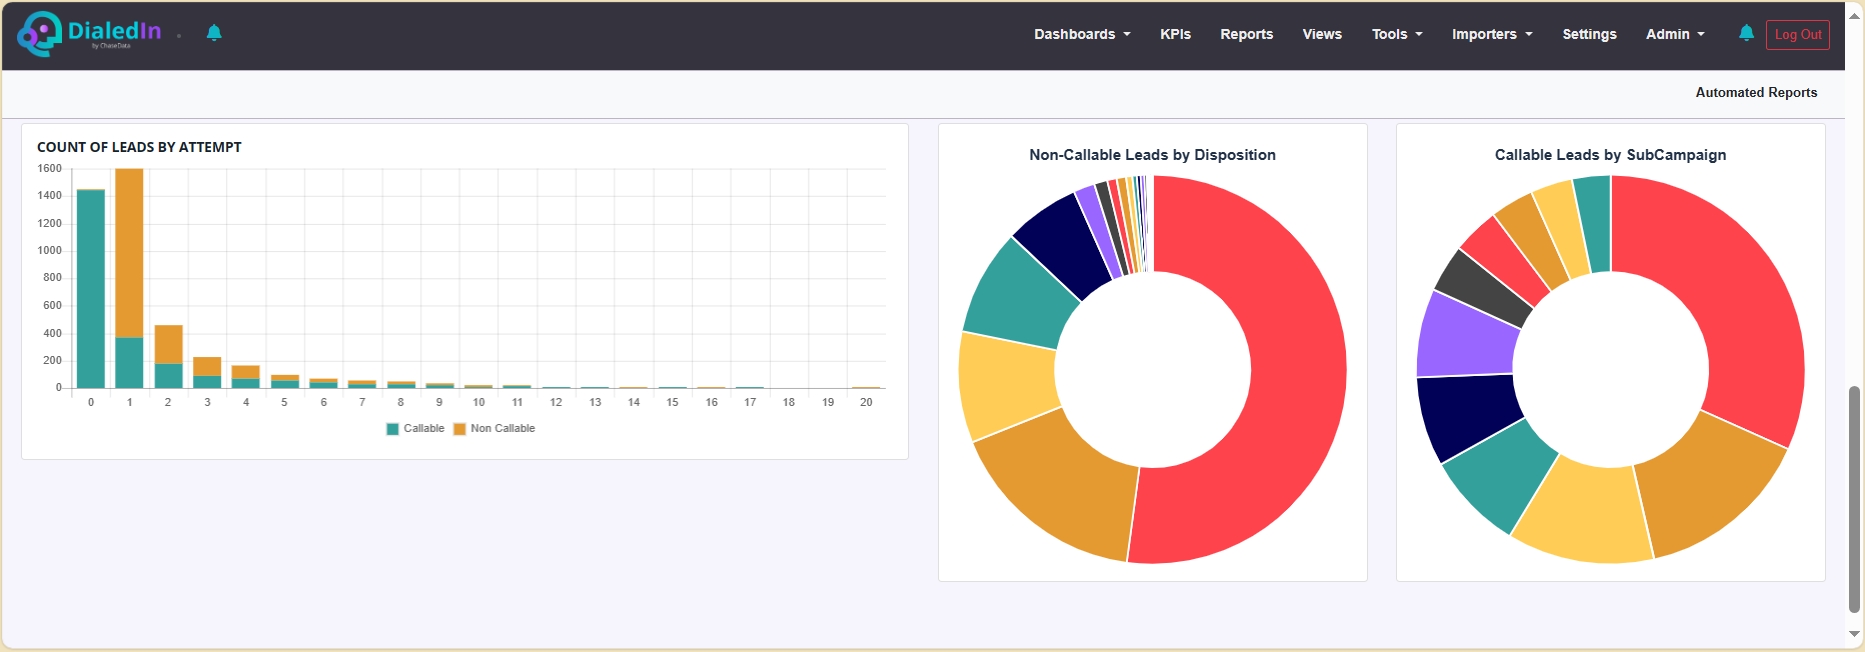
This report breaks down all leads in a campaign by the number of dialing attempts on each, and if the lead is marked as callable or not.
Note that the charts will not be included when the report is exported.
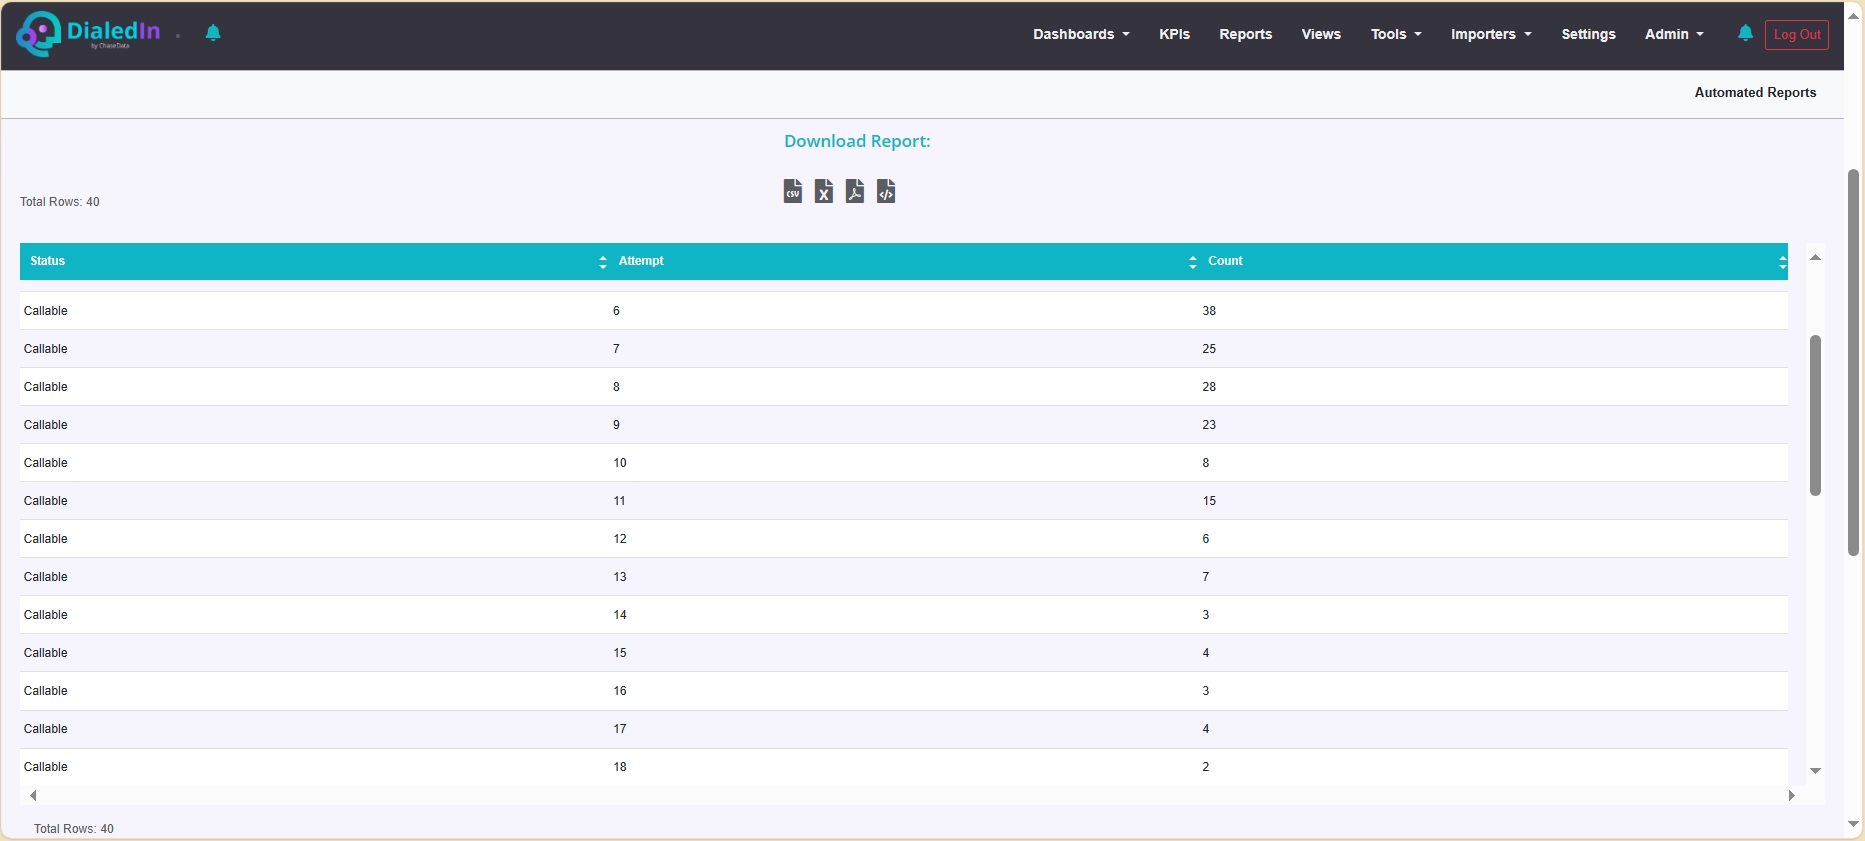
The table results include the following columns:
Status |
Indicates if a Lead is marked as Callable or Uncallable |
|---|---|
Attempt |
Dialing Attempt Number |
Count |
Total Number of Leads with that Number of Attempted Dials |
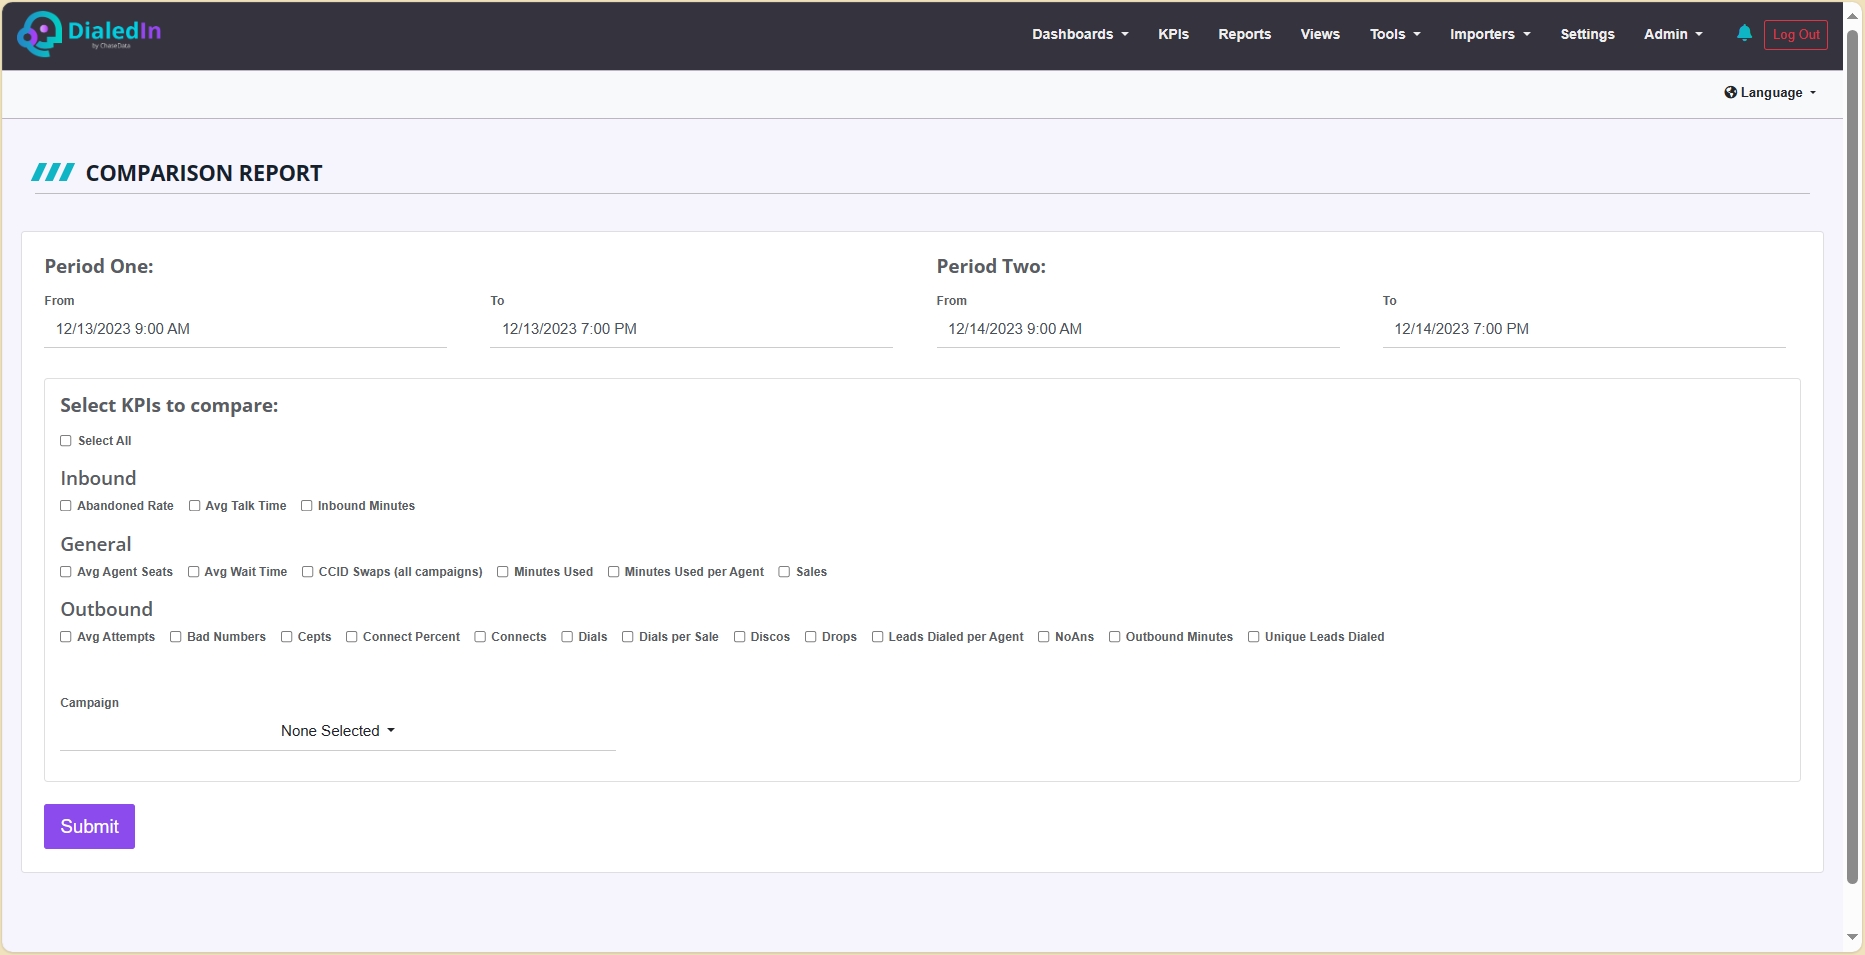
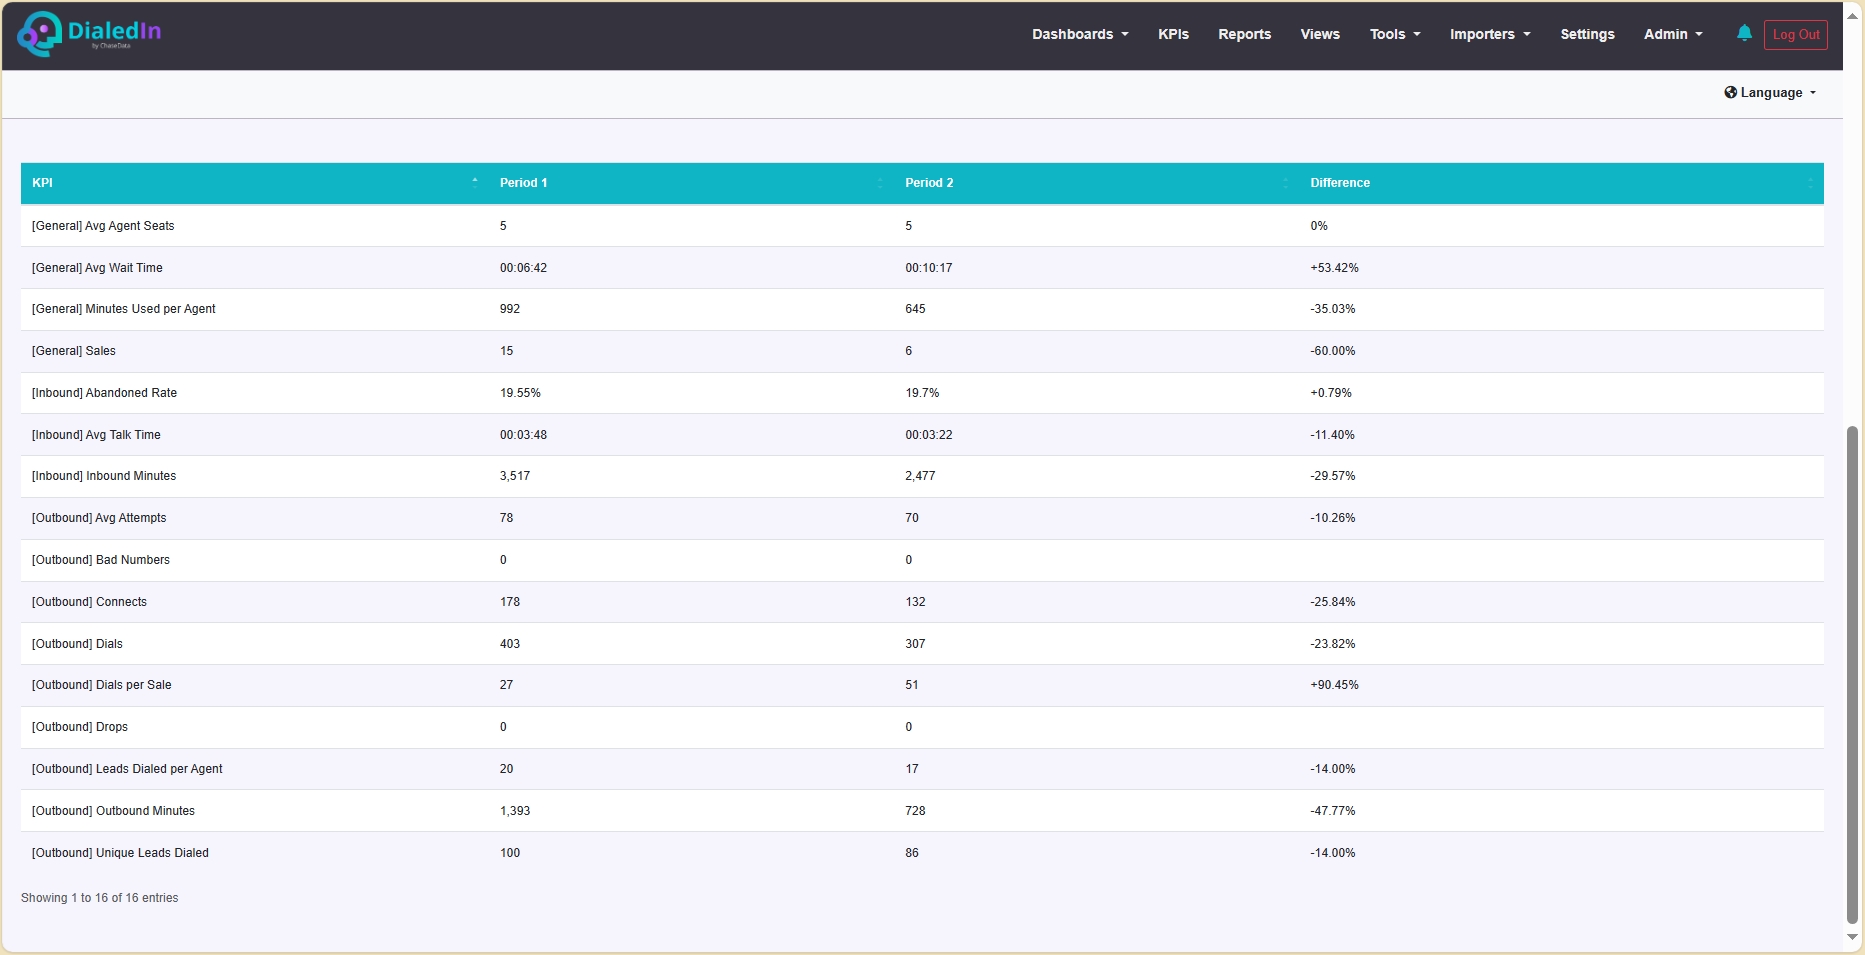
Comparison Report
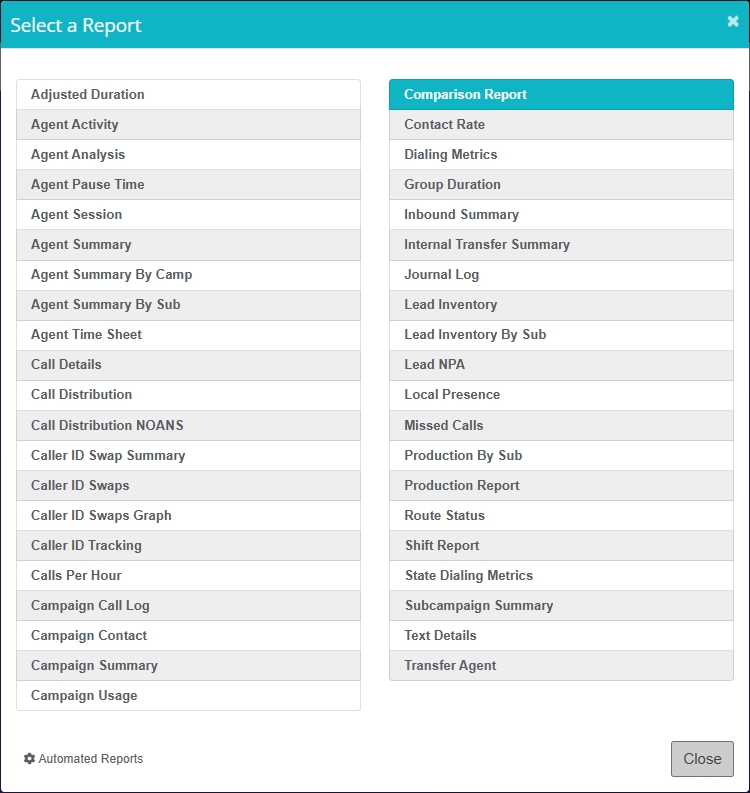
This report provides a side by side comparison of the selected KPIs for two custom periods of time.
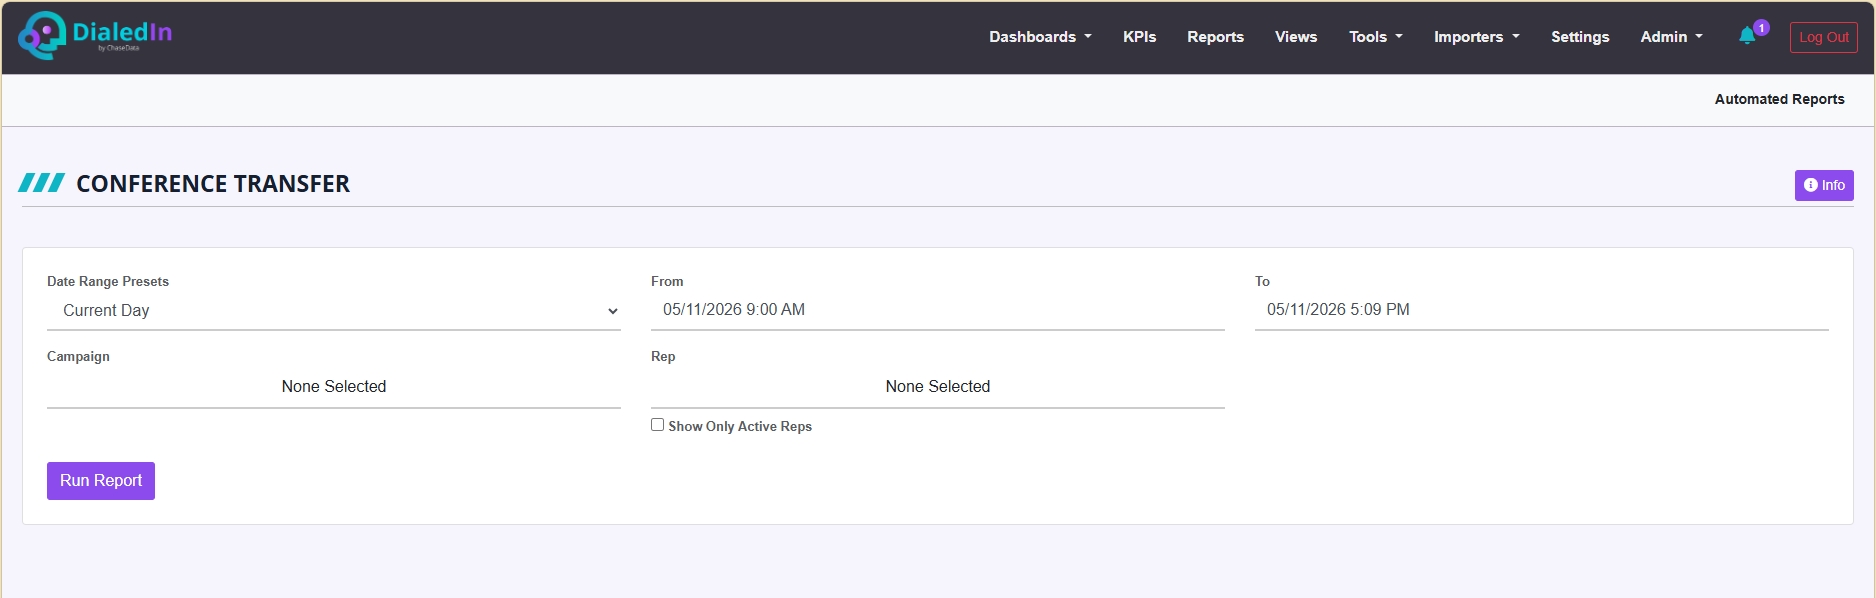
Conference Transfer
This report summarizes conference transfers by reps on a date range.
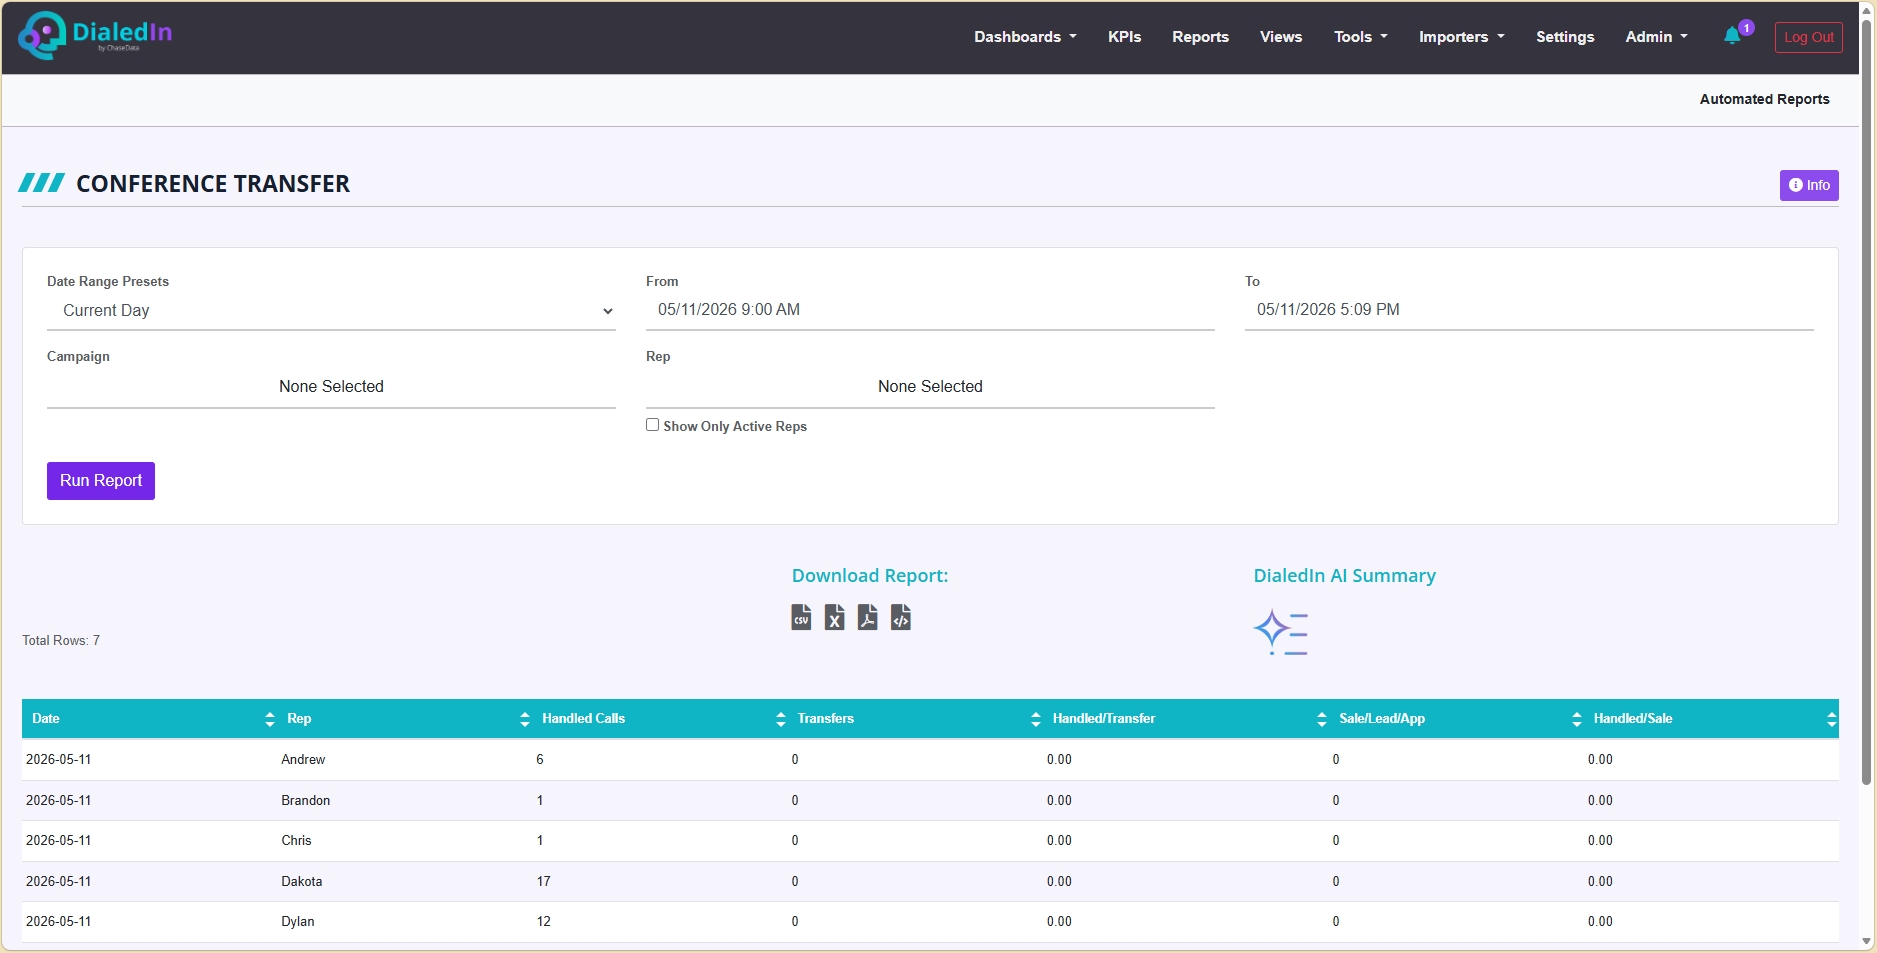
The table results include the following columns:
Date |
The date and time when the event or call took place |
|---|---|
Rep |
The agent's login identifier |
Handled Calls |
The total number of calls handled by this agent |
Transfers |
The number of calls that were transferred or received by transfer |
Handled/Transfer |
The ratio of handled calls over transfers |
Sale/Lead/App |
Number of calls that resulted in a Sales/Leads/App status, as determined by the disposition type on the wrap up code |
Handled/Sale |
The ratio of handled calls over sales |
Contact Rate
This report summarizes Calls, Answers, Connects, Contacts and Conversions for the given date range.

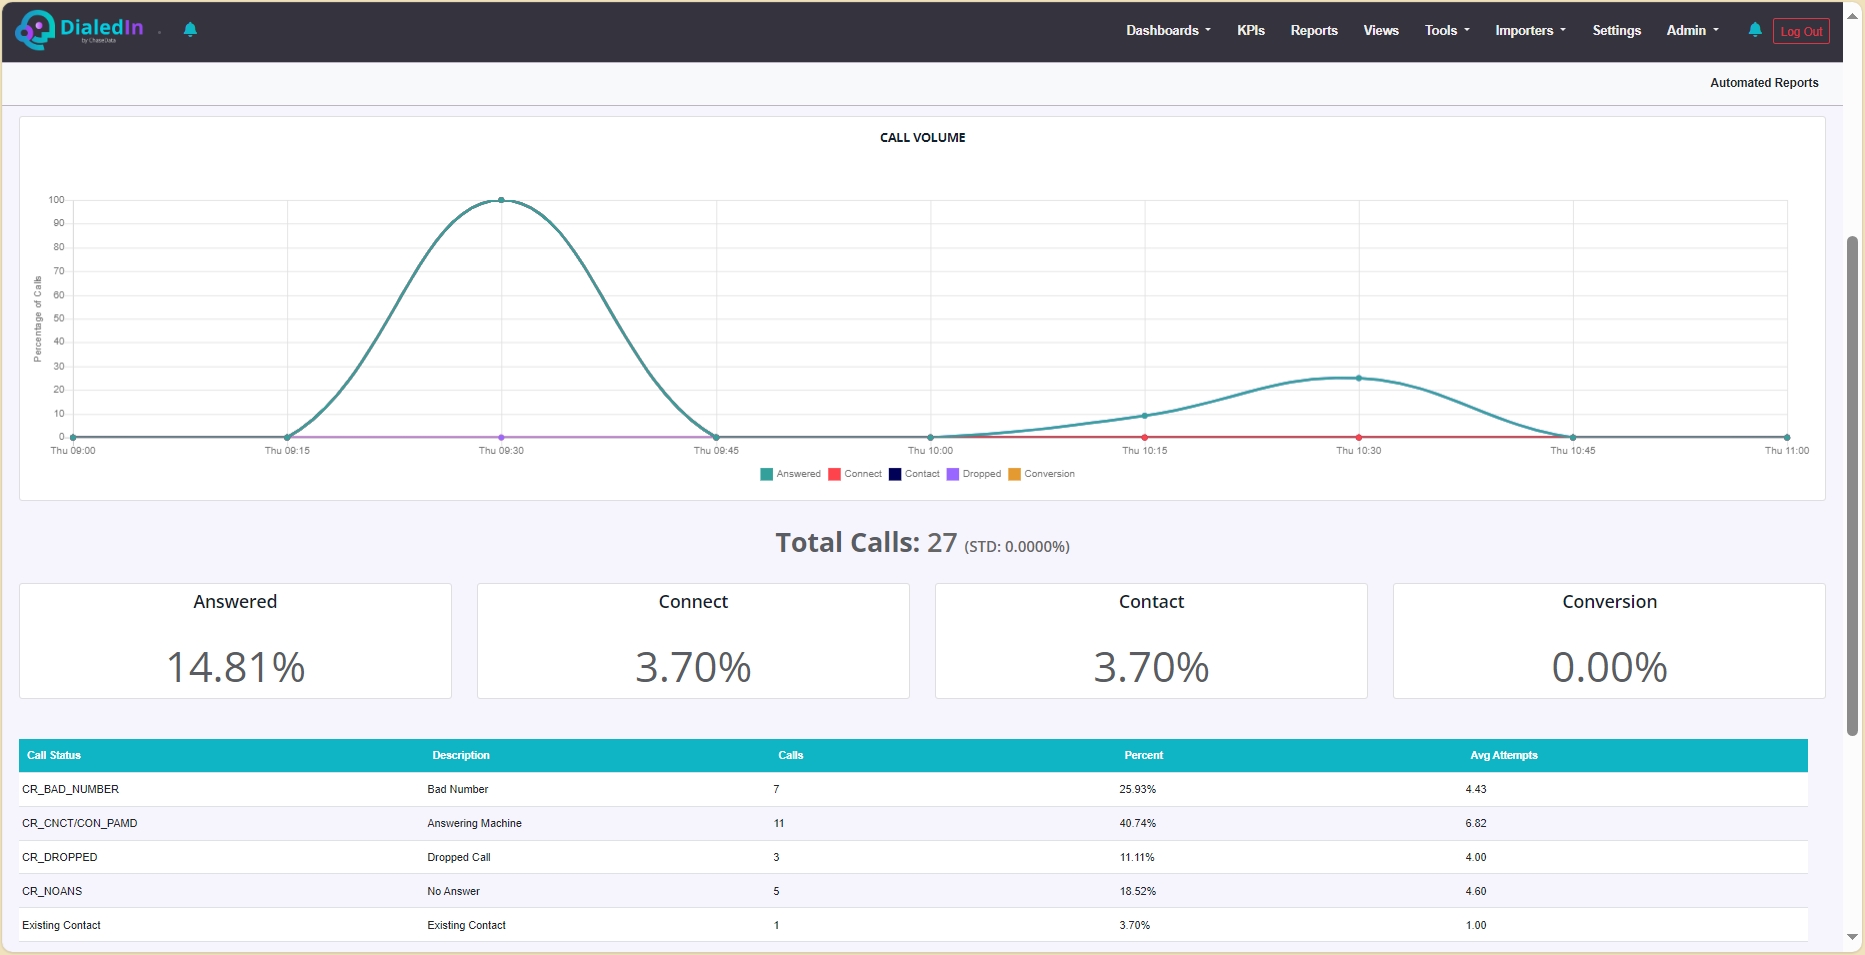
The table results include the following columns:
Call Status |
Disposition of Calls counted |
|---|---|
Description |
Description of Call Status |
Calls |
Total Count of calls with this disposition |
Percent |
Percentage of calls with this disposition |
Avg Attempts |
Average Dialing Attempts |
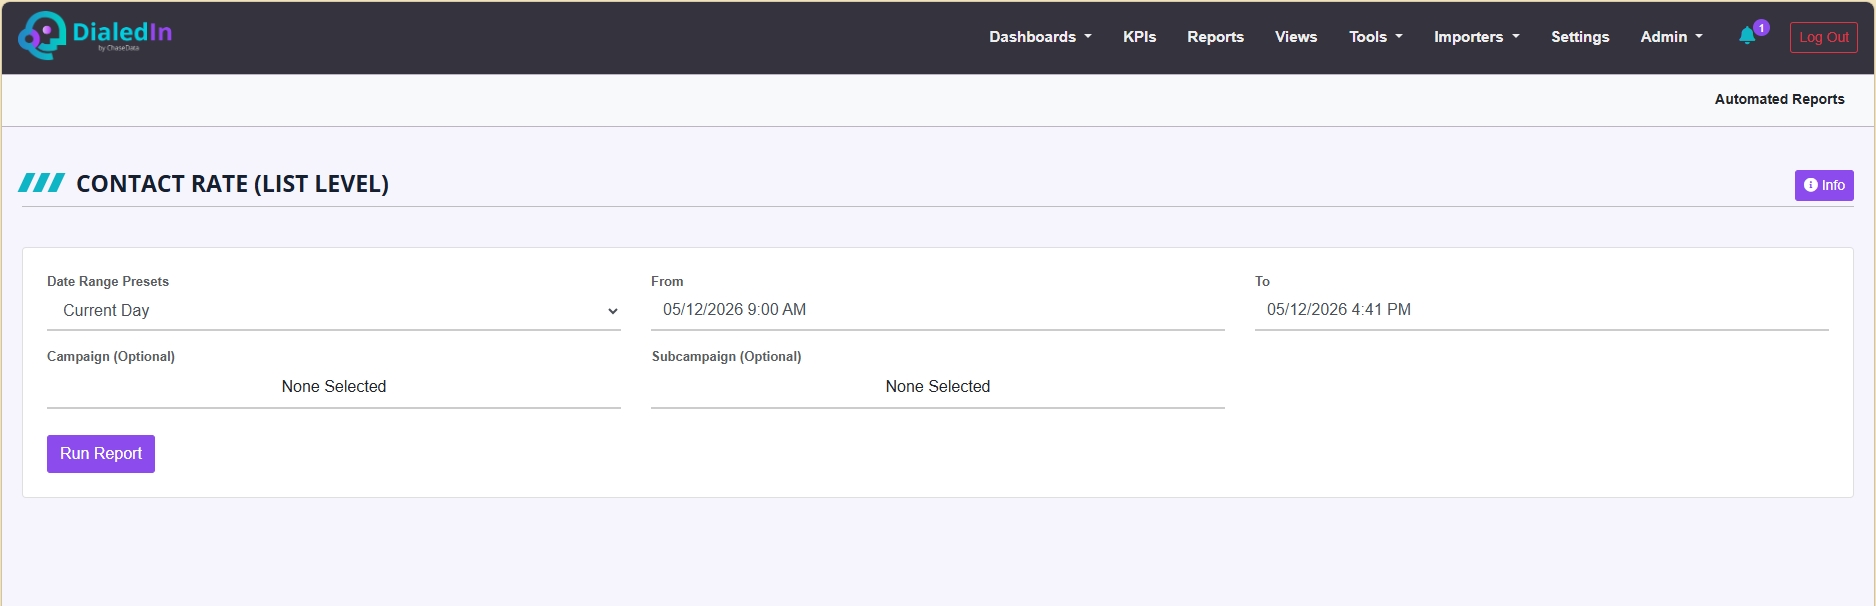
Contact Rate (List Level)
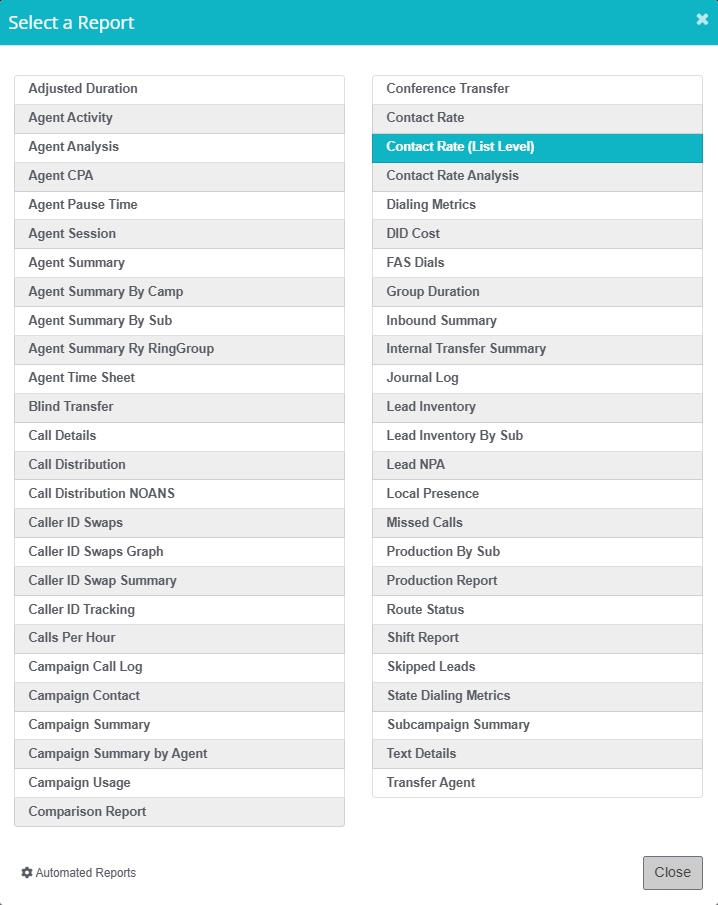
This report summarizes Calls, Answers, Connects, Contacts and Conversions for the given date range, while also providing statistics for each call status in that group.
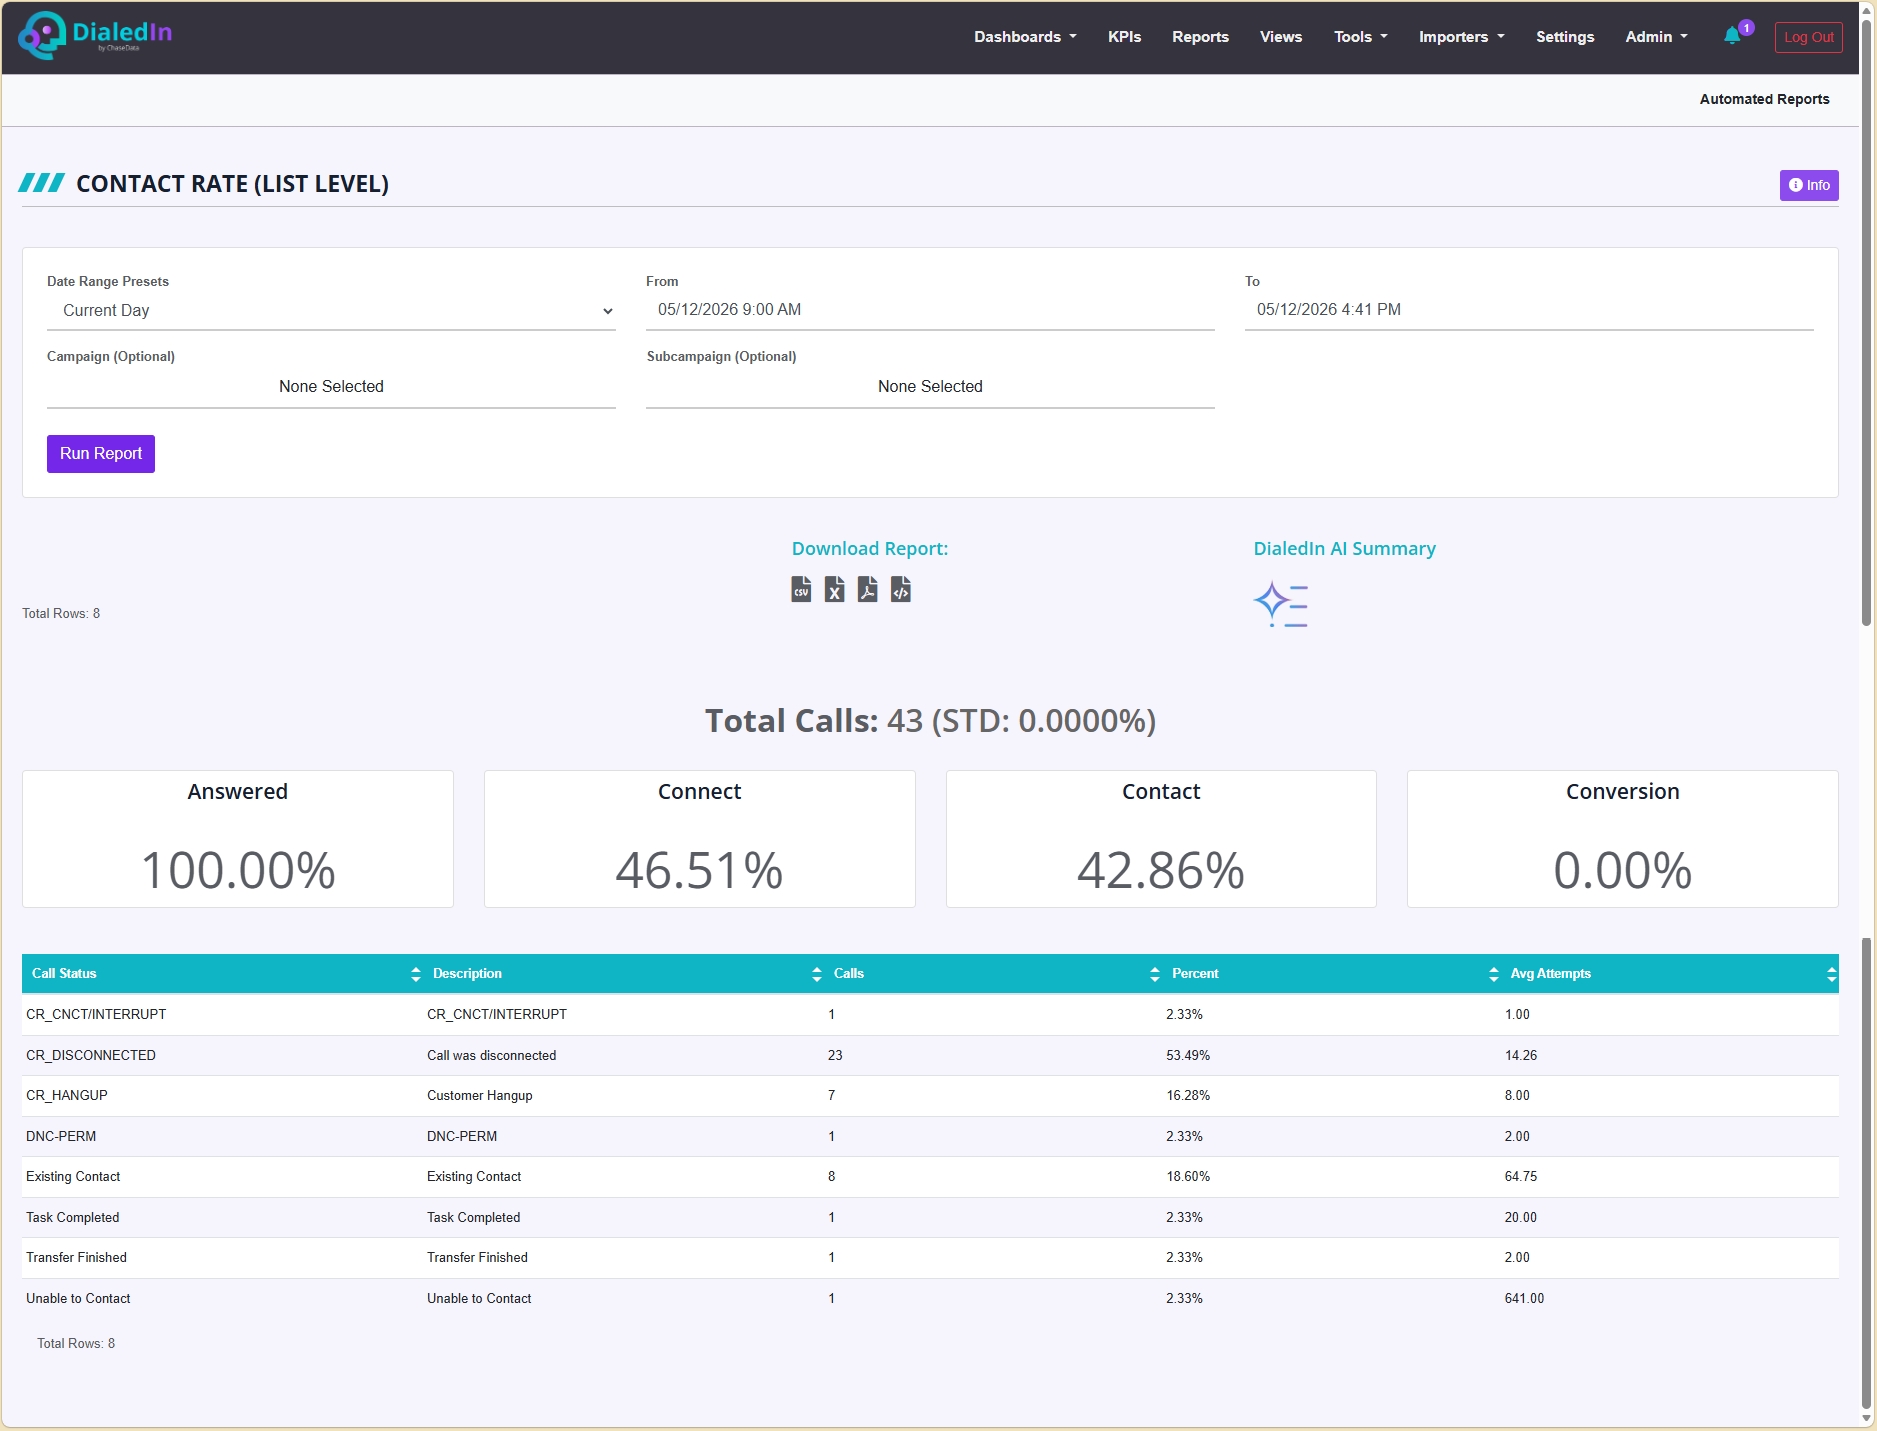
The table results include the following columns:
Total Calls |
The total number of calls in this date range |
|---|---|
Answered |
The percentage of calls that were answered |
Connect |
The ratio of Connects (as determined by the disposition type on the wrap up code) over Total Calls |
Contact |
The ratio of Contacts (as determined by the disposition type on the wrap up code) over total Unique Lead calls (list level) |
Conversion |
The percentage of calls that resulted in a Sales/Leads/App status, as determined by the disposition type on the wrap up code |
Call Status |
The call disposition grouping the row's set of statistcis |
Description |
A description of the Call Status (disposition) |
Calls |
The number of calls resulting in this Call Status |
Percent |
The ratio of calls resulting in this Call Status over Total Calls |
Avg Attempts |
The average number of call attempts made for Unique Lead in this report |
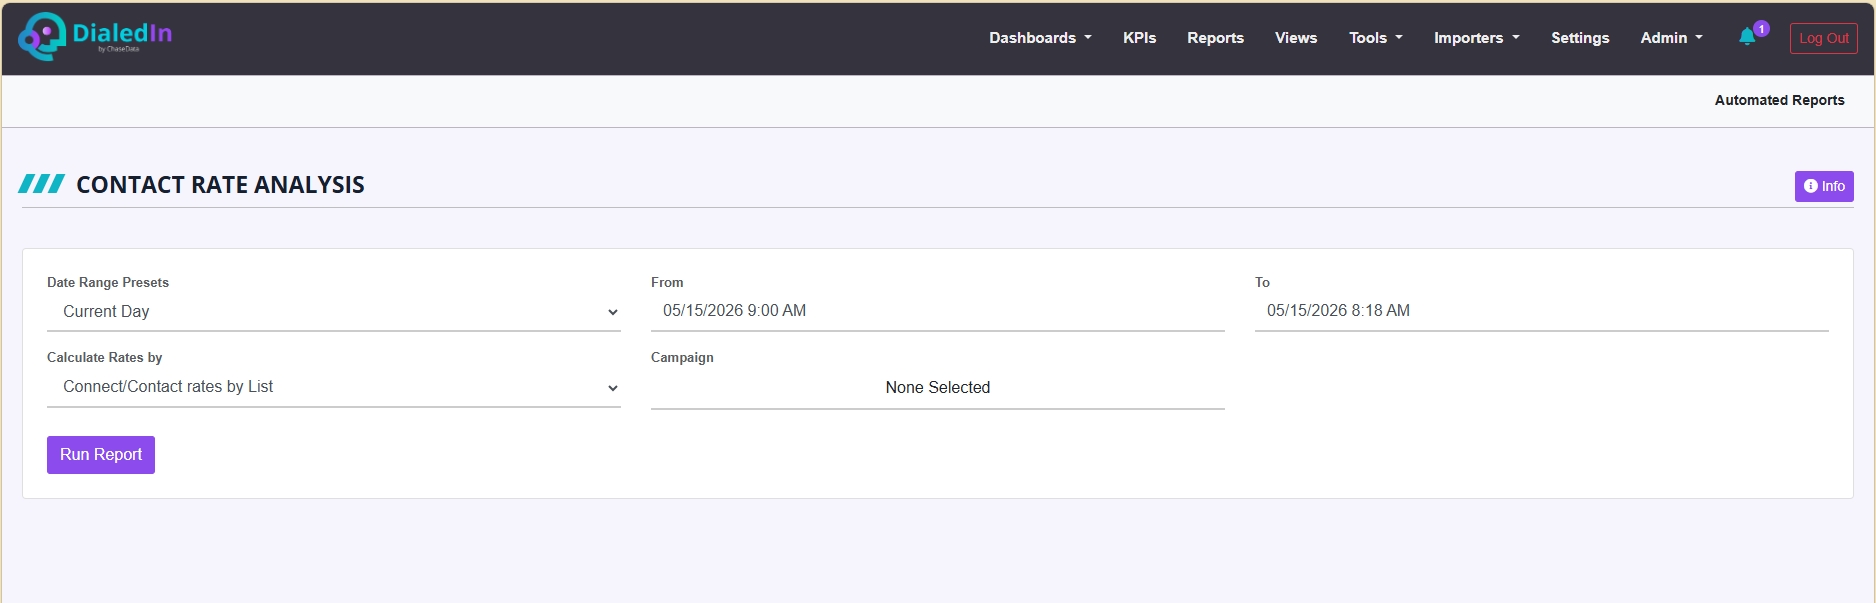
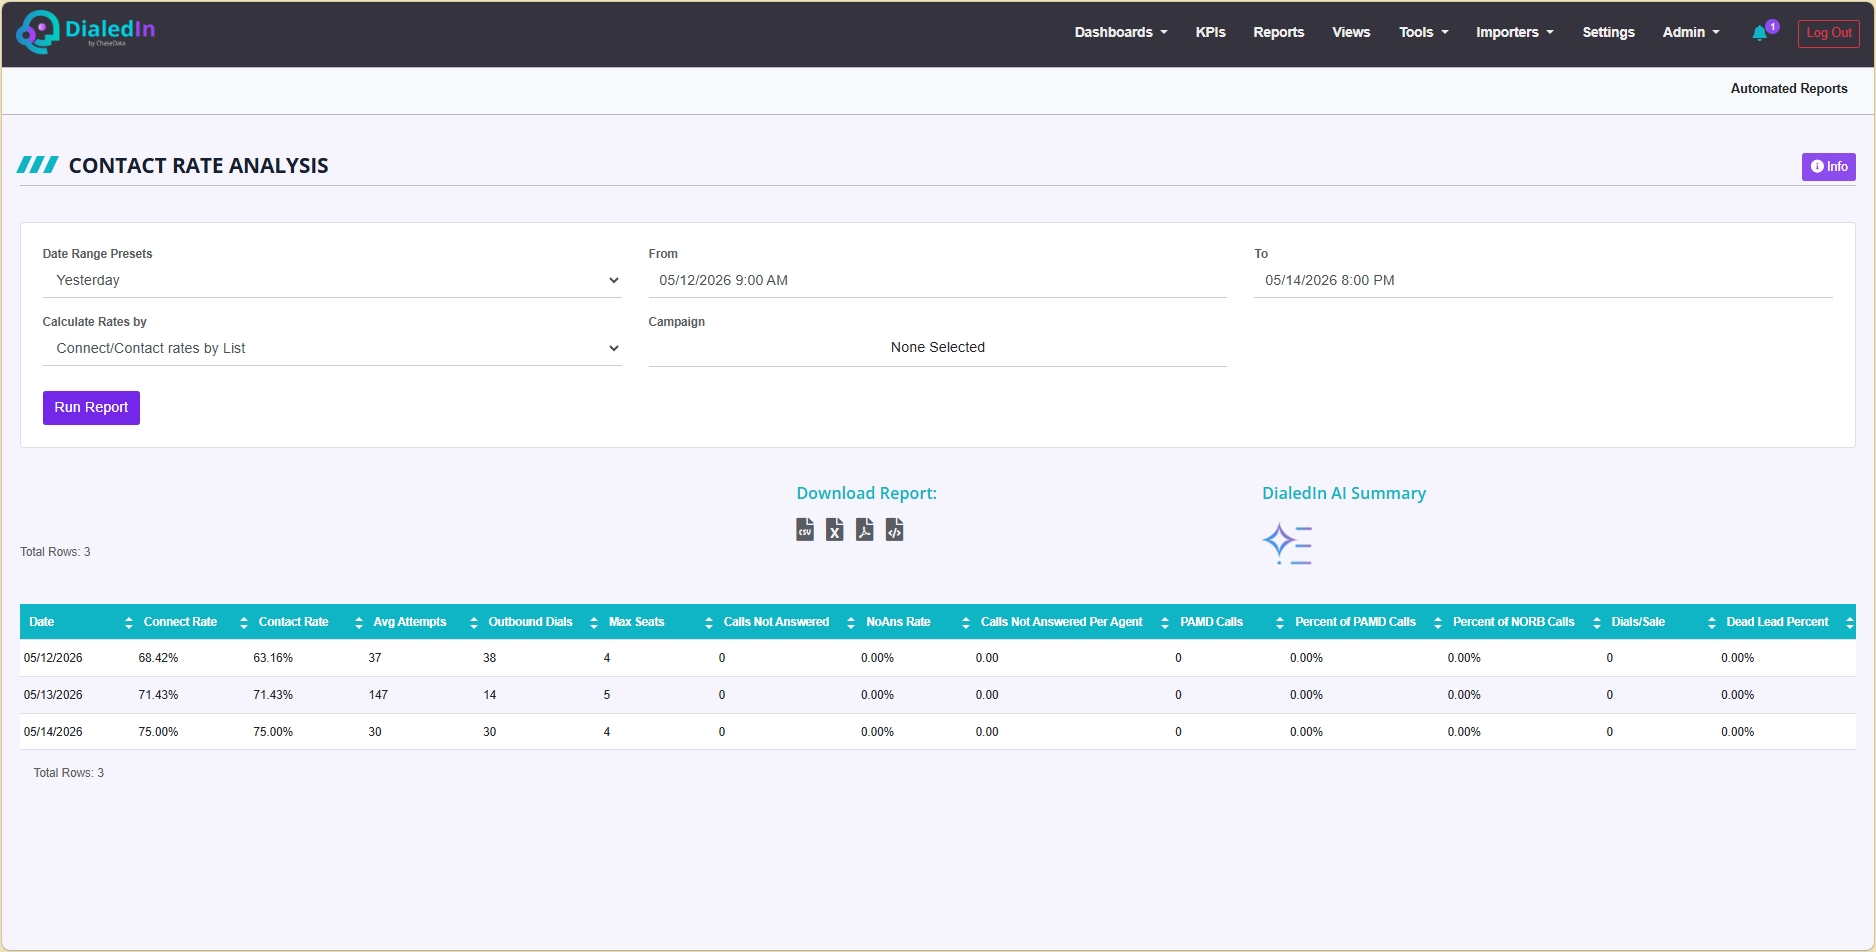
Contact Rate Analysis
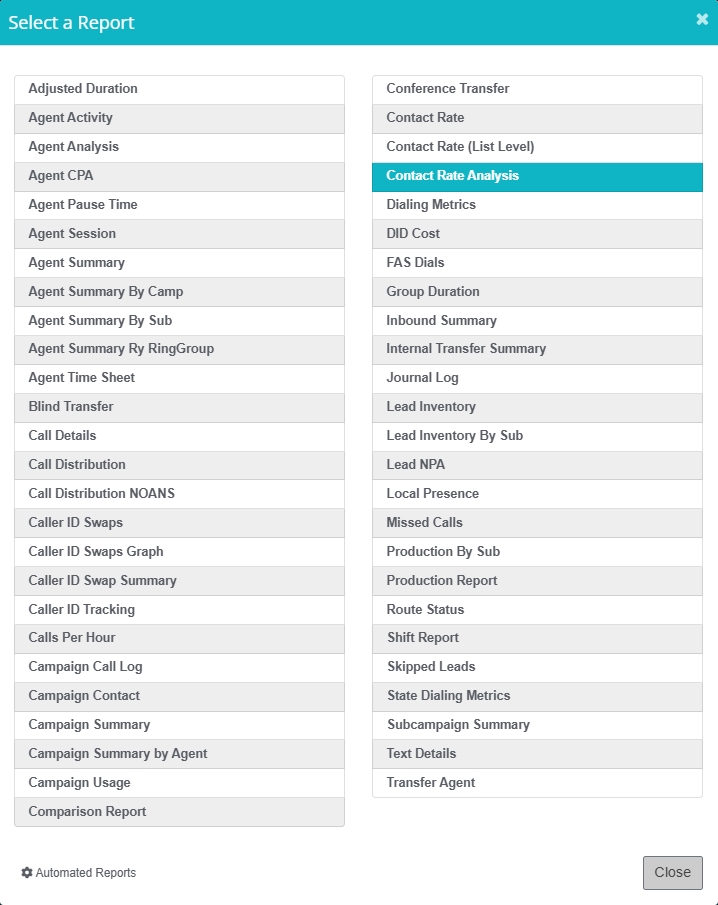
This report summarizes Outbound Calls for the given date range.
The table results include the following columns:
Date |
The date for which this row's statistics is provided |
|---|---|
Connect Rate |
The ratio of Connects (as determined by the disposition type on the wrap up code) over Total Calls |
Contact Rate |
The ratio of Contacts (as determined by the disposition type on the wrap up code) over Total Calls |
Avg Attempts |
The average number of call attempts made in this date |
Outbound Dials |
The number of outbound calls, including Manual and Progressive dial outs |
Max Seats |
The maximum number of seats used |
Calls Not Answered |
The number of calls not answered, as determined by a disposition of CR_NOANS |
NoAns Rate |
The percentage of calls that were not answered |
Calls Not Answered Per Agent |
The rate of calls not answered per agent, i.e., divided by Max Seats |
PAMD Calls |
Number of calls with a disposition of CR_CNCT/CON_PAMD (Called Line Connected / Positive Answering Machine Detection) |
Percent of PAMD Calls |
The ratio of calls that are PAMD Calls |
Percent of NORB Calls |
The ratio of calls that are dispositioned as NR_NORB (No Ring Back) |
Dials/Sale |
The ratio of of Sales calls (Sales/Leads/App status, as determined by the disposition type) over total outbound calls |
Dead Lead Percent |
The percentage of leads that had the last 6 calls in a row within the last 30 days, not answered |
Dialing Metrics
This is an internal report for use by DialedIn Support only
FAS Dials
** Coming Soon **
Group Duration
This is an internal report for use by DialedIn Support only
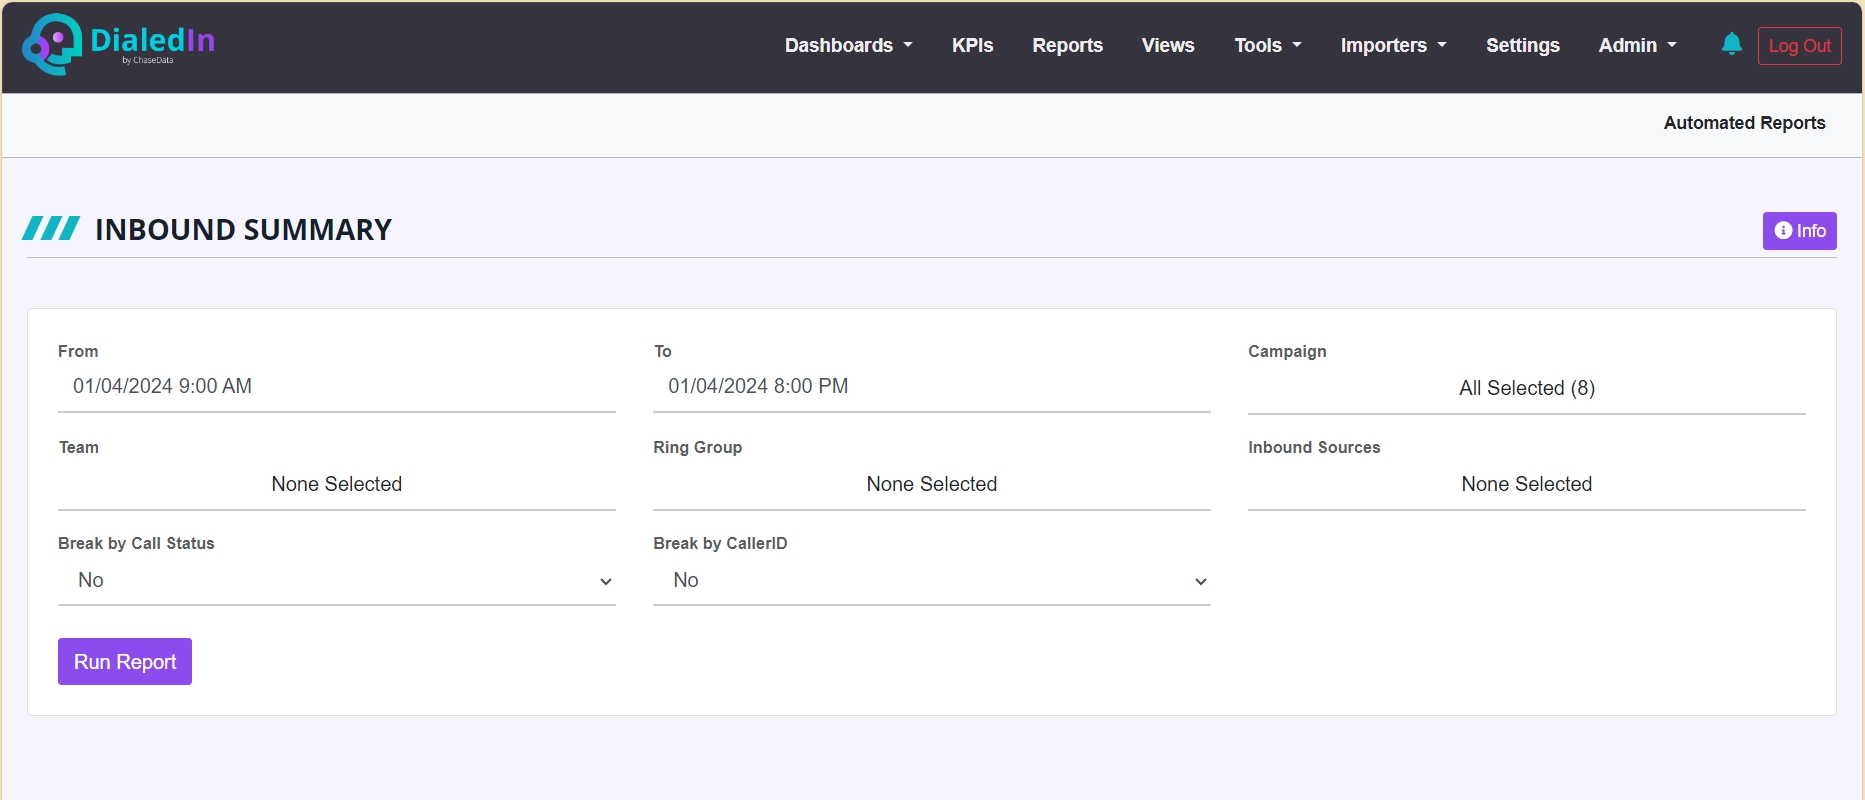
Inbound Summary
This report summarizes inbound calls for the specified date range.
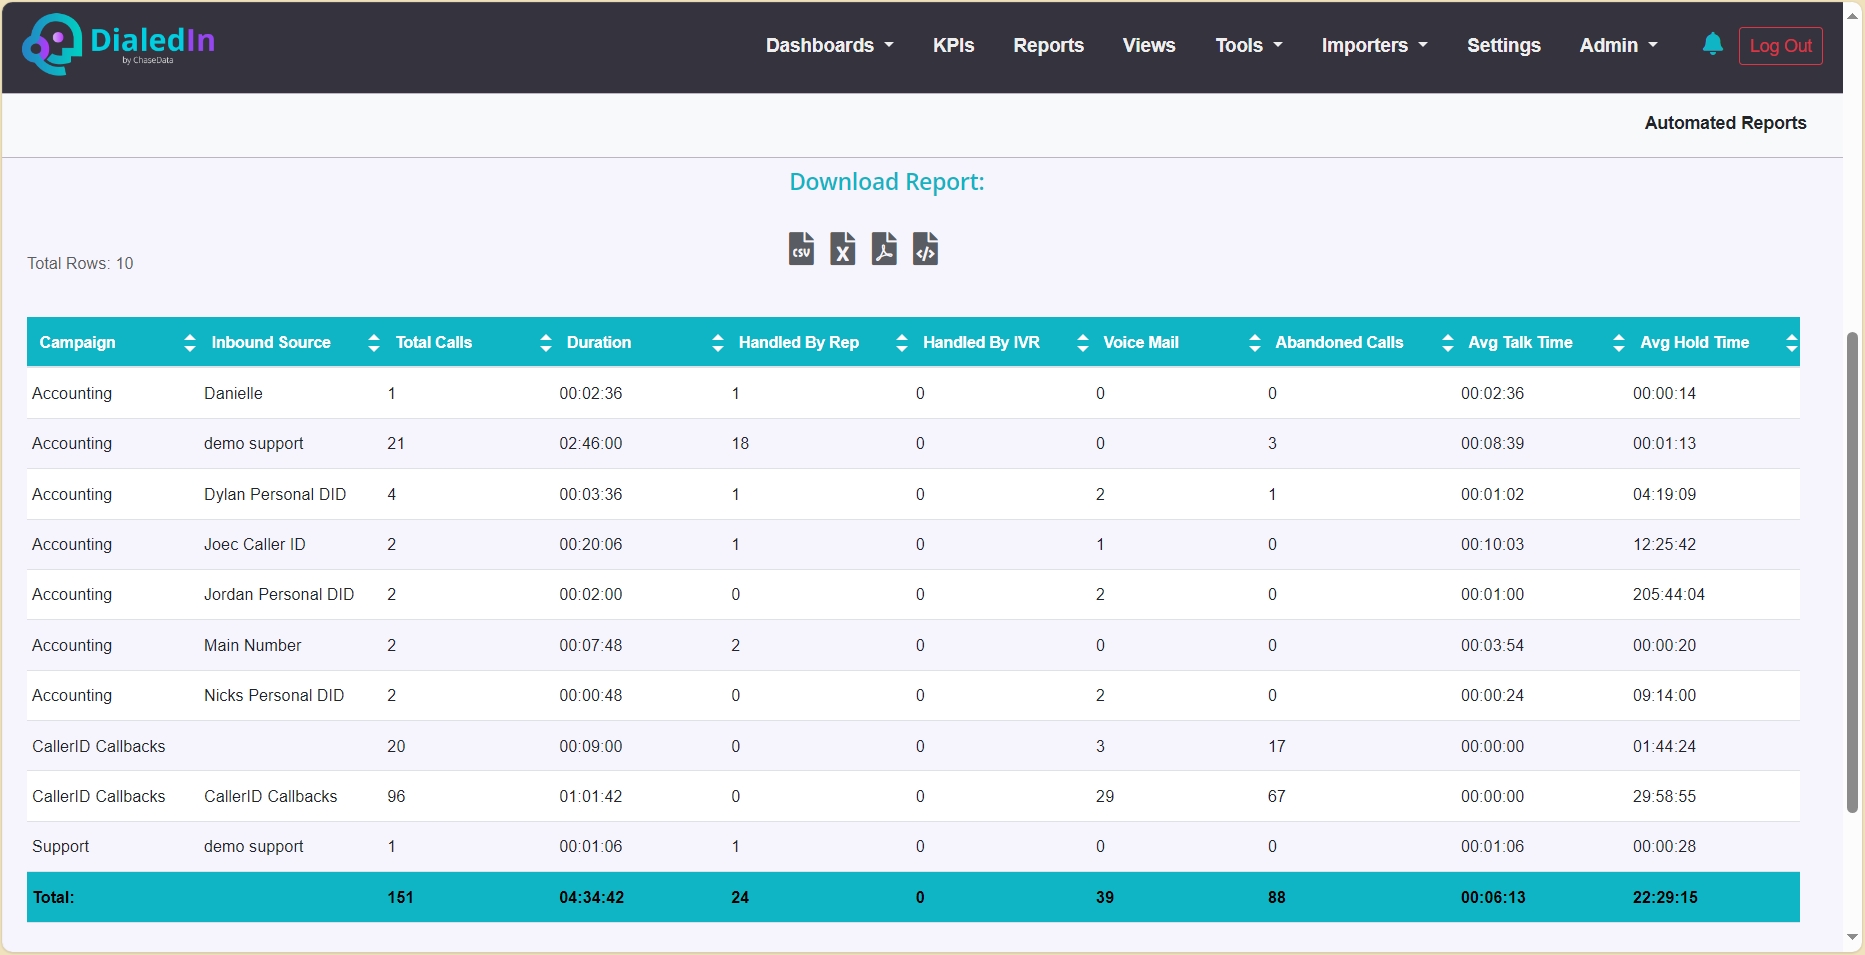
The table results include the following columns:
Campaign |
Dialing Campaign |
|---|---|
Inbound Source |
Caller ID and Description |
Total Calls |
Total number of corresponding calls |
Duration |
Total duration of all corresponding Events or Calls |
Handled By Rep |
Number of corresponding calls handled by an agent |
Handled By IVR |
Number of corresponding calls handled by the IVR |
Voice Mail |
Number of corresponding calls sent to Voicemail |
Abandoned Calls |
Number of corresponding calls that were Abandoned |
Avg Talk Time |
Total time spent on corresponding calls divided by the number of those calls passed to agents |
Avg Hold Time |
Average Hold Time for corresponding calls |
Internal Transfer Summary
This is an internal report for use by DialedIn Support only
Journal Log
This is an internal report for use by DialedIn Support only
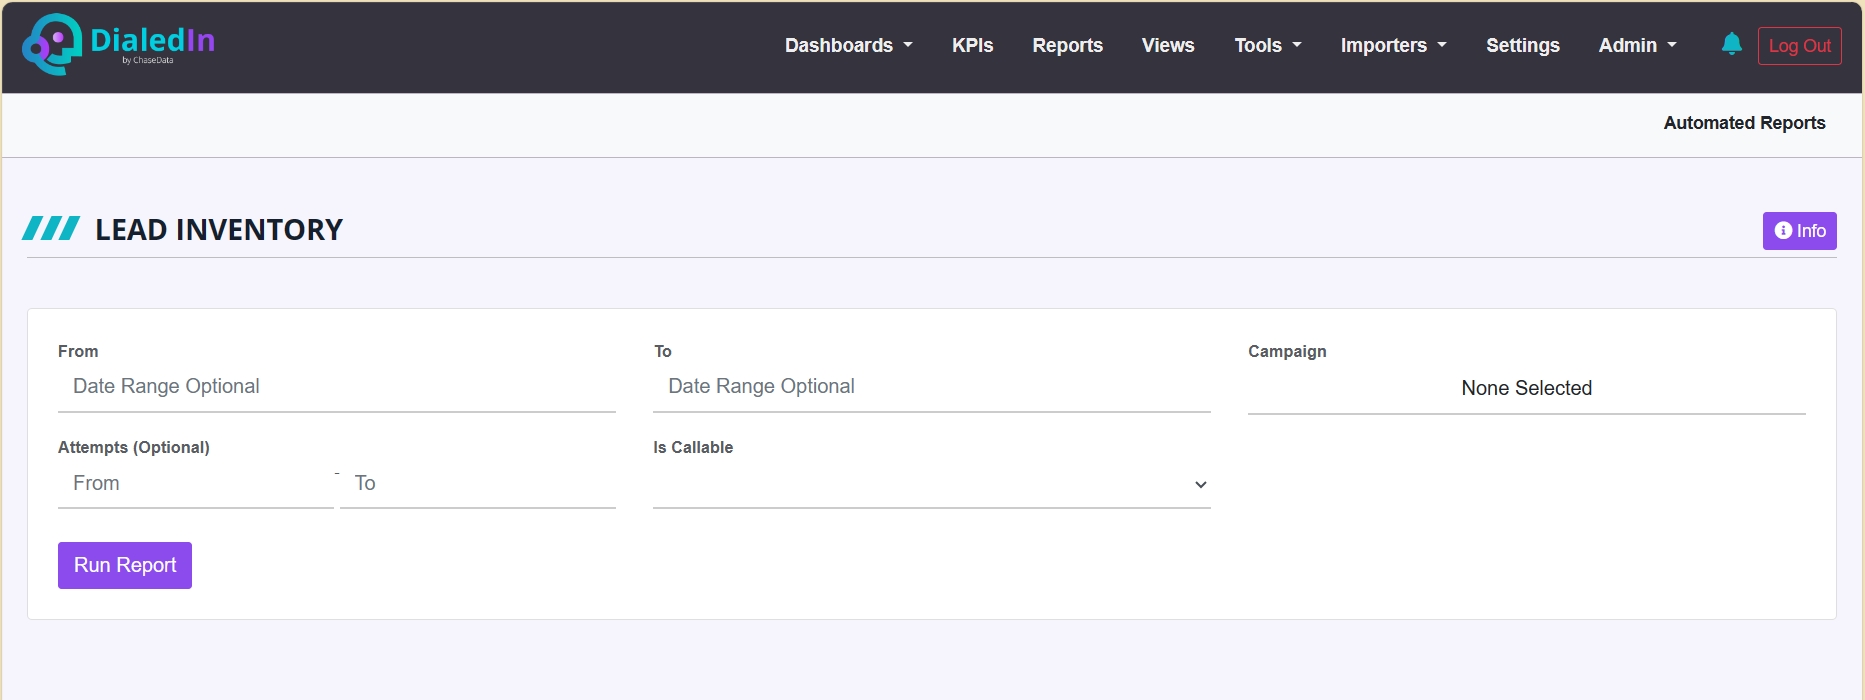
Lead Inventory
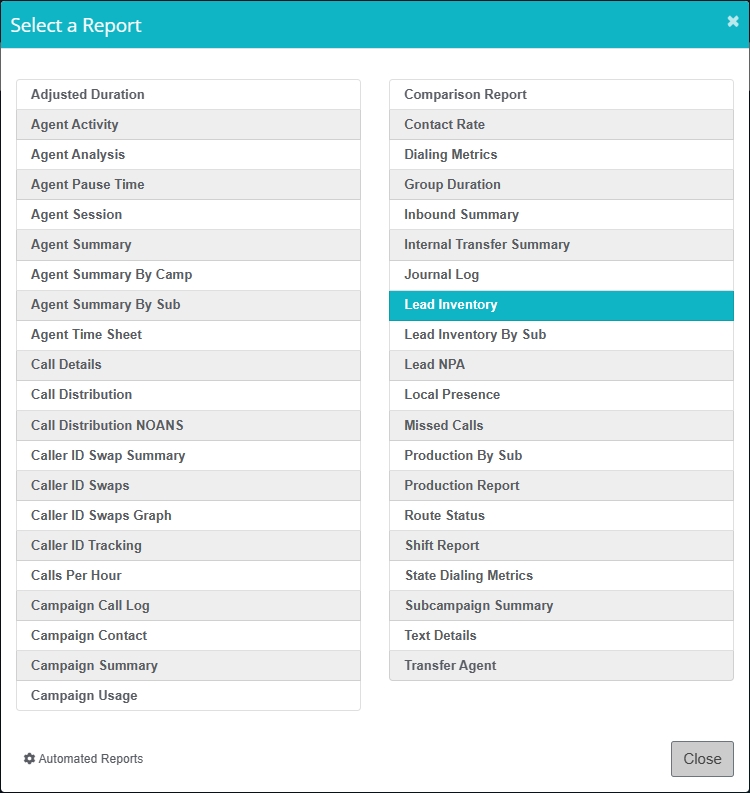
This report breaks down all of the leads in a campaign by Call Status. It also totals the number of available leads remaining.
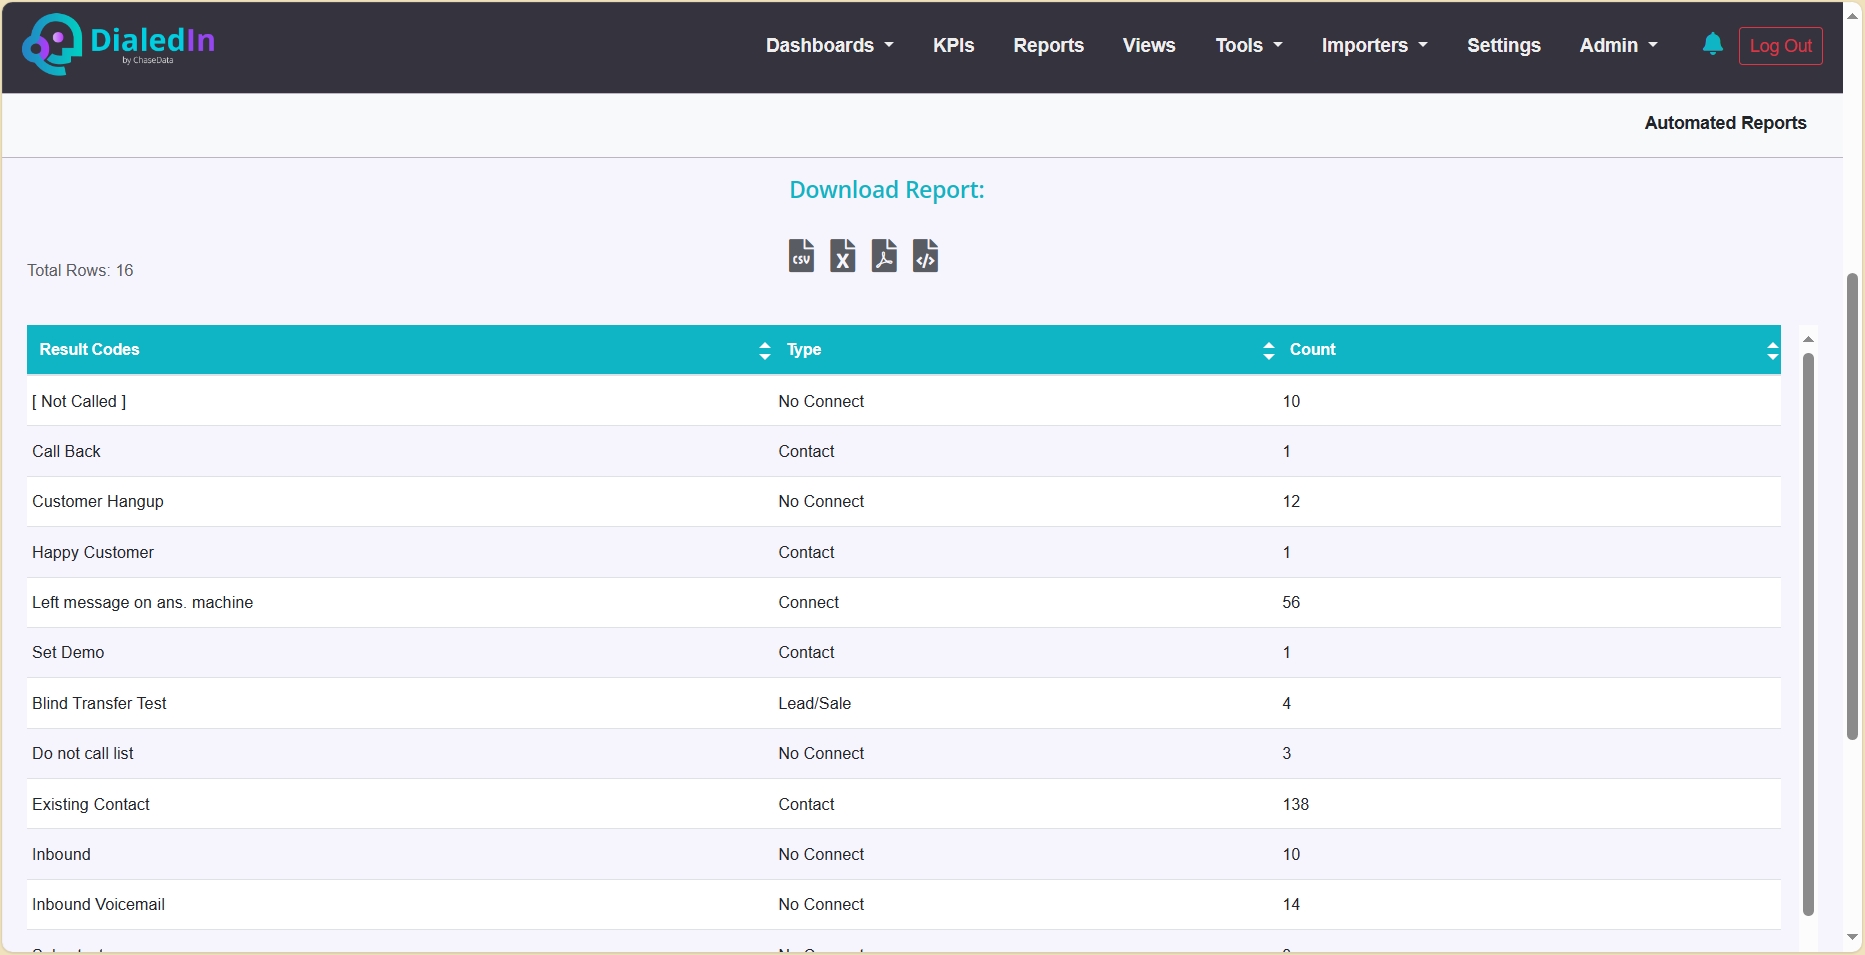
The table results include the following columns:
Result Codes |
Description of Call Disposition |
|---|---|
Type |
Indicates if the Call Made a Connection, Contact, etc. |
Count |
Number of Calls |
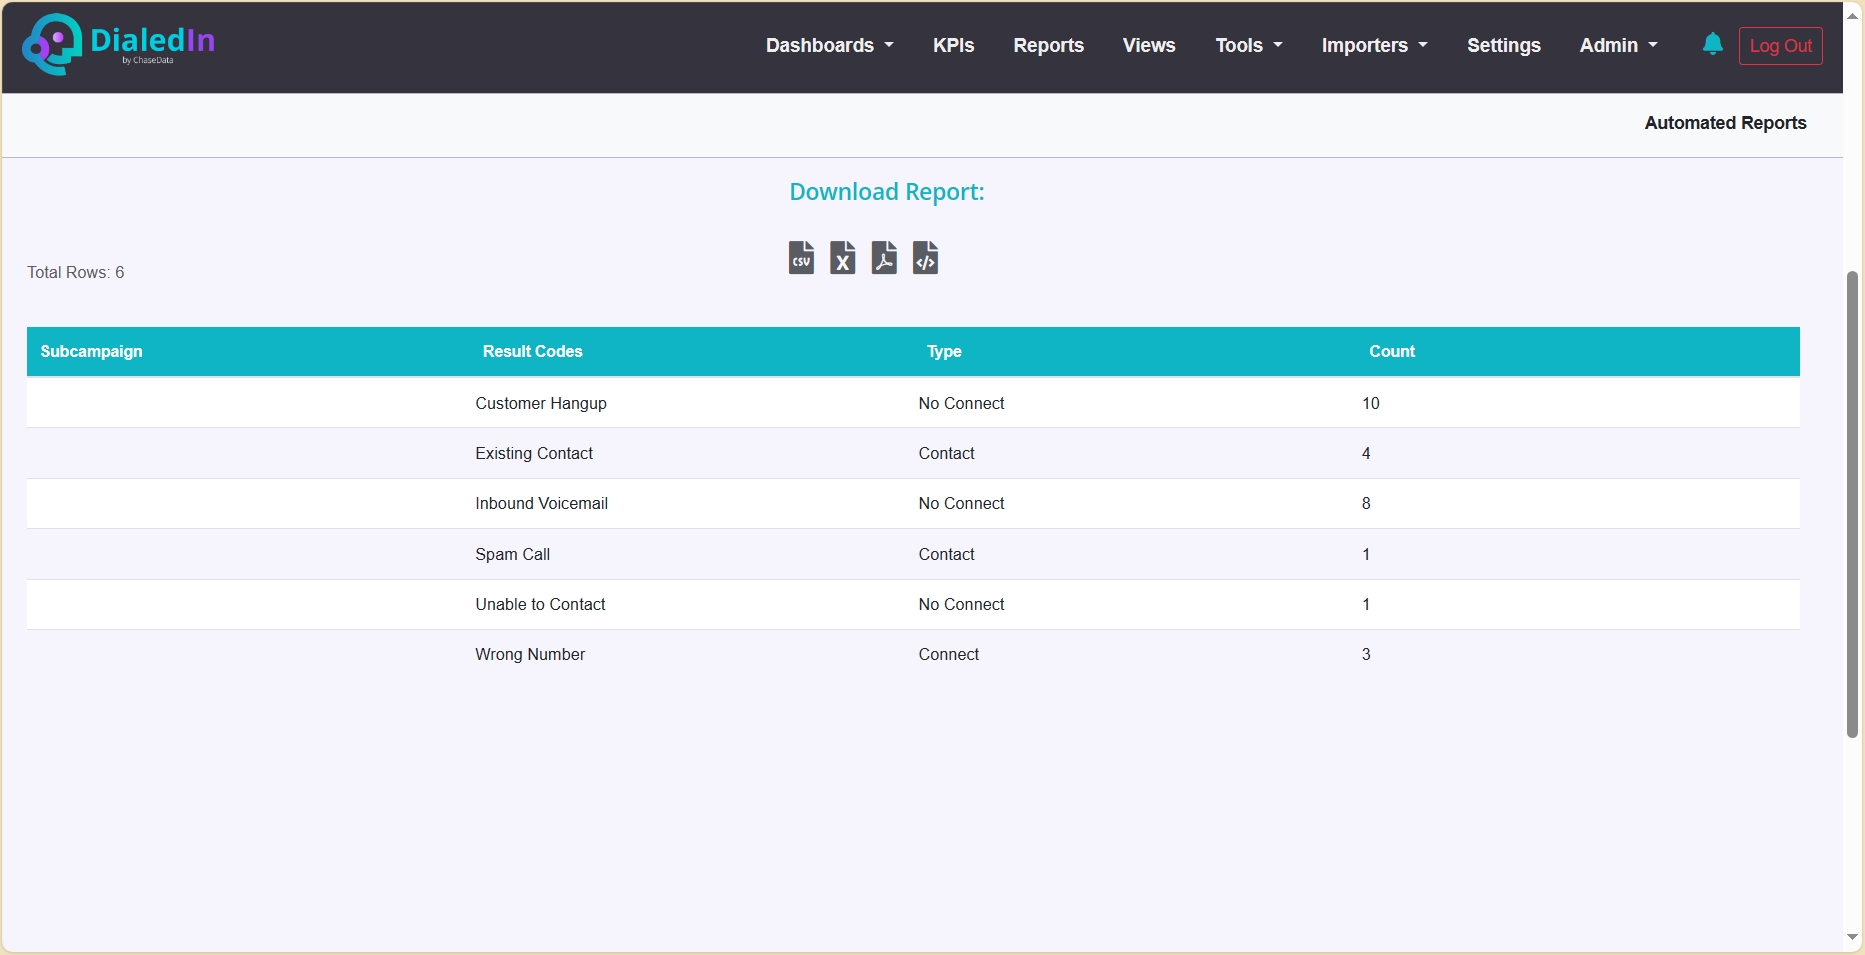
Lead Inventory By Sub
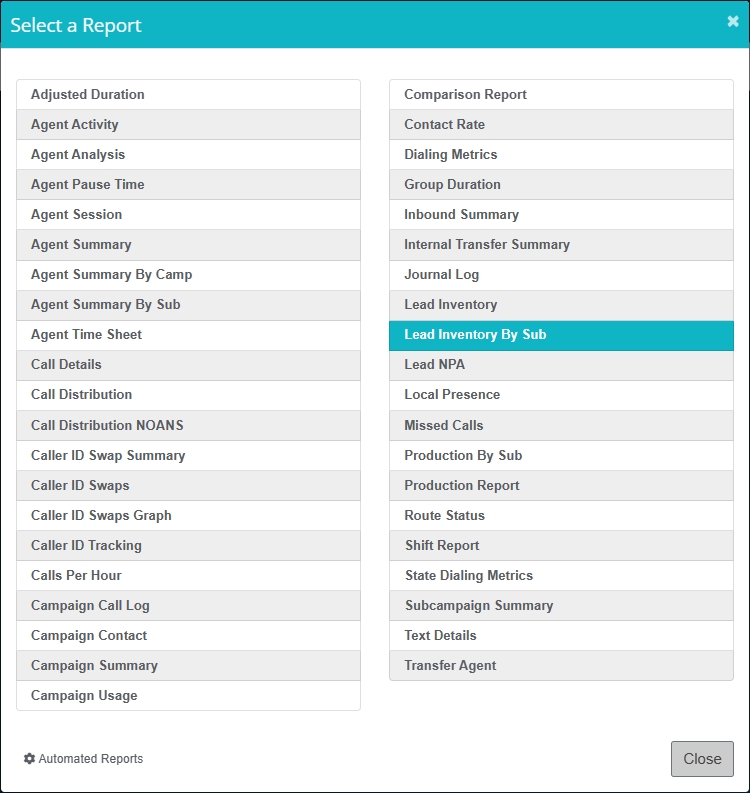
This report breaks down all of the leads in a campaign and sub-campaign by Call Status. It also totals the number of available leads remaining.
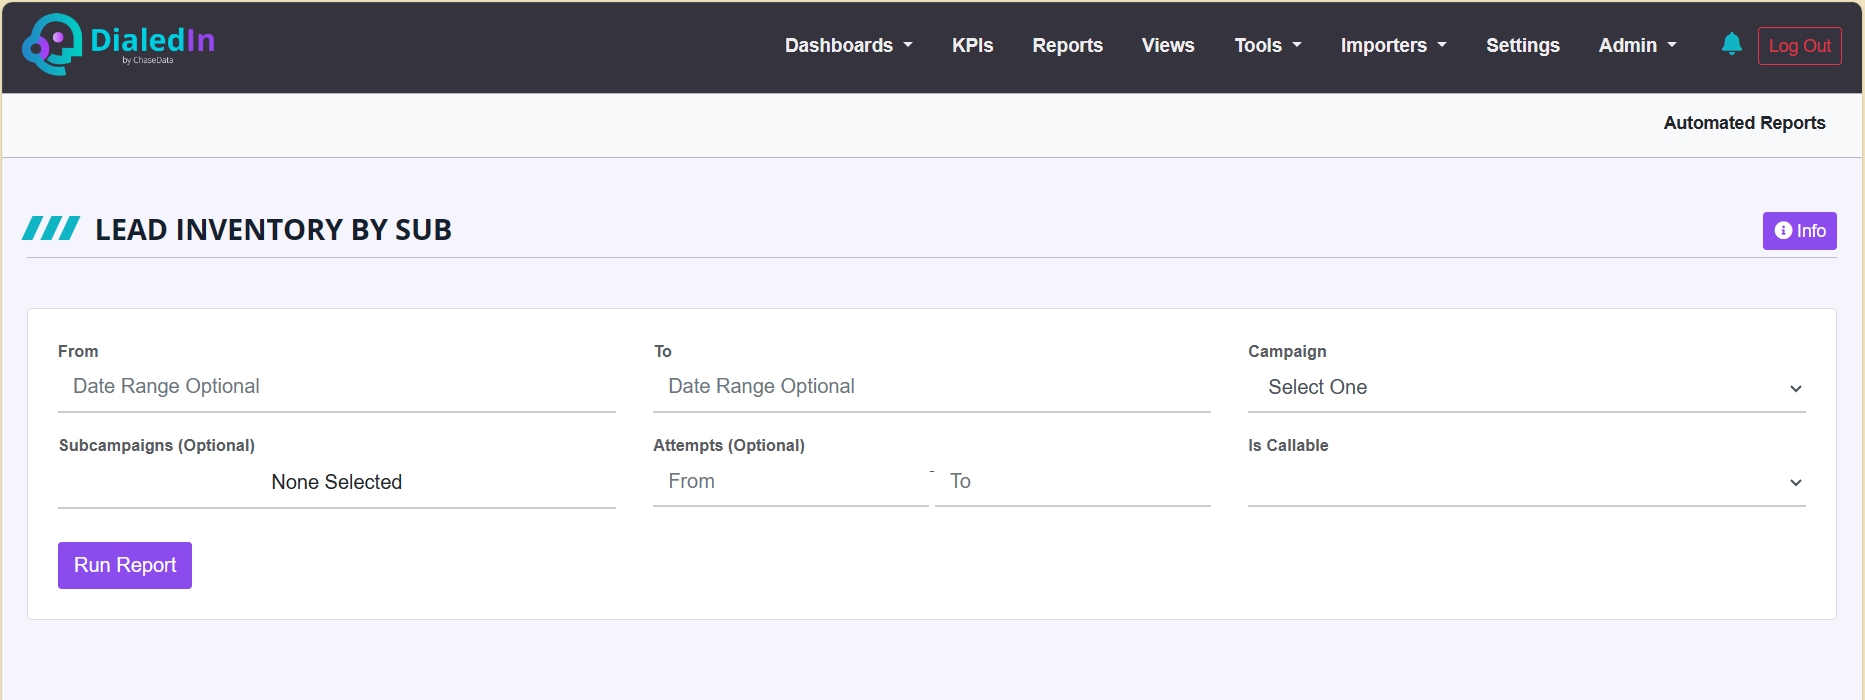
The table results include the following columns:
Subcampaign |
Dialing Subcampaign |
|---|---|
Result Codes |
Description of Call Disposition |
Type |
Indicates if the Call Made a Connection, Contact, etc. |
Count |
Number of Calls |
Lead NPA
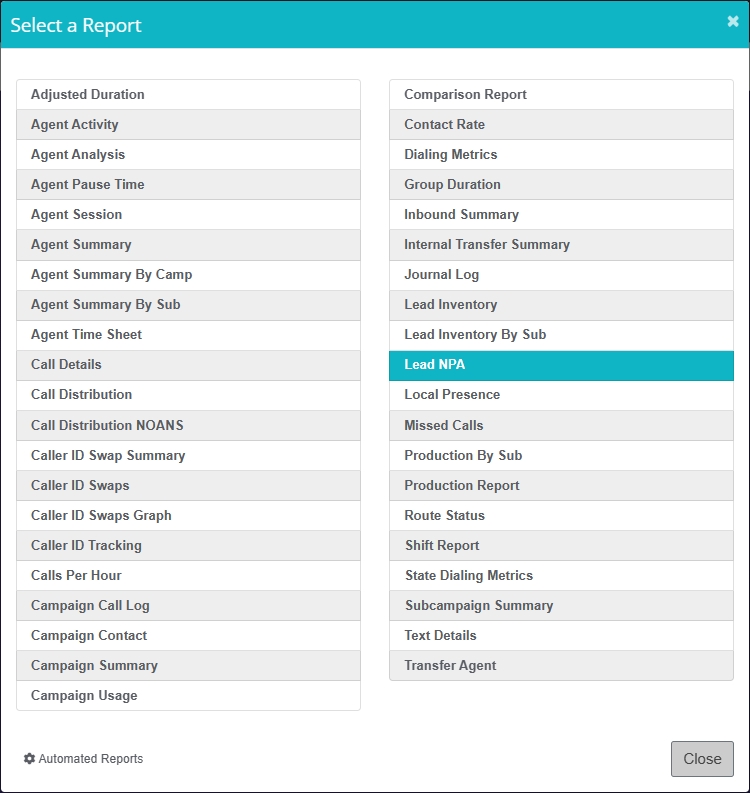
This report gives a count by NPA (area code) of every outbound call for the date range, and every lead, regardless of import date. If "Include Owned NPAs" is selected, then the recommended DIDs will be adjusted accordingly.
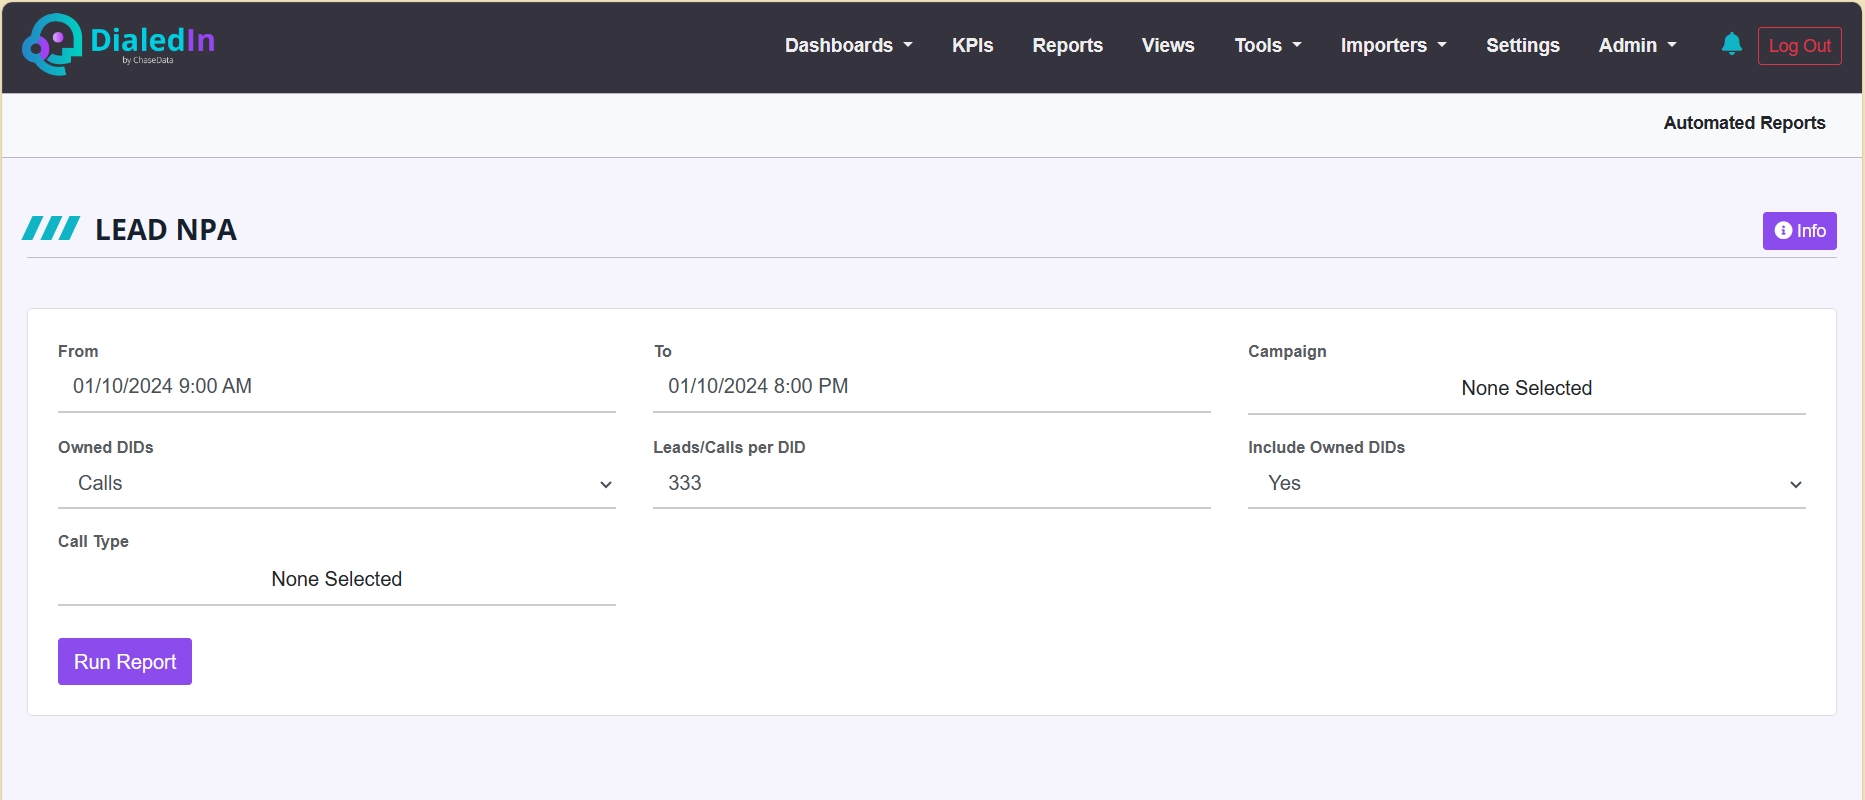
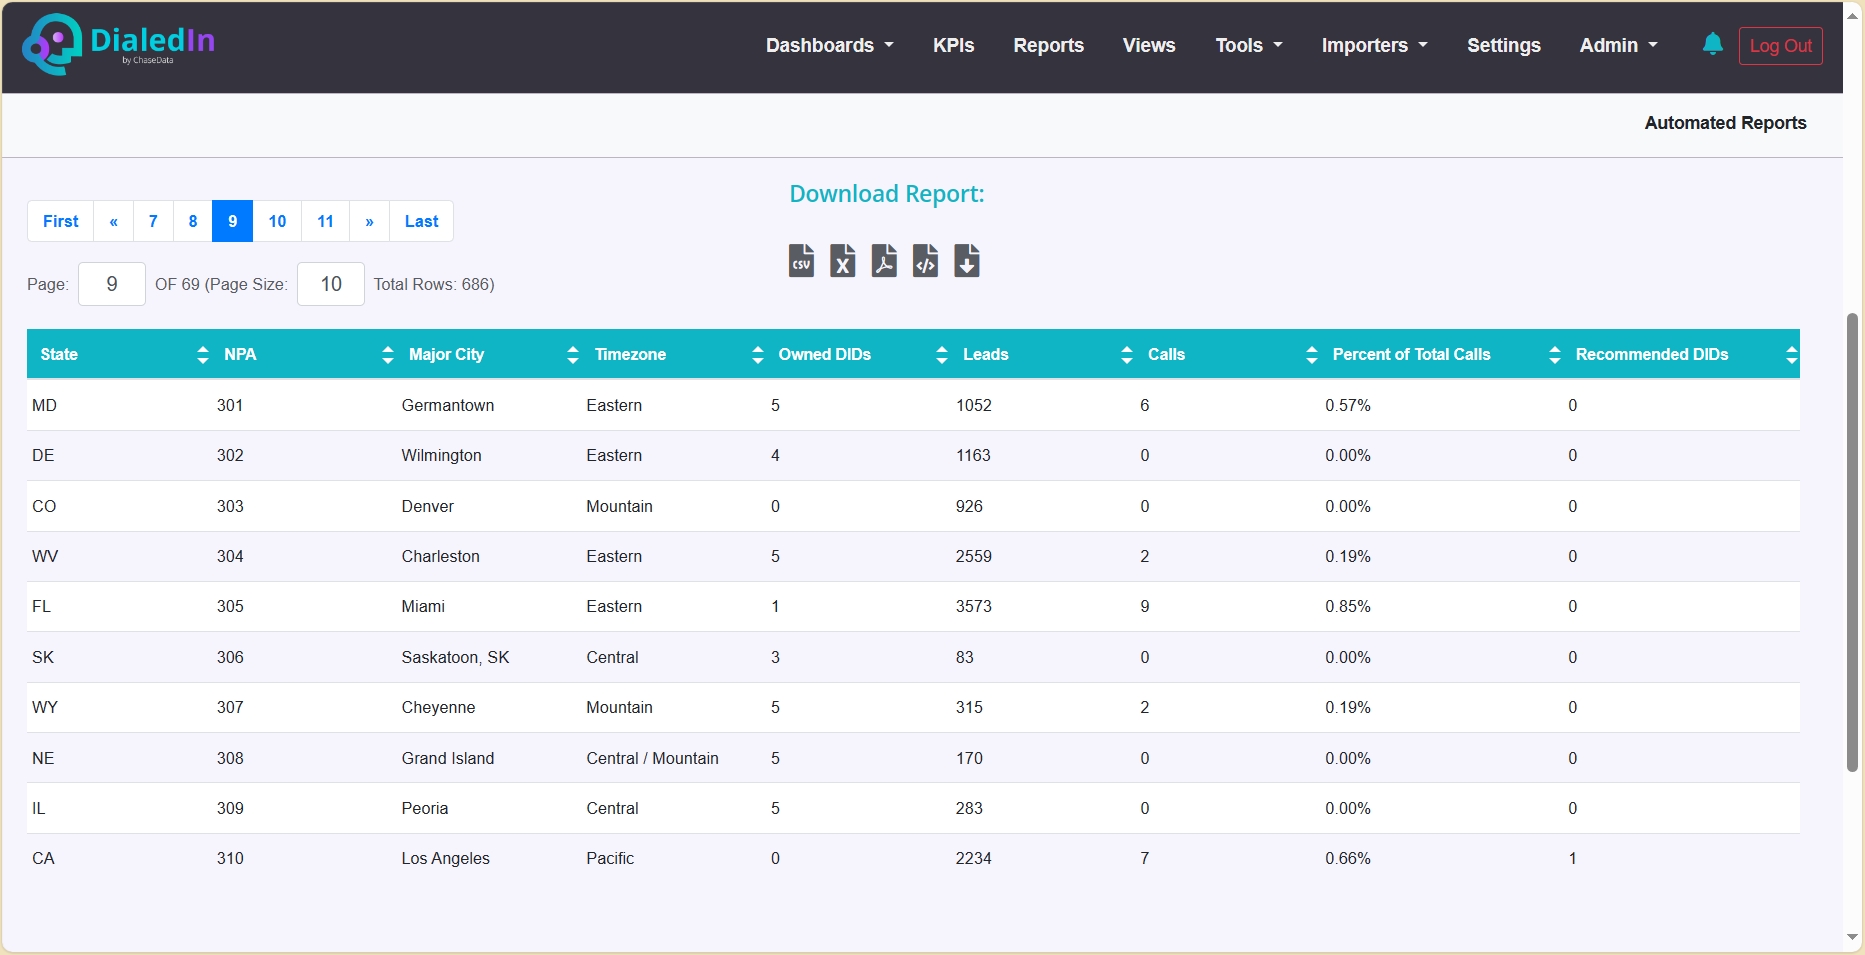
The table results include the following columns:
State |
The state to which the corresponding NPA belongs |
|---|---|
NPA |
Area code of the numbers called |
Major City |
Key identifying city covered by the area code |
Timezone |
Time zone of location for the area code |
Owned DIDs |
Number of Owned DIDs for the NPA (area code) |
Leads |
Number of leads with this NPA |
Calls |
Number of calls made to this NPA |
Percent of Total Calls |
Percentage of the Total Calls made to this NPA |
Recommended DIDs |
Recommended number of DIDs to add |
Local Presence
This is an internal report for use by DialedIn Support only
Missed Calls
This report lists all inbound calls that were abandoned or sent to voicemail during the date range, along with the most recent call from that number along with that call's disposition.
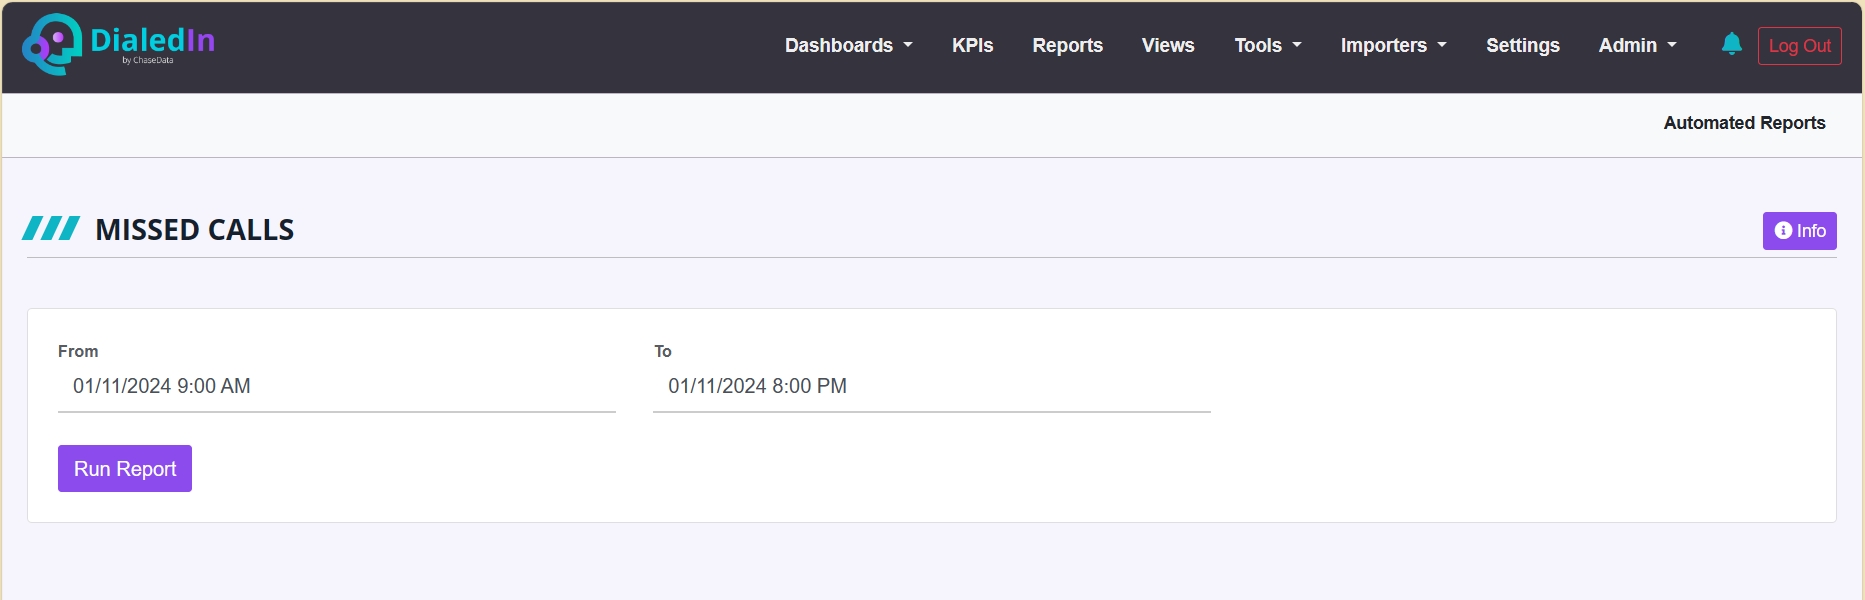
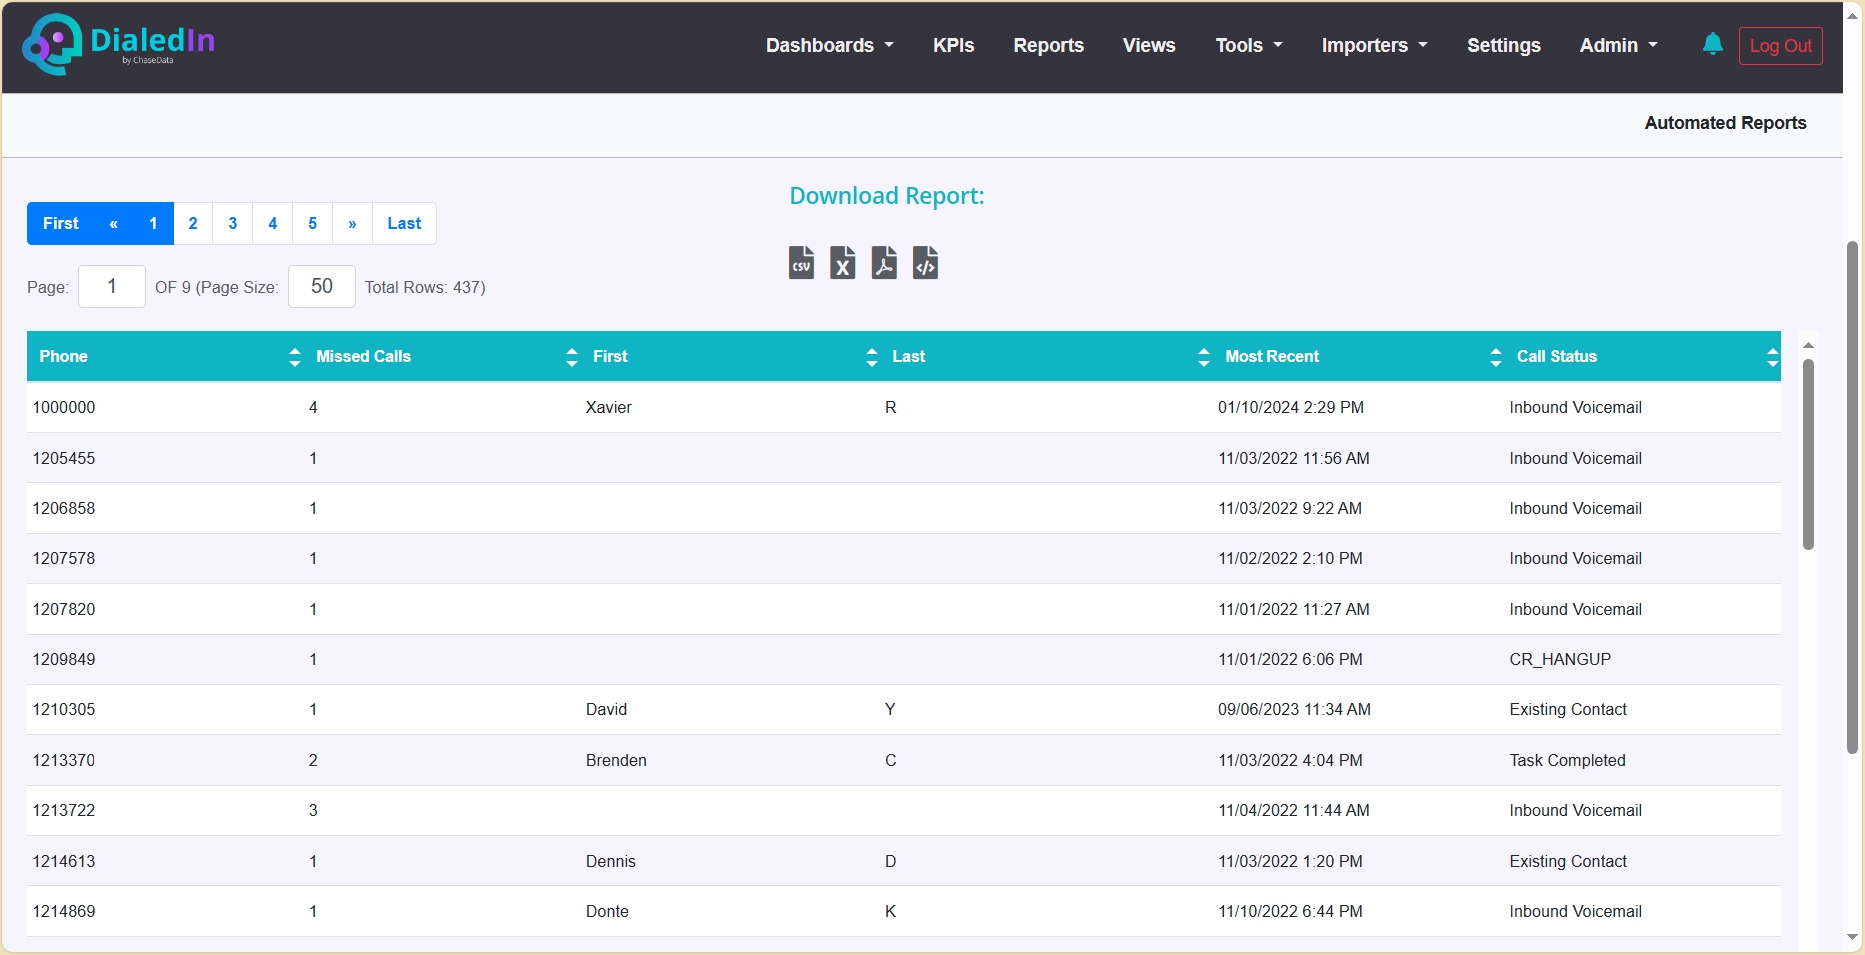
The table results include the following columns:
Phone |
Phone number of missed call |
|---|---|
Missed Calls |
Number of calls missed |
First |
Corresponding Lead First Name |
Last |
Corresponding Lead Last Name |
Most Recent |
Most Recent Date/Time Called |
Call Status |
Disposition of Call |
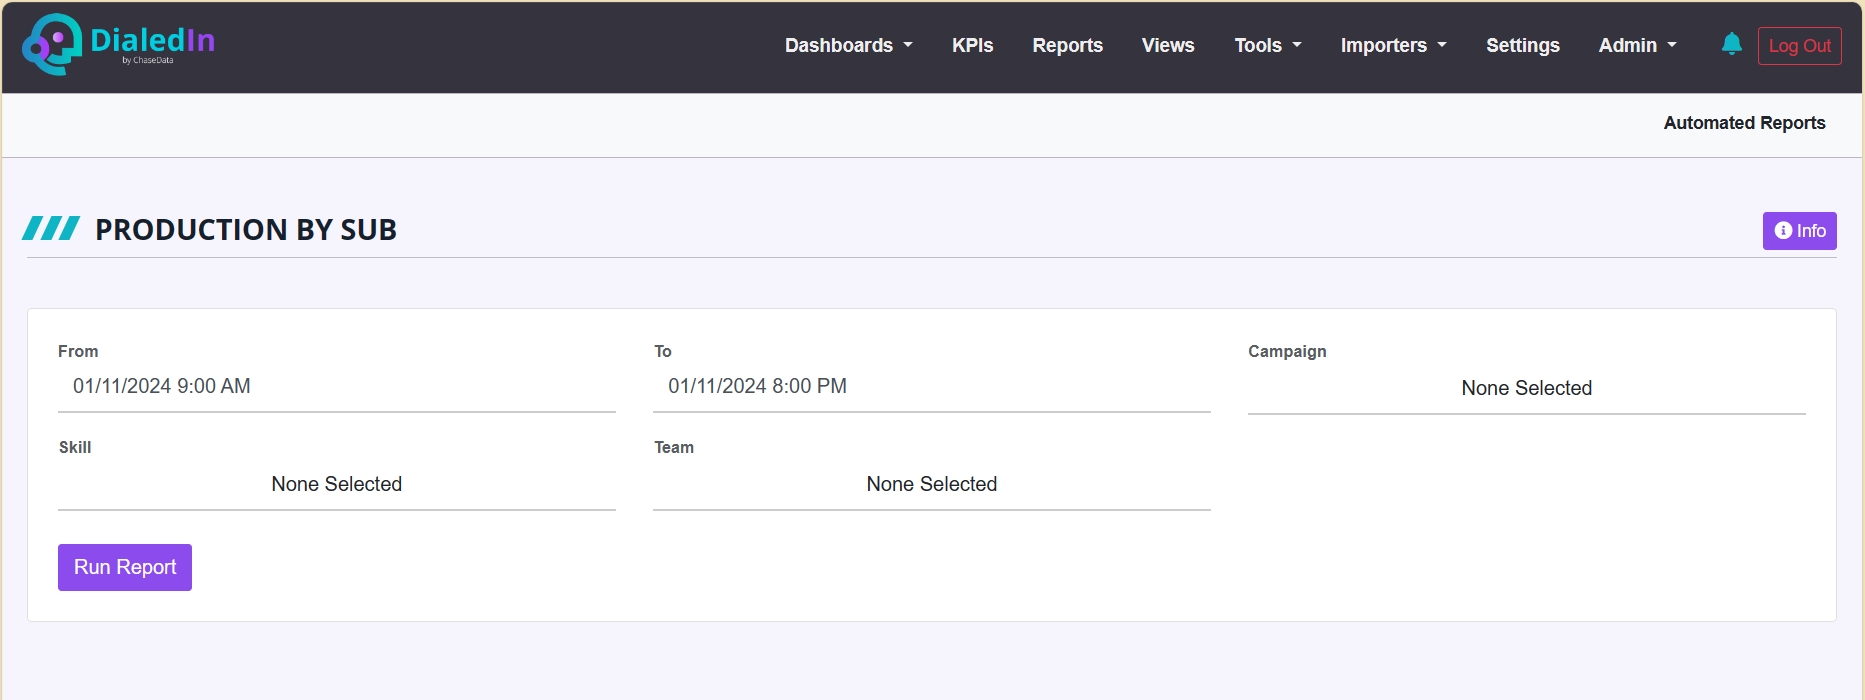
Production By Sub
This report summarizes calls by sub-campaign during the date range.
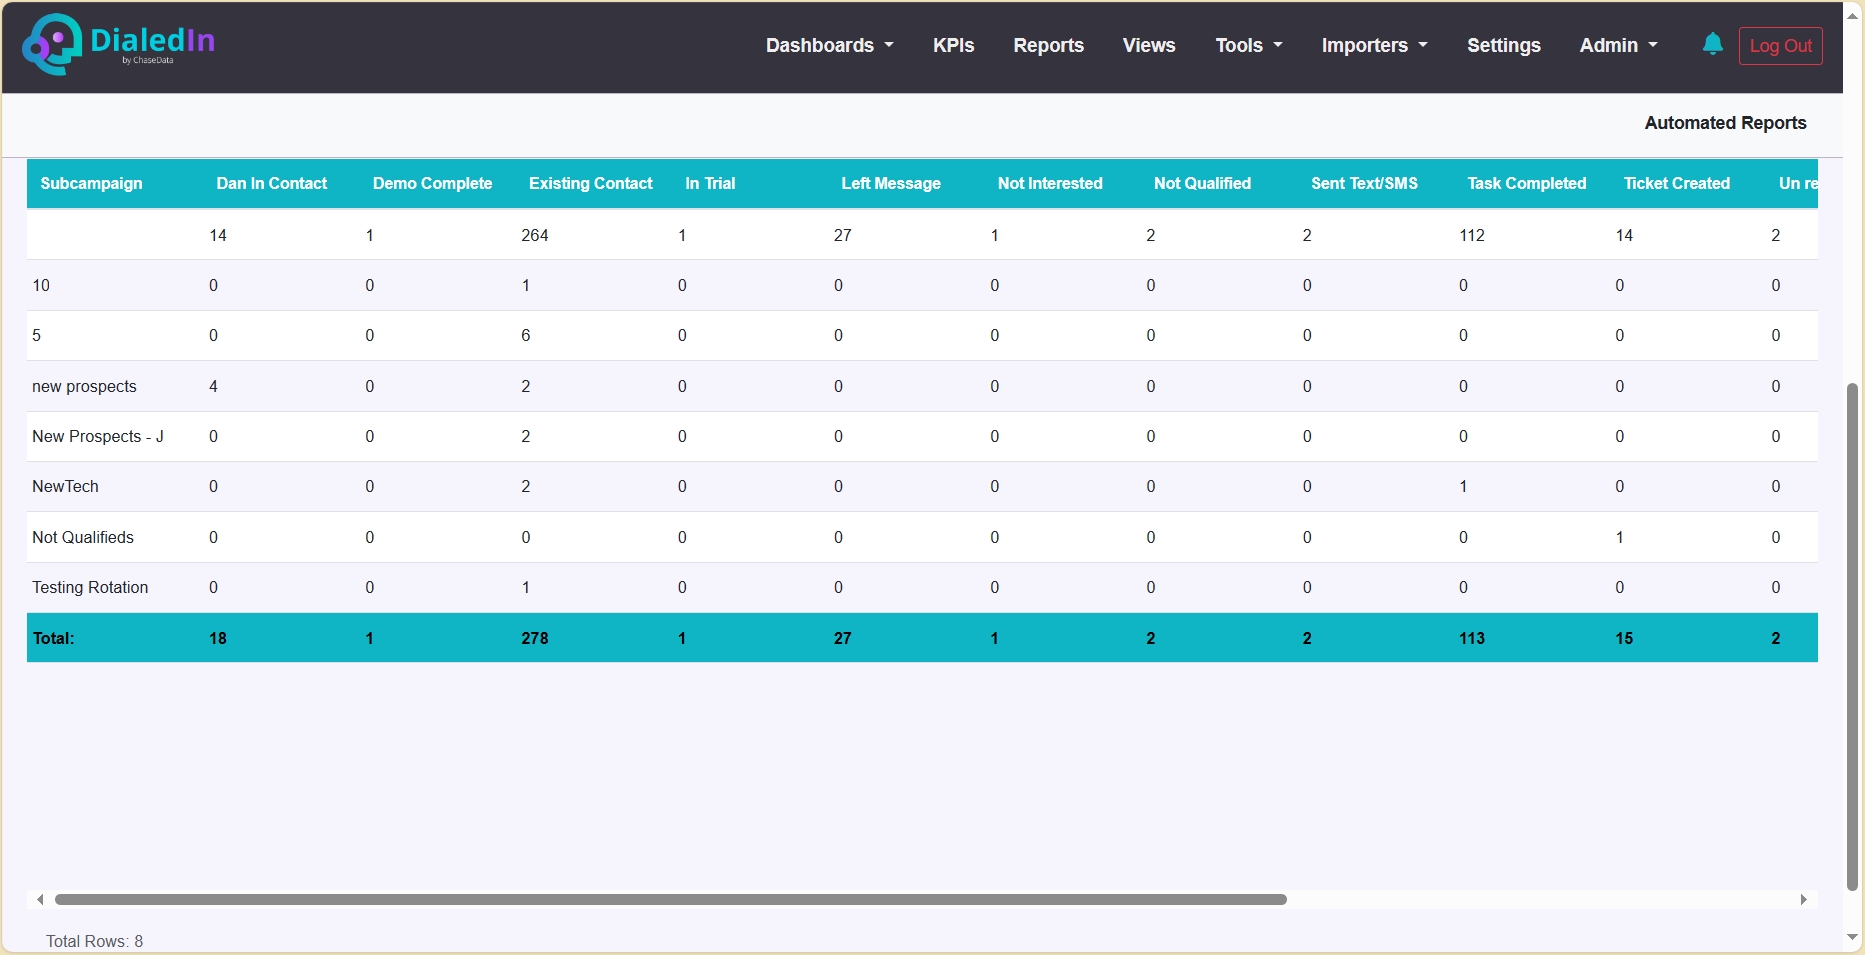
The table results include the following columns (there is also a column for each custom call disposition, in addition to the standard columns listed here):
Subcampaign |
Dialing Sub-campaign |
|---|---|
Connects |
Number of calls that connected. This is determined by the disposition type on the wrap up code. |
Contacts |
Number of calls where contact was made. This is determined by the disposition type on the wrap up code. |
Sales |
Number of calls with Sales/Leads/App call status. This is determined by the disposition type on the wrap up code. |
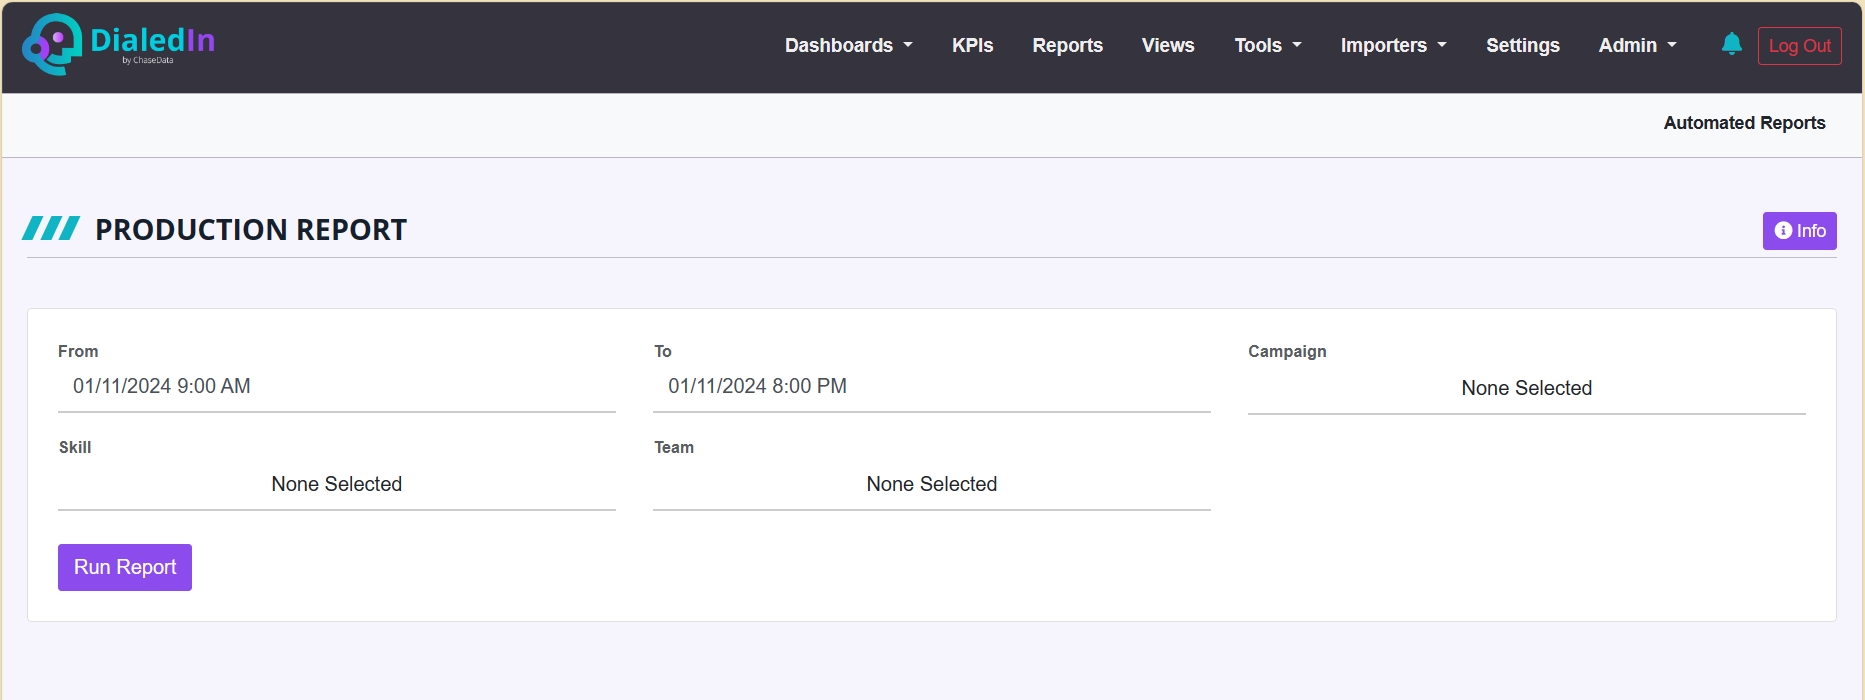
Production Report
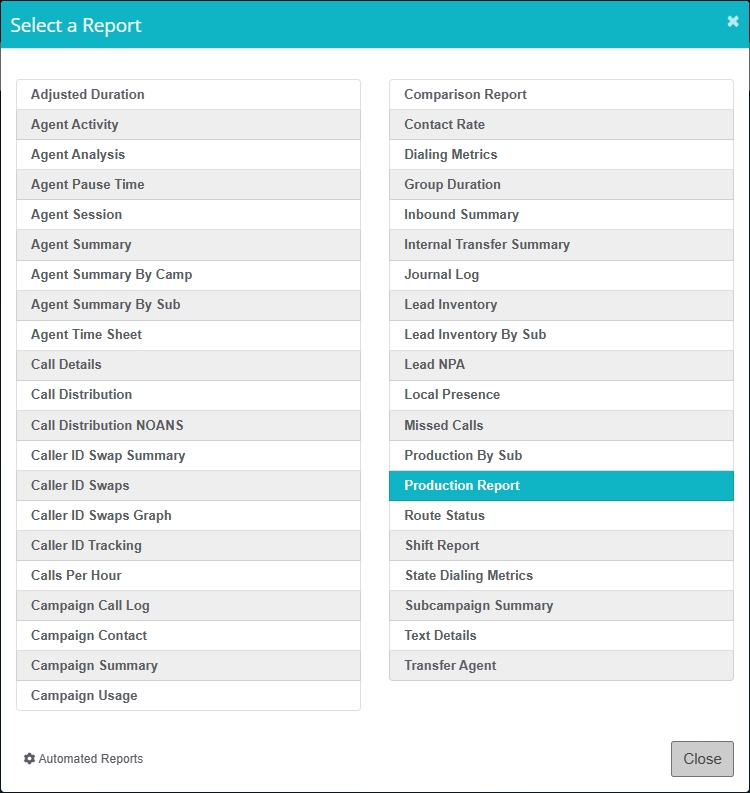
This report summarizes calls by an agent during the date range.
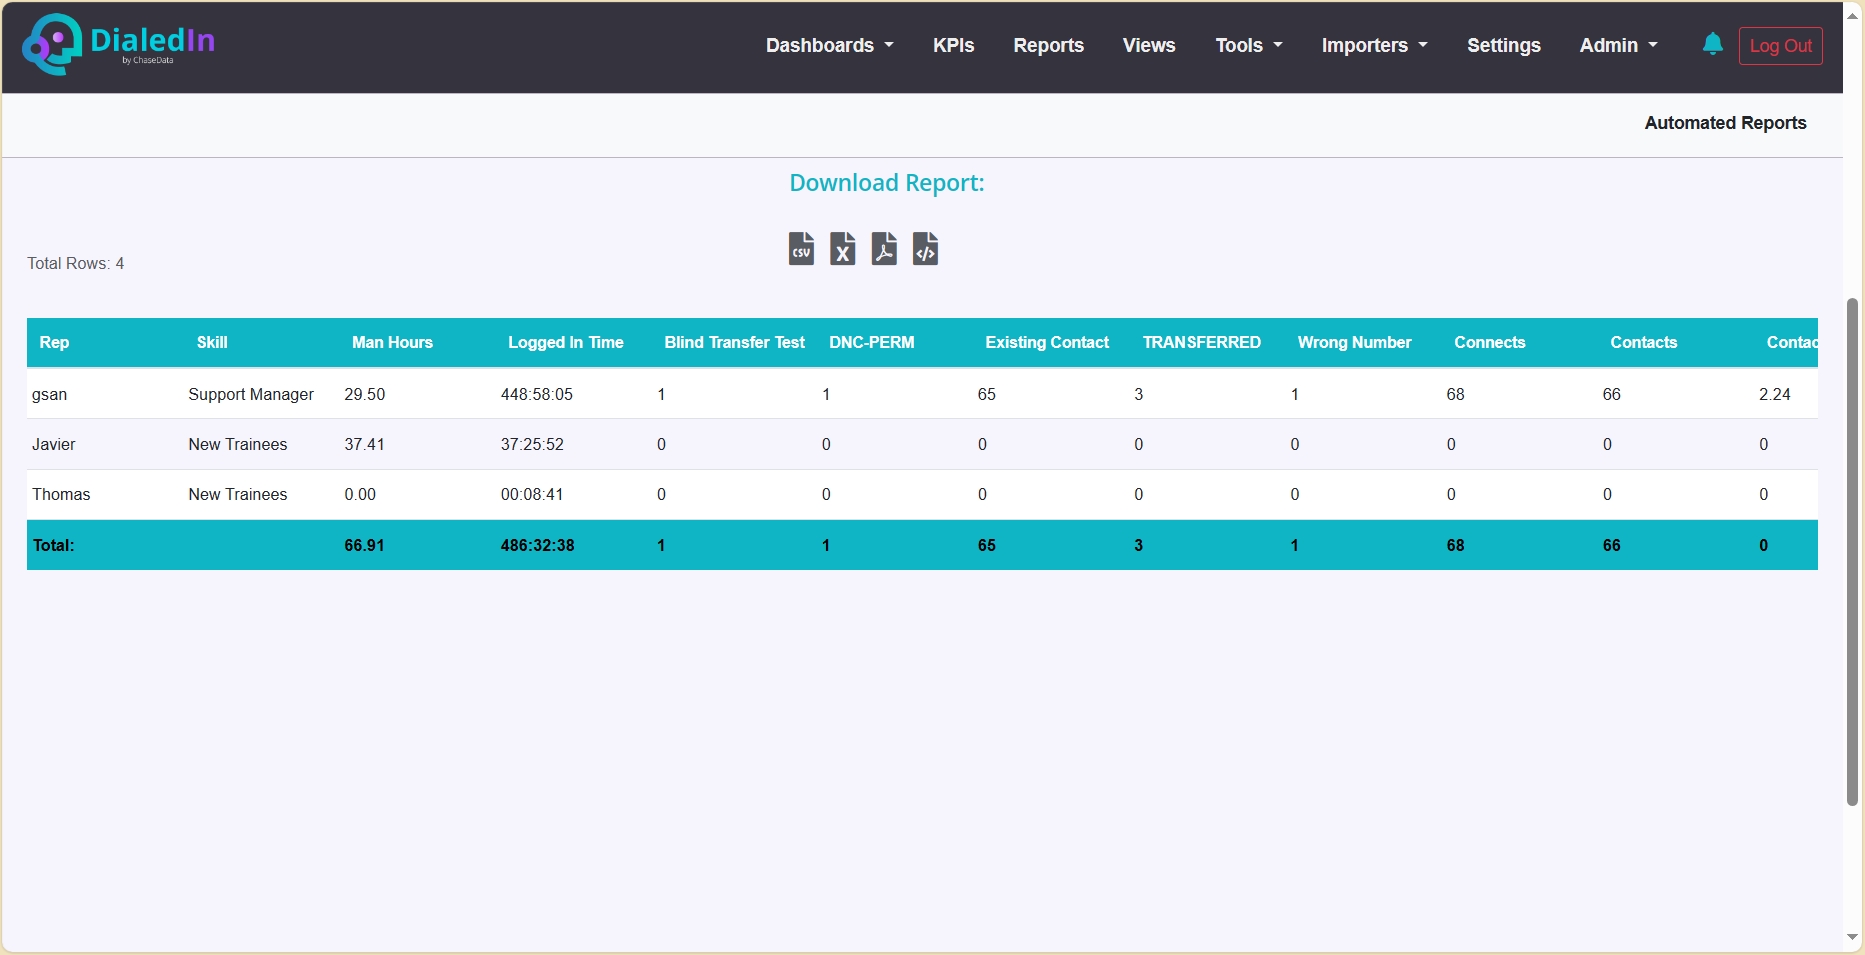
The table results include the following columns (there is also a column for each custom call disposition, in addition to the standard columns listed here):
Rep |
Agent login name |
|---|---|
Skill |
Agent skill |
Man Hours |
The total logged in time minus the time spent on paused status |
Logged In Time |
Total Time that agent was Logged In |
Connects |
Number of calls that connected. This is determined by the disposition type on the wrap up code. |
Contacts |
Number of calls where contact was made. This is determined by the disposition type on the wrap up code. |
Contacts/ManHour |
Number of Contacts per Man-Hour |
Sale/Lead/App |
Number of calls with Sales/Leads/App call status. This is determined by the disposition type on the wrap up code. |
Sales/ManHour |
Number of Sales per Man-Hour |
Route Status
This is an internal report for use by DialedIn Support only
Shift Report
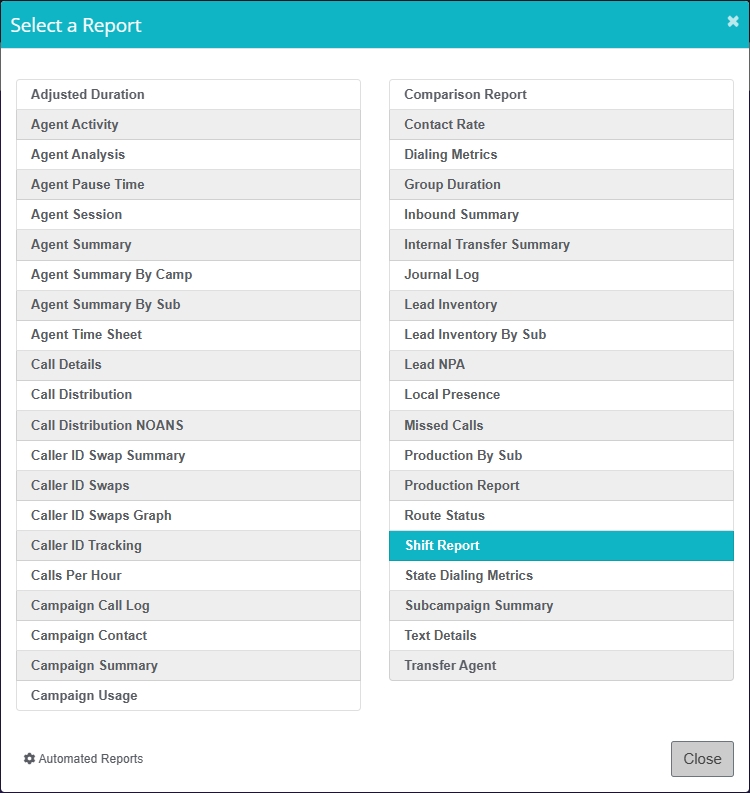
This report summarizes outbound calls by campaign for the specified date range. It provides totals of call dispositions and whether they made a connection or contact.
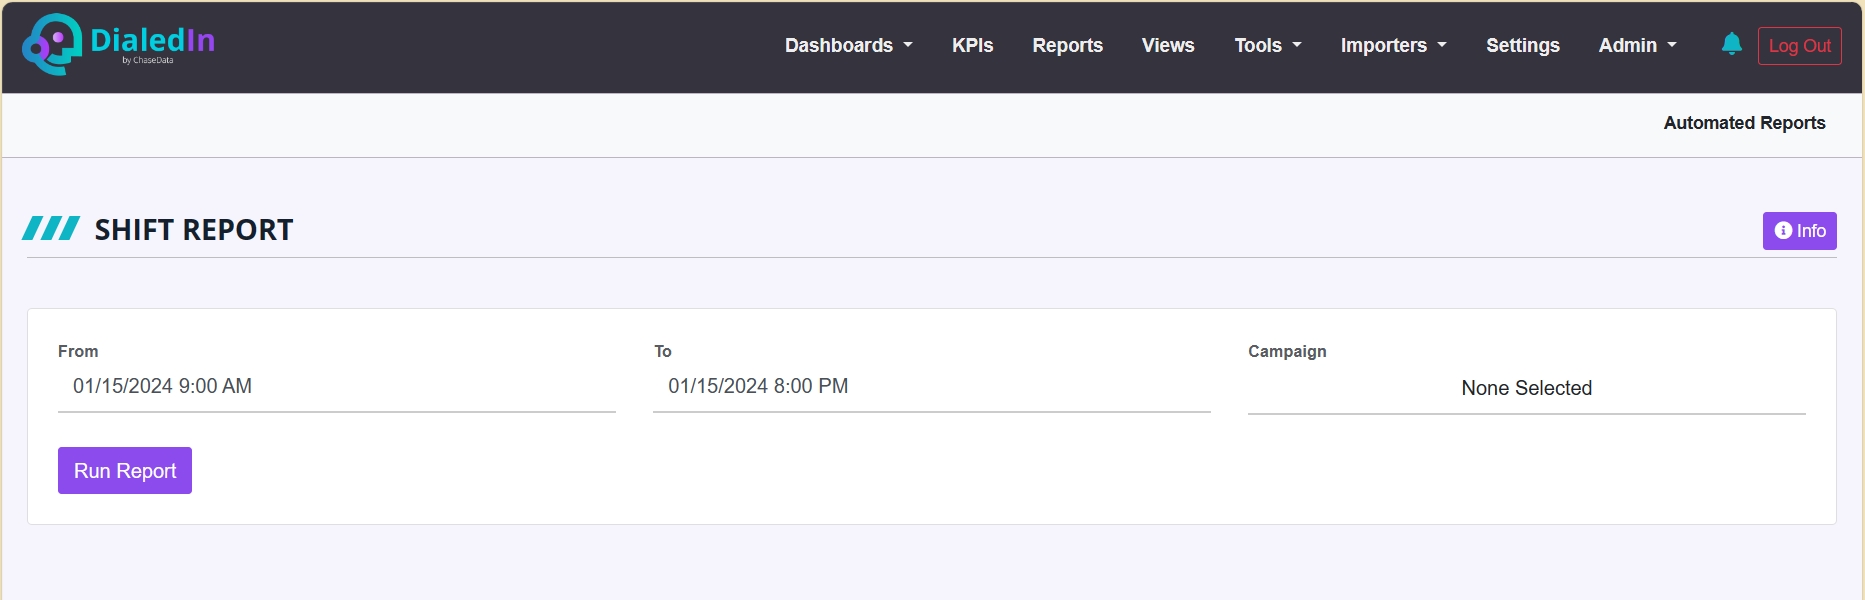
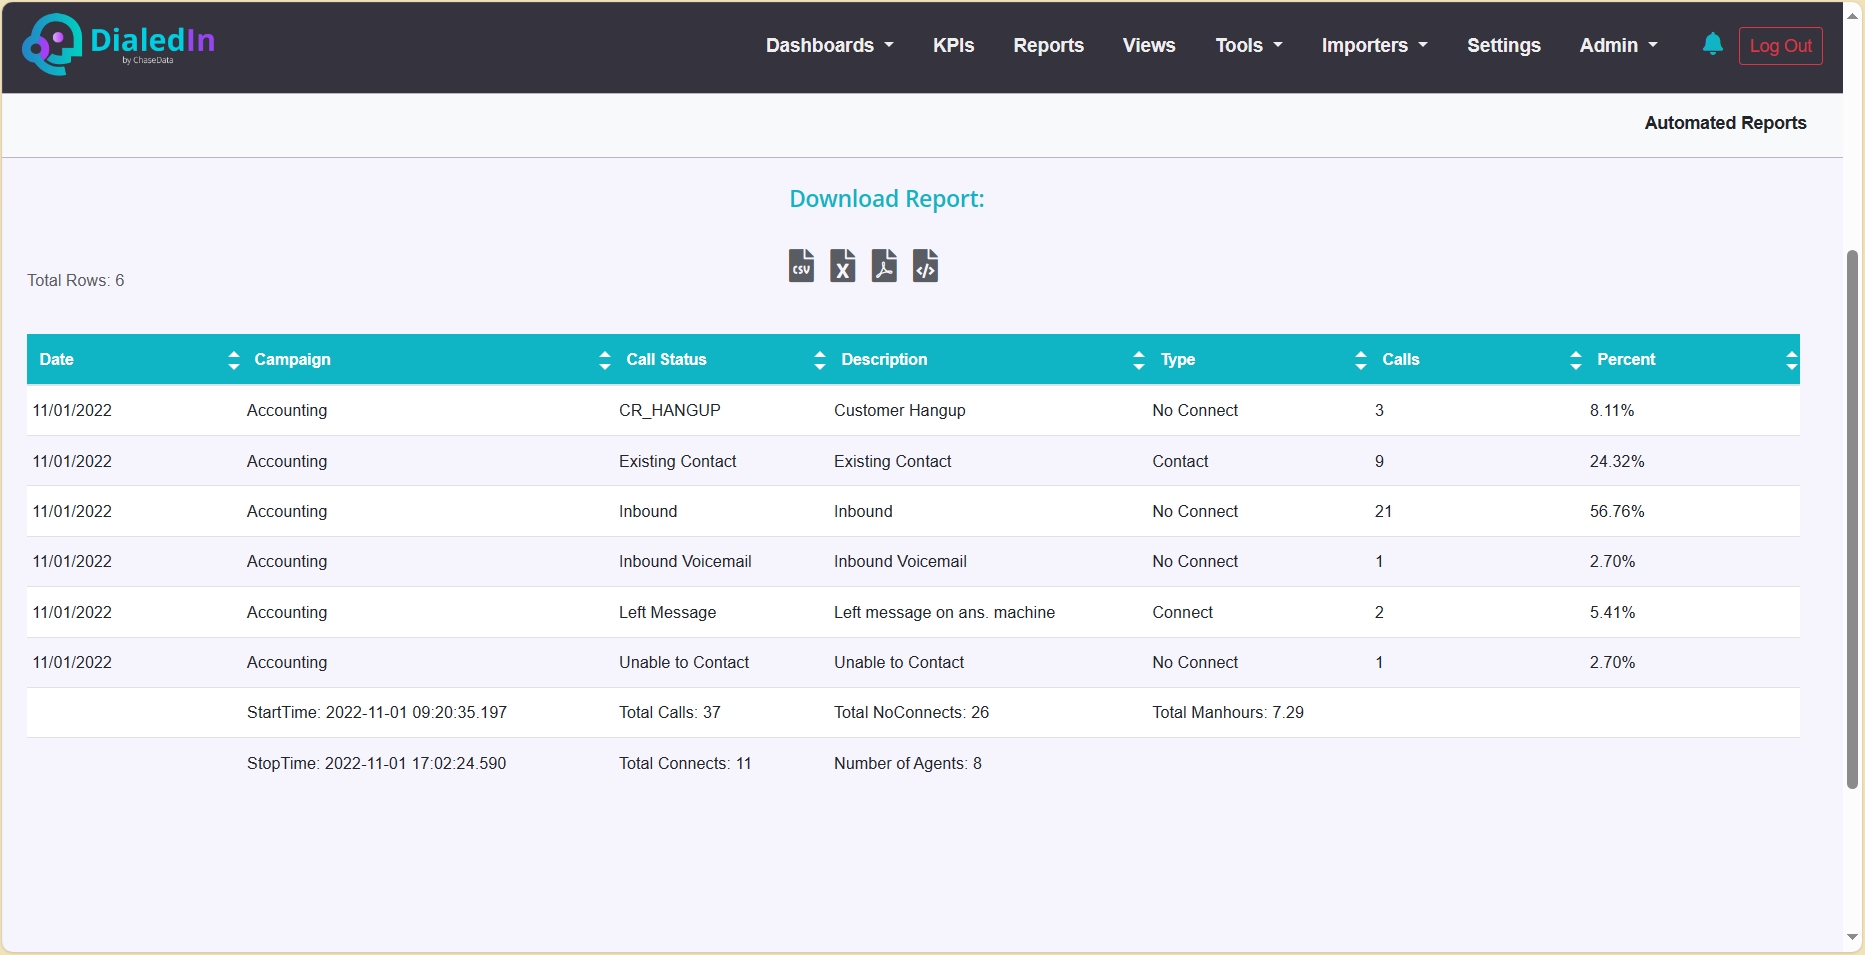
The table results include the following columns (summarized for every campaign):
Date |
Date of Event or Call |
|---|---|
Campaign |
Dialing Campaign |
Call Status |
Disposition of Call |
Description |
Ring Group Description |
Type |
Disposition type - Indicates if the Call Made a Connection, Contact, etc. |
Calls |
Number of Calls |
Percent |
Percentage of calls with this call status (among all calls for the applicable campaign) |
Skipped Leads
This report lists all leads that were skipped by the agent.
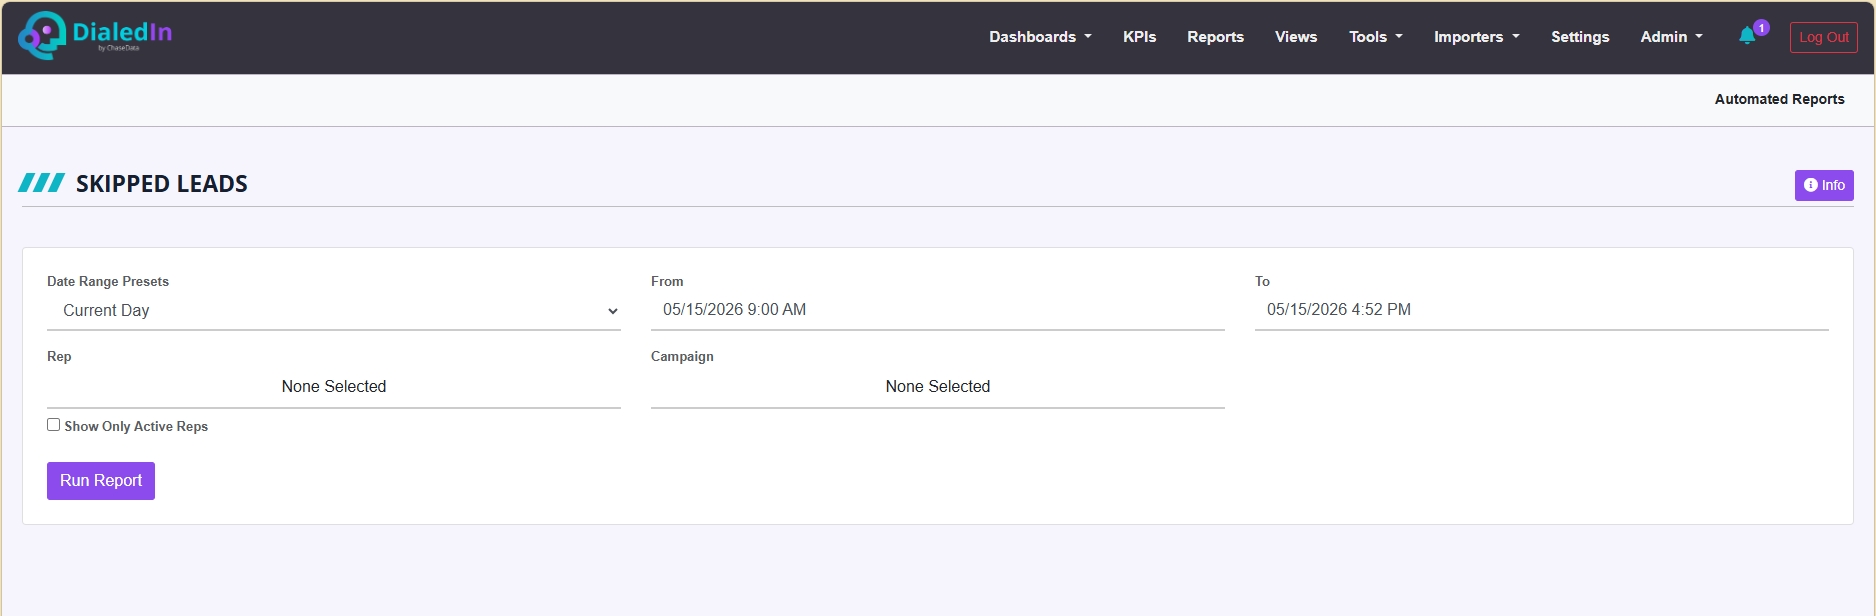
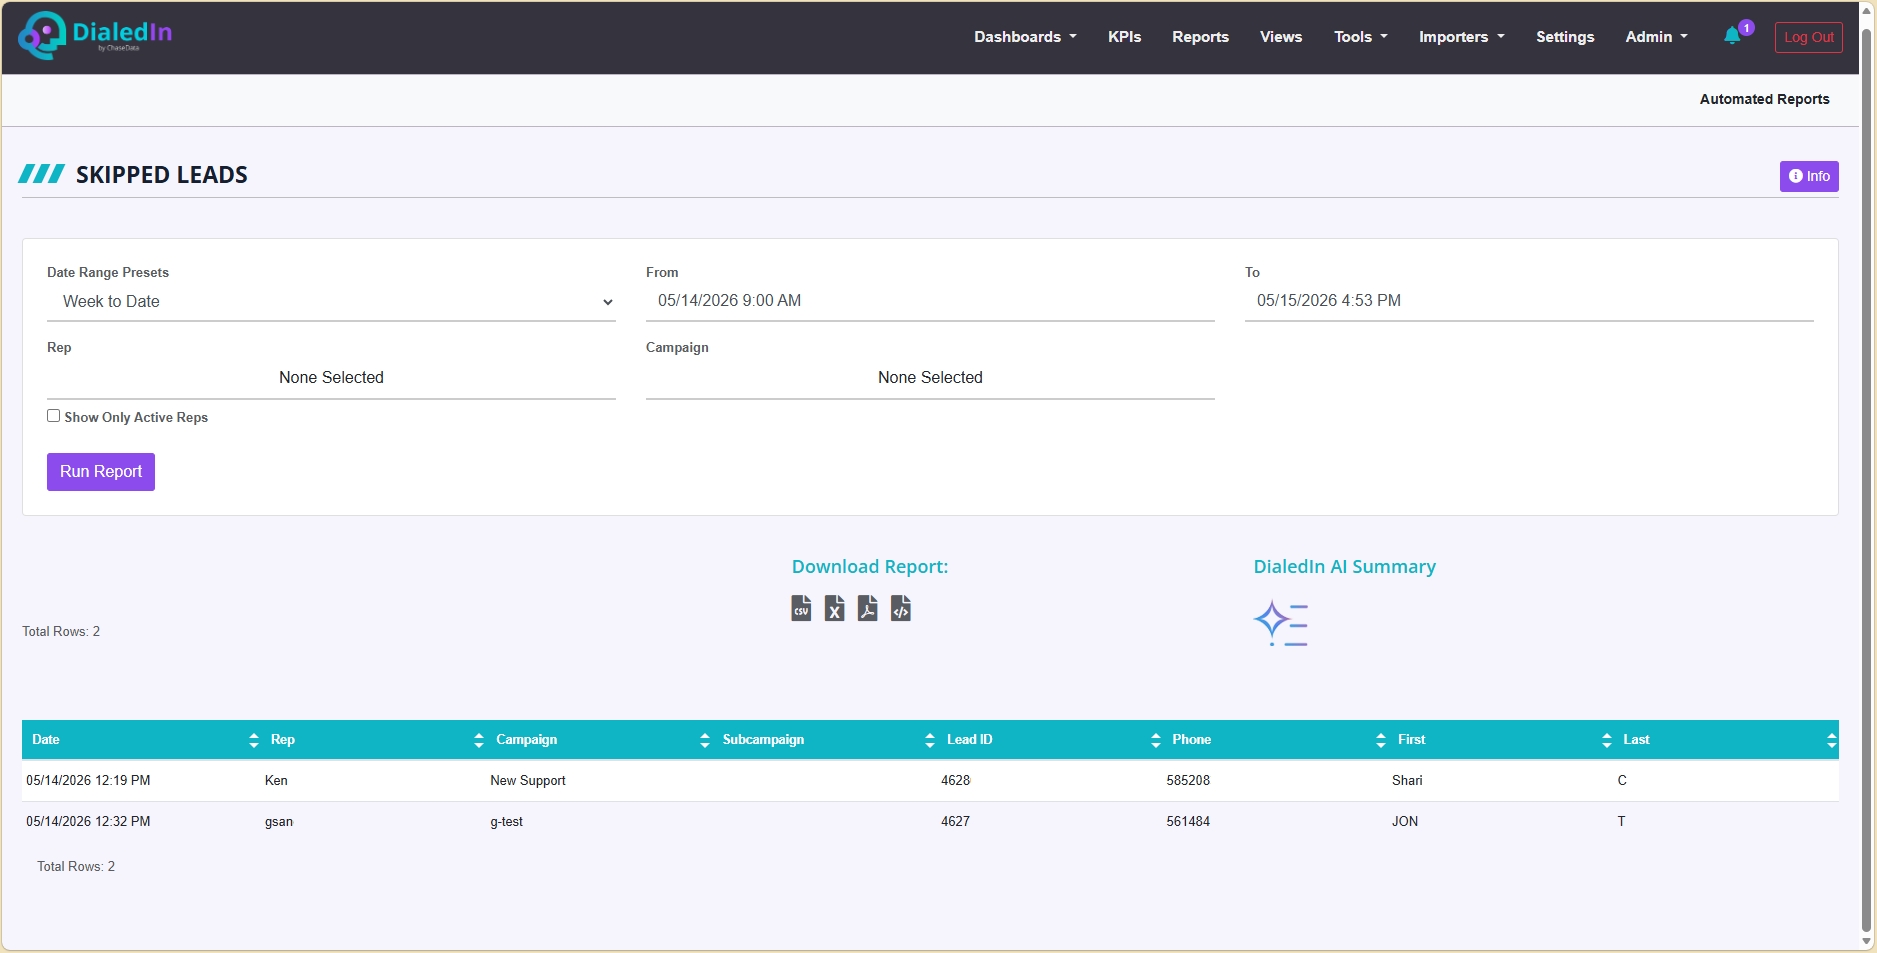
The table results include the following columns:
Date |
The date and time when the event or call took place |
|---|---|
Rep |
The agent's login identifier |
Campaign |
The Campaign involved in the call |
Subcampaign |
The Sub-campaign involved in the call |
Lead ID |
The lead ID of the lead's record for the phone number |
Phone |
The number of the lead or contact that was transferred |
First |
The First Name in the lead's record for the phone number |
Last |
The Last Name in the lead's record for the phone number |
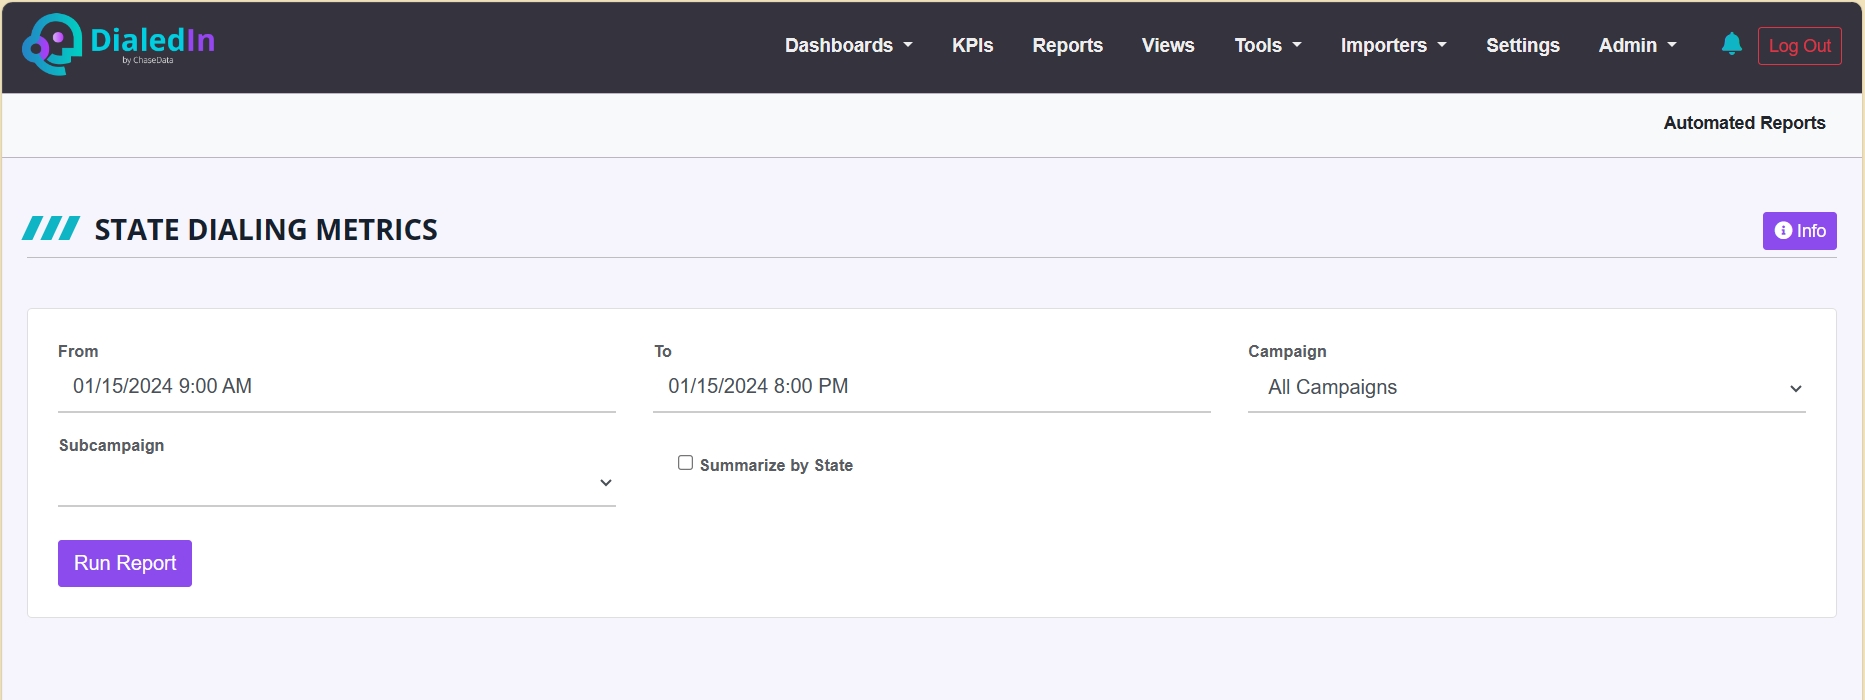
State Dialing Metrics
This report shows connect rates by area code for all outbound-type calls. A call is considered connected based on agent type dispositions rather than system type.
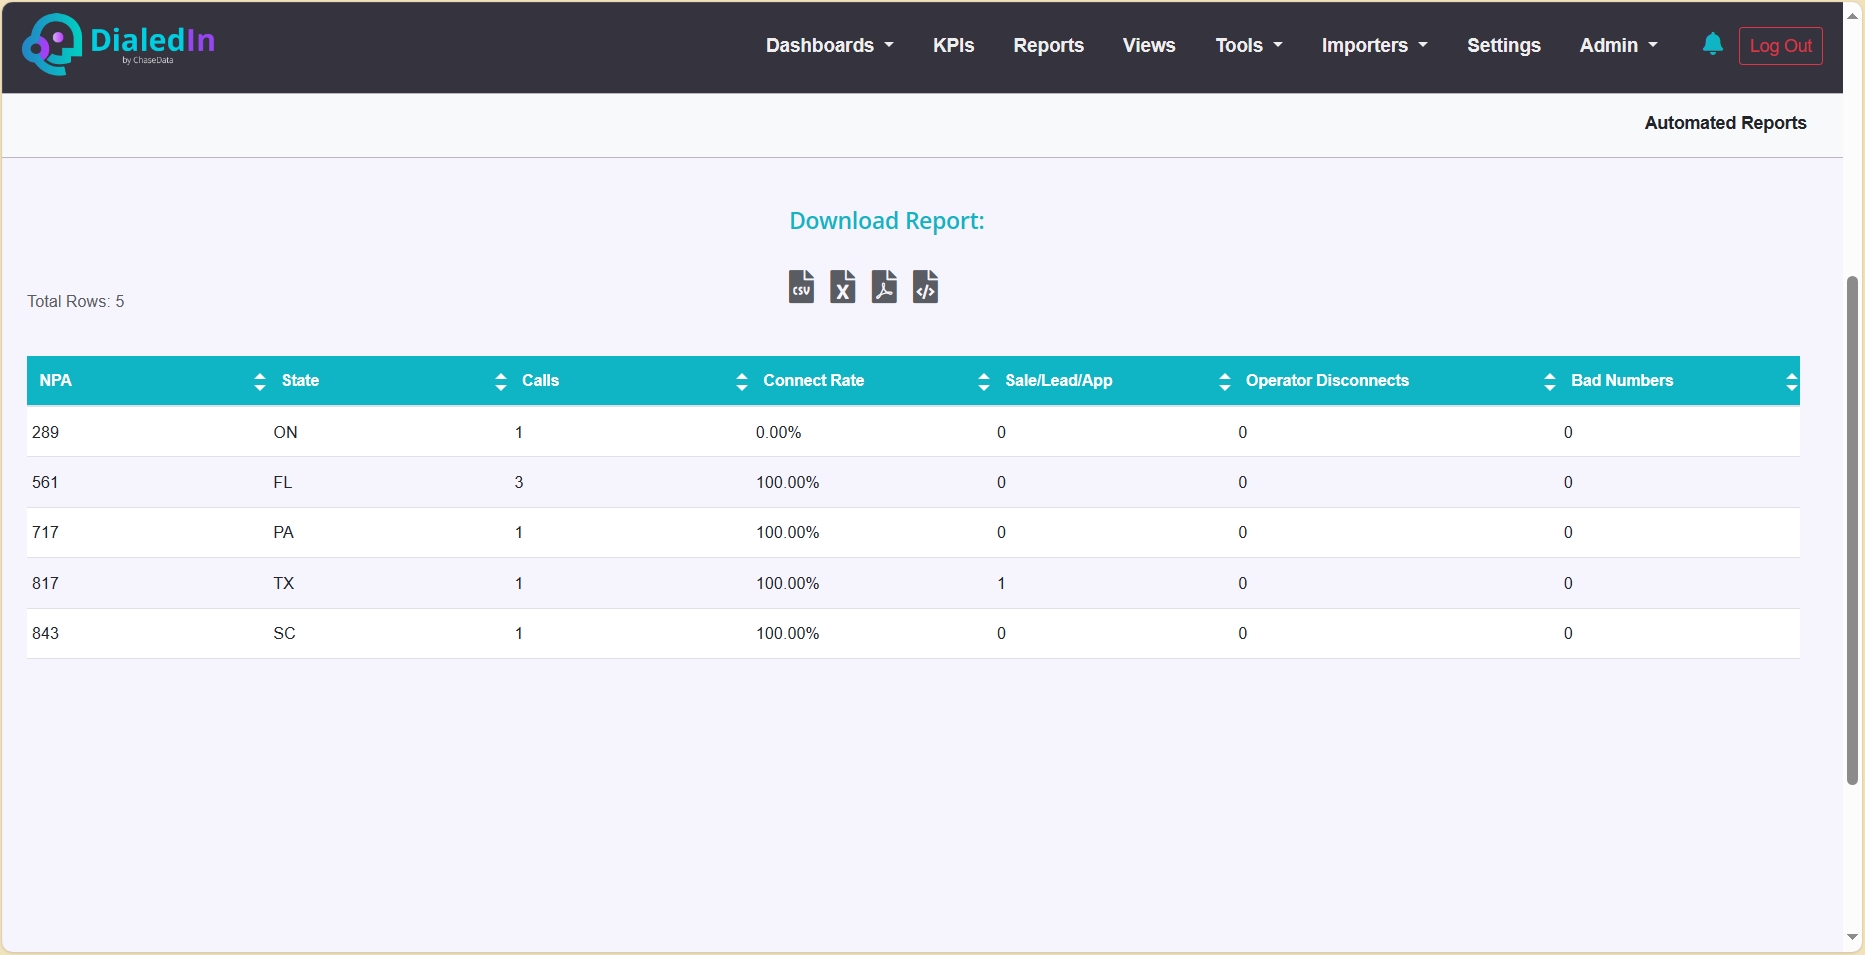
The table results include the following columns:
NPA |
Area Code |
|---|---|
State |
State where the NPA resides |
Calls |
Number of Calls |
Connect Rate |
Ratio of Connects Based on System Status per Dials |
Sale/Lead/App |
Sales/Leads/App call status. This is determined by the disposition type on the wrap up code. |
Operator Disconnects |
Calls with a CR_CEPT status (Operator Intercept) |
Sub-campaign Summary
This report summarizes campaign/sub-campaign activity for the specified date range.
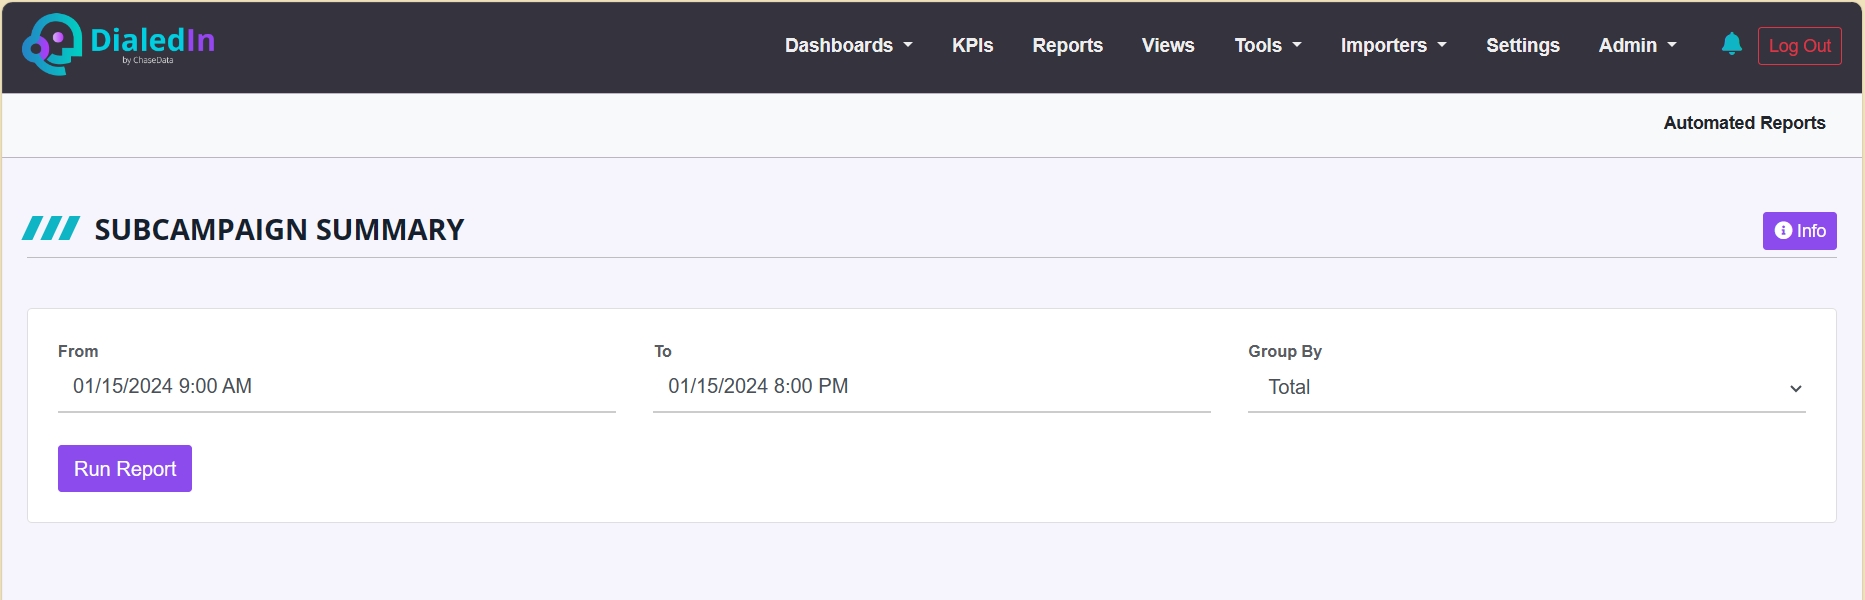
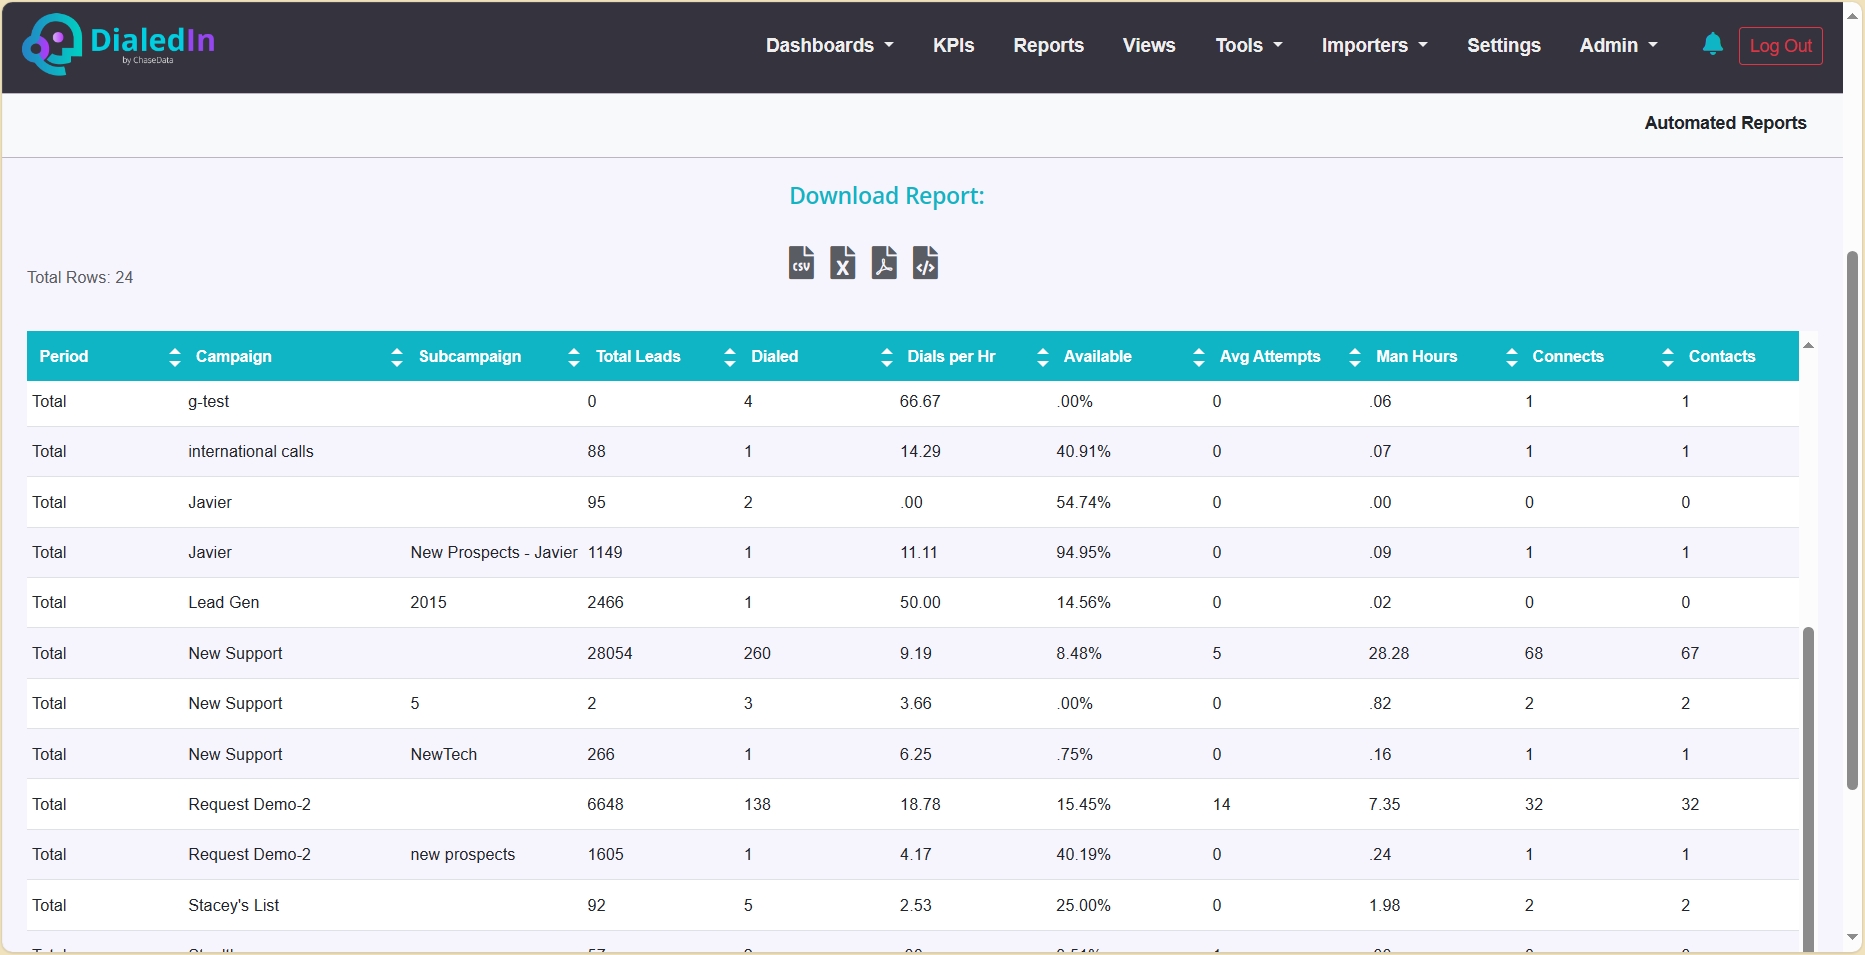
The table results include the following columns:
Period |
The period start date for the period length specified under ‘Group By’ |
|---|---|
Campaign |
The dialing campaign |
Subcampaign |
The specific sub-campaign under Campaign |
Total Leads |
Total Number of Leads |
Dialed |
Total Dial Attempts |
Dials per Hr |
Dials per Hour |
Available |
Number of Callable Leads |
Avg Attempts |
Average Attempts on Leads in a campaign that has activity within the date range selected |
Man Hours |
This is the total logged-in time minus the time spent on paused status |
Connects |
Calls that connected. This is determined by the disposition type on the wrap up code |
Contacts |
Calls where contact was made. This is determined by the disposition type on the wrap up code |
CPH |
Connects Per Hour; the total number of connects divided by the total hours worked |
Sale/Lead/App |
Sales/Leads/App call status, determined by the disposition type for the corresponding wrap up code |
S-L-A/HR |
Total Sales/Leads/App dispositions divided by worked hours |
Connect Rate |
Ratio of Connects per Dial |
S-L-A Rate Value |
Dials per Sale |
Conversion Rate |
Ratio of Sales/Leads/App disposition divided by total contacts |
Conversion Factor |
Sales/Leads/App per Contact per hour |
Operator Disconnects |
Calls with a CR_CEPT status |
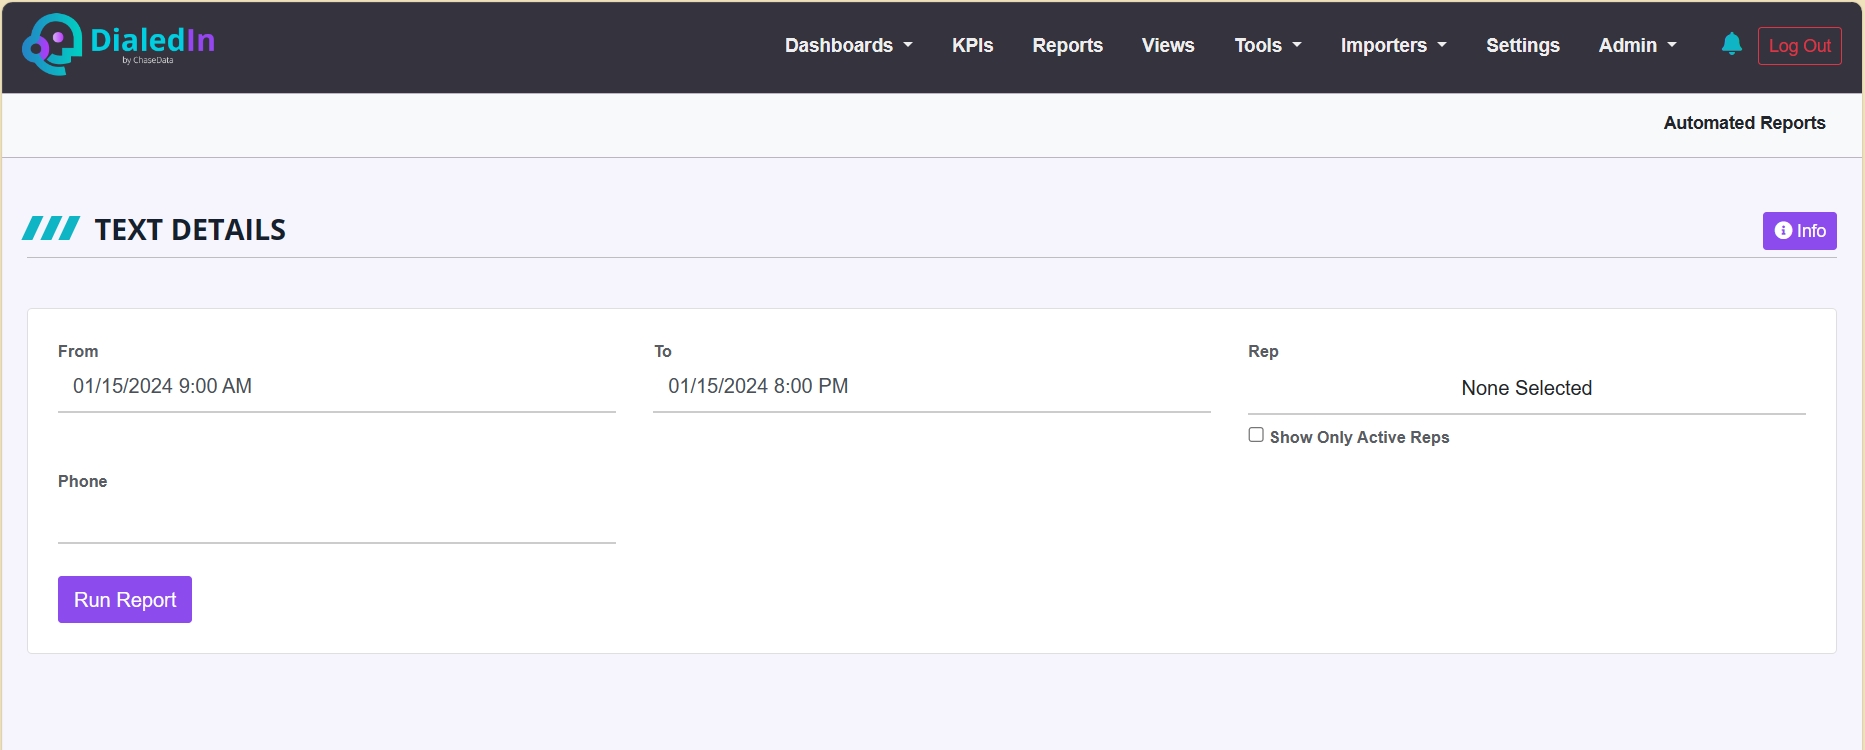
Text Details
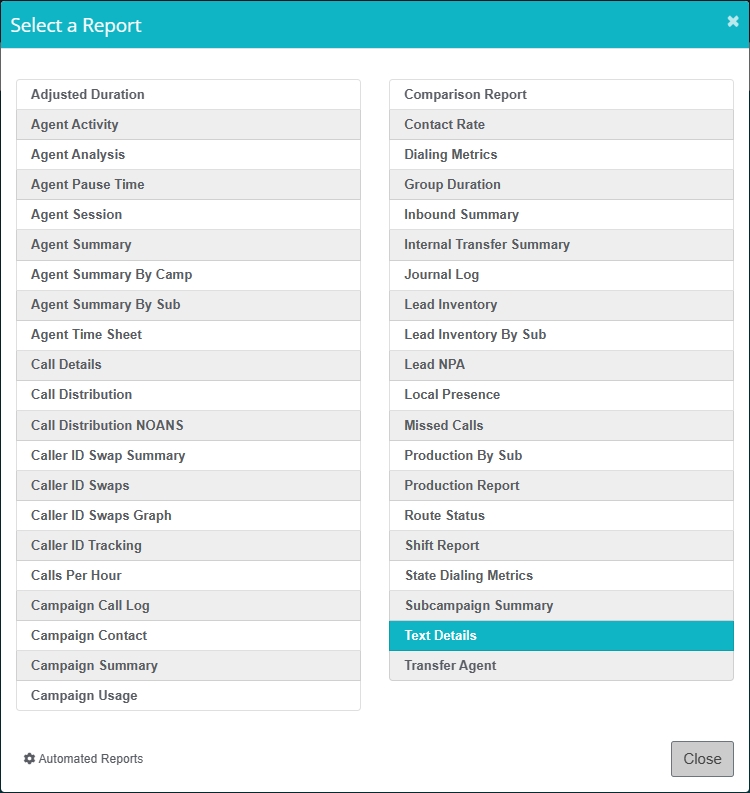
This report details each text message sent or received.
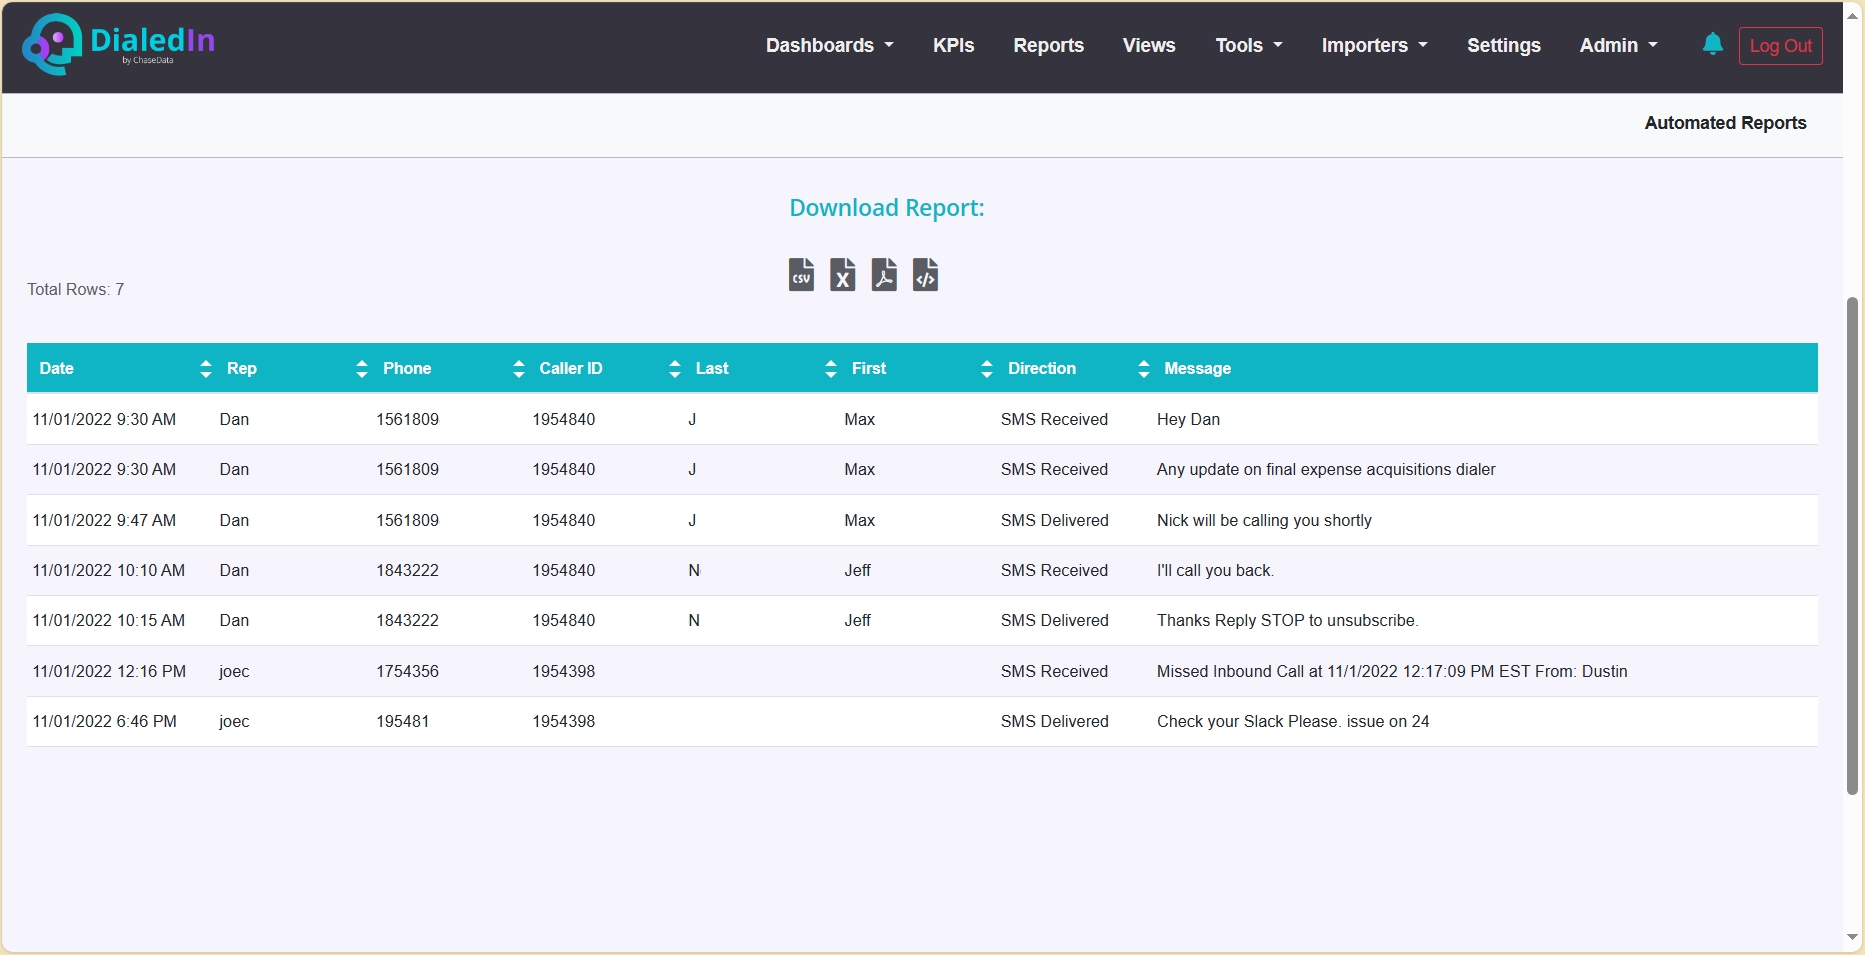
The table results include the following columns:
Date |
Date of Event or Call |
|---|---|
Rep |
Agent login name |
Phone |
Laed Phone Number |
Caller ID |
Caller ID associated with the Rep |
Last |
Lead Last Name |
First |
Lead First Name |
Direction |
Whether the message was Delivered or Received by the Rep |
Message |
Contents of the text message |
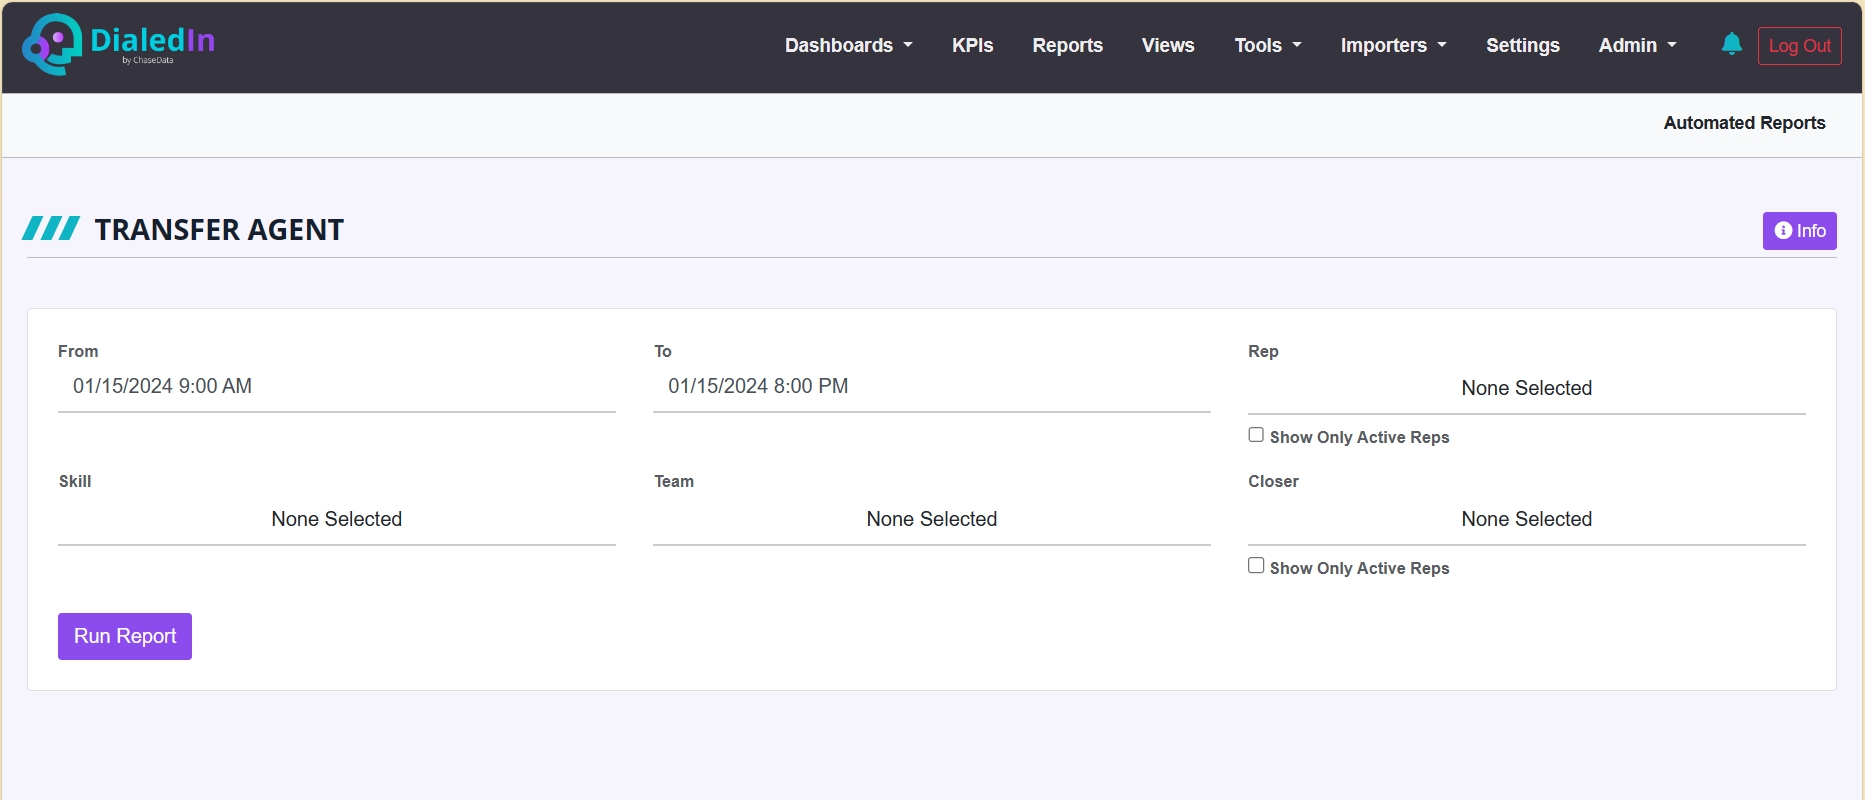
Transfer Agent
This report looks at all calls that were transferred from a Rep to a Closer, and how many of those calls turned into sales (based on call disposition).
The table results include the following columns:
Rep |
Agent login name (who initiated transfer) |
|---|---|
Closer |
Rep who handled call last |
Date |
Date of Event or Call |
Phone |
Lead's Phone number |
Call Status |
Disposition of Call |
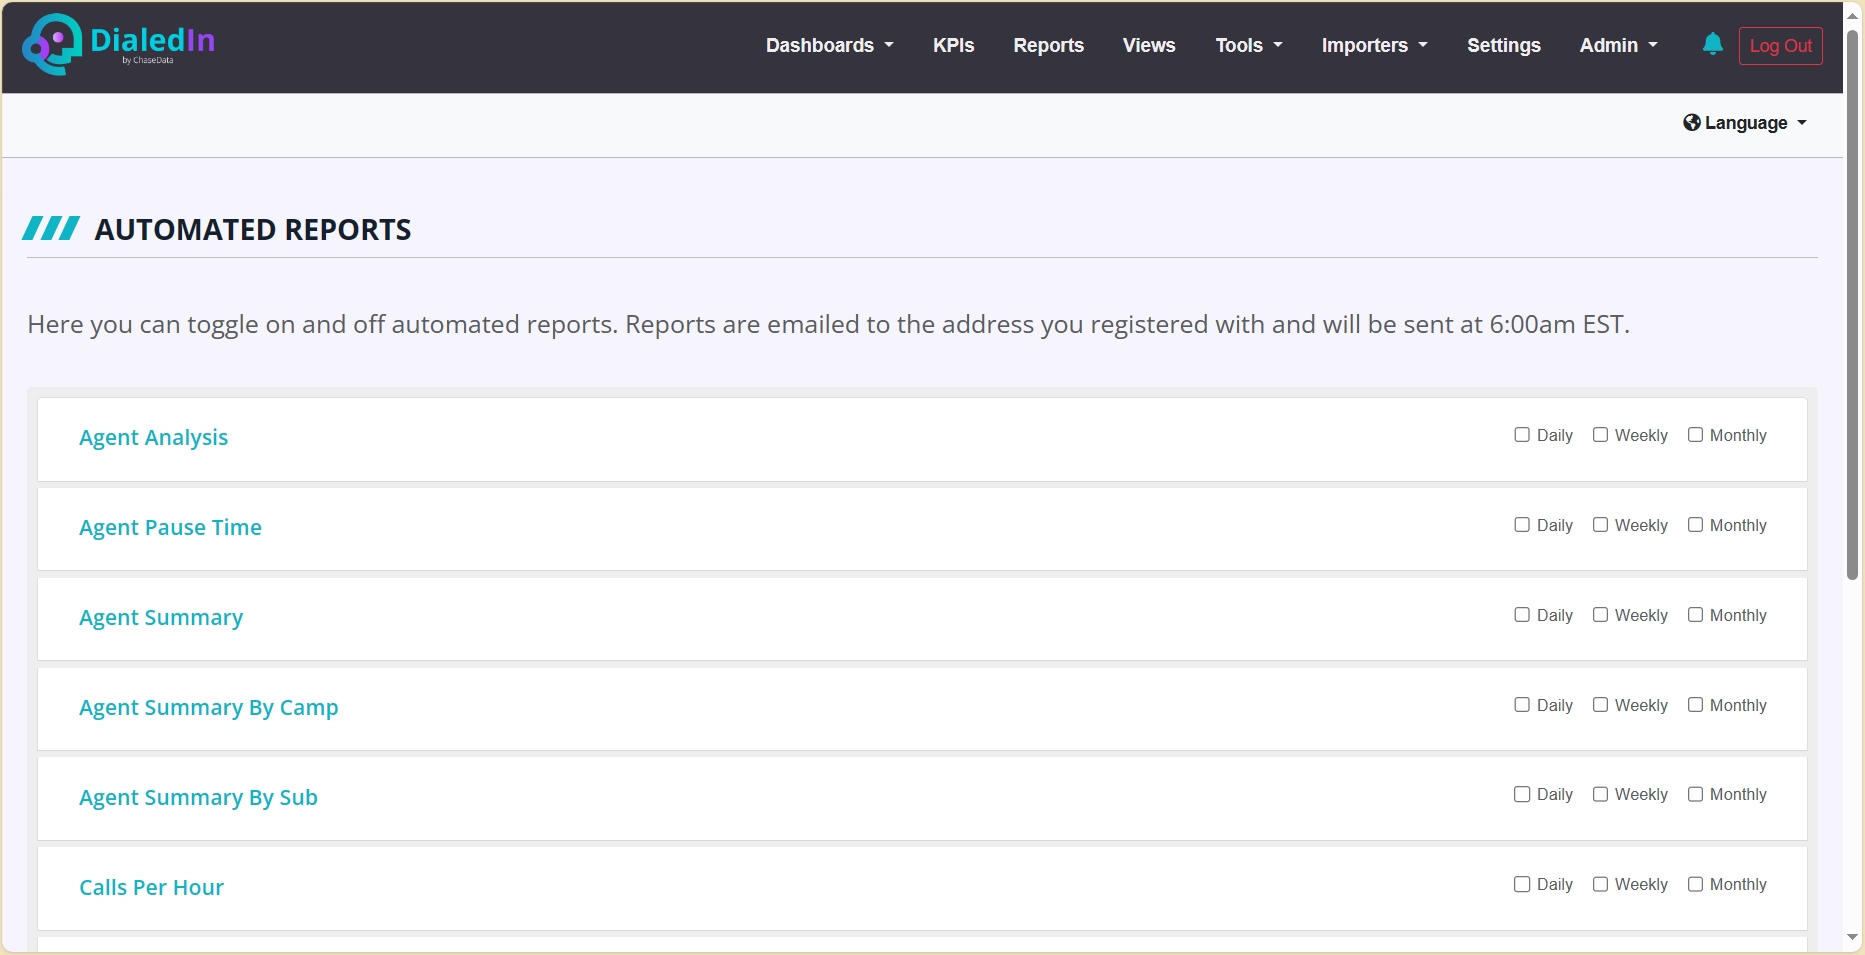
Automated Reports
The DialedIn Portal allows you to schedule reports to run automatically on a time interval and sent to you by emailing them to your registered address. They're normally sent at approximately 6:00am, East US Time, except for hourly and 10-minute intervals, which all start at the bottom of the hour.
Access to the Automated Reports screen can be found at the top of each Report inputs screen, as well as in Settings, allowing you to schedule any of the listed reports to be sent using default parameters.
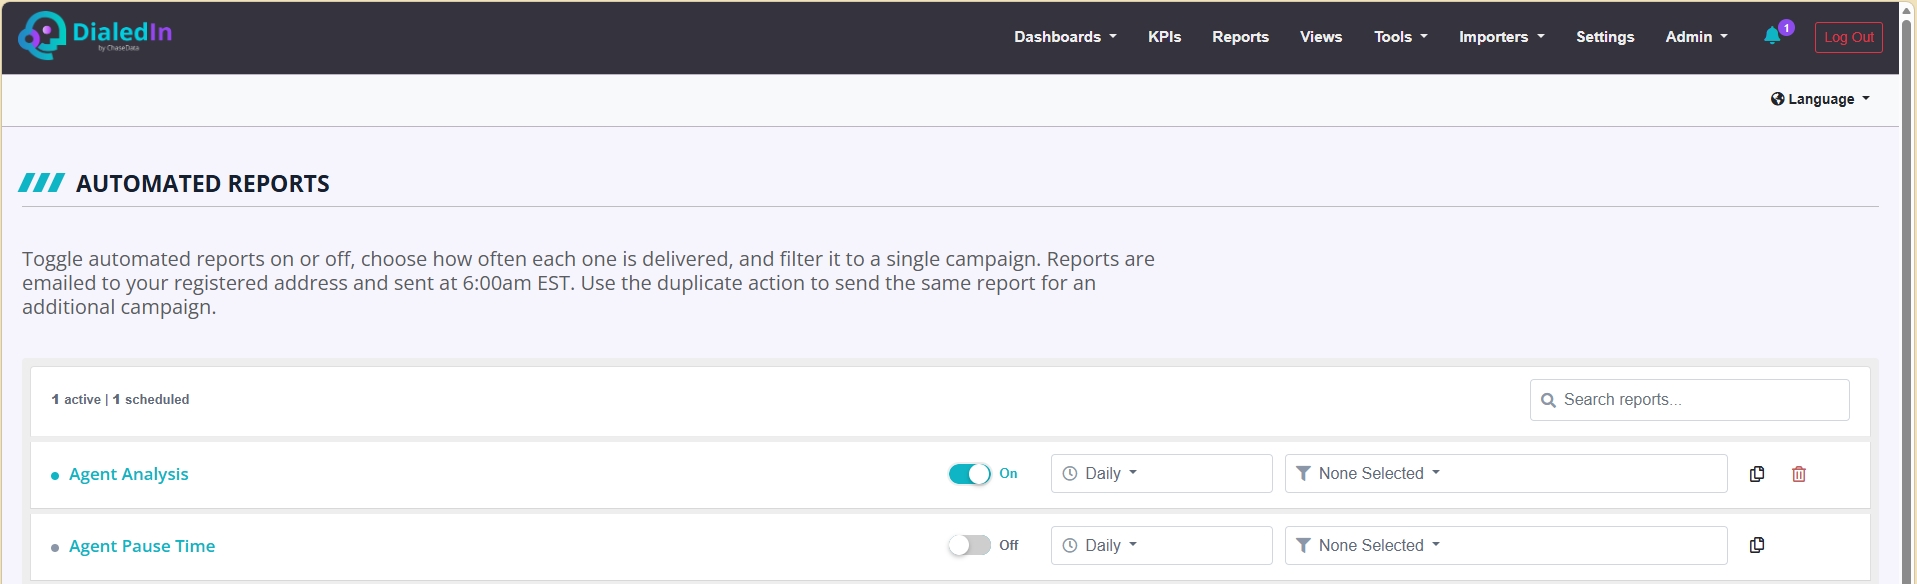
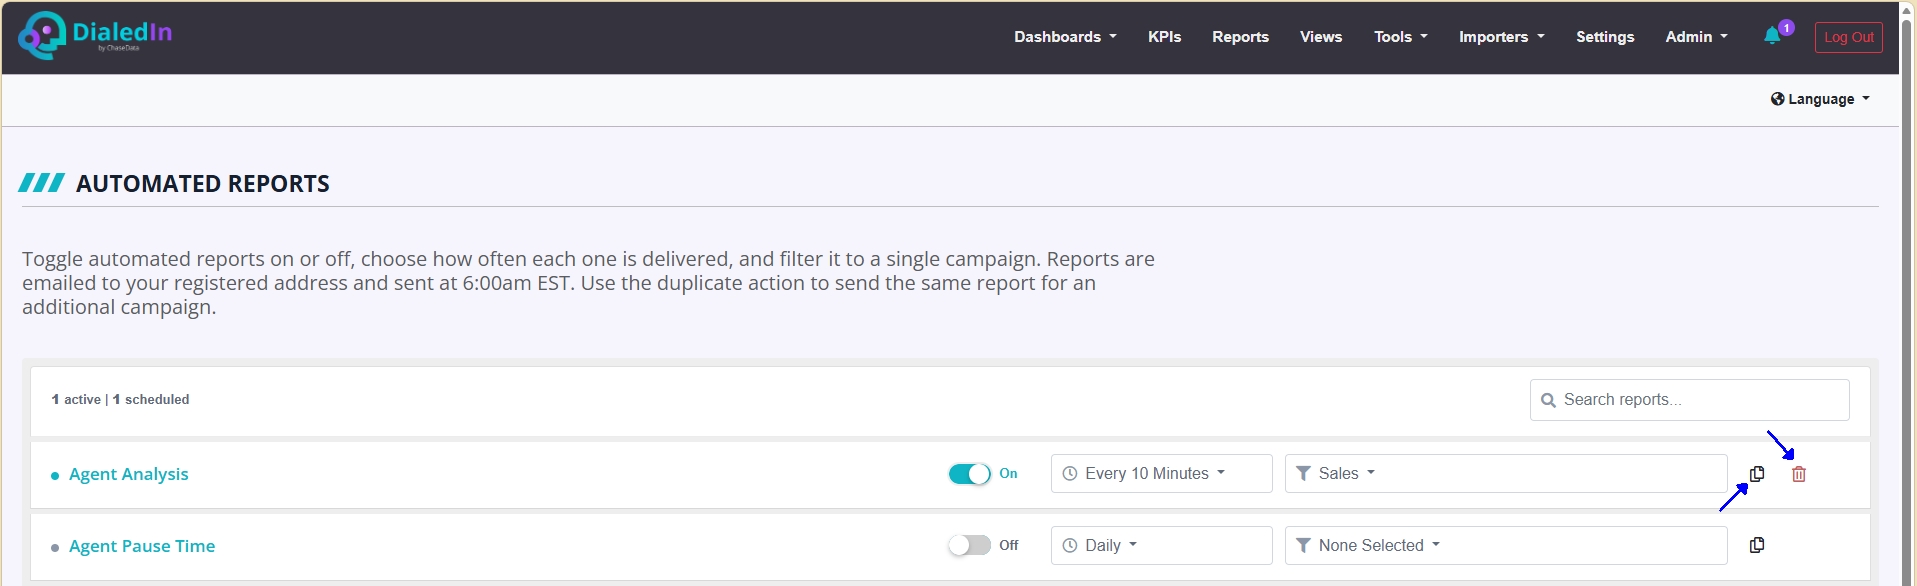
Scheduled reports can be toggled ON and OFF at any time, as shown in the following picture.
You can define the time interval to execute the scheduled report; this can be Daily, Weekly, Monthly, Hourly, or Every 10 Minutes, as shown in the following picture.
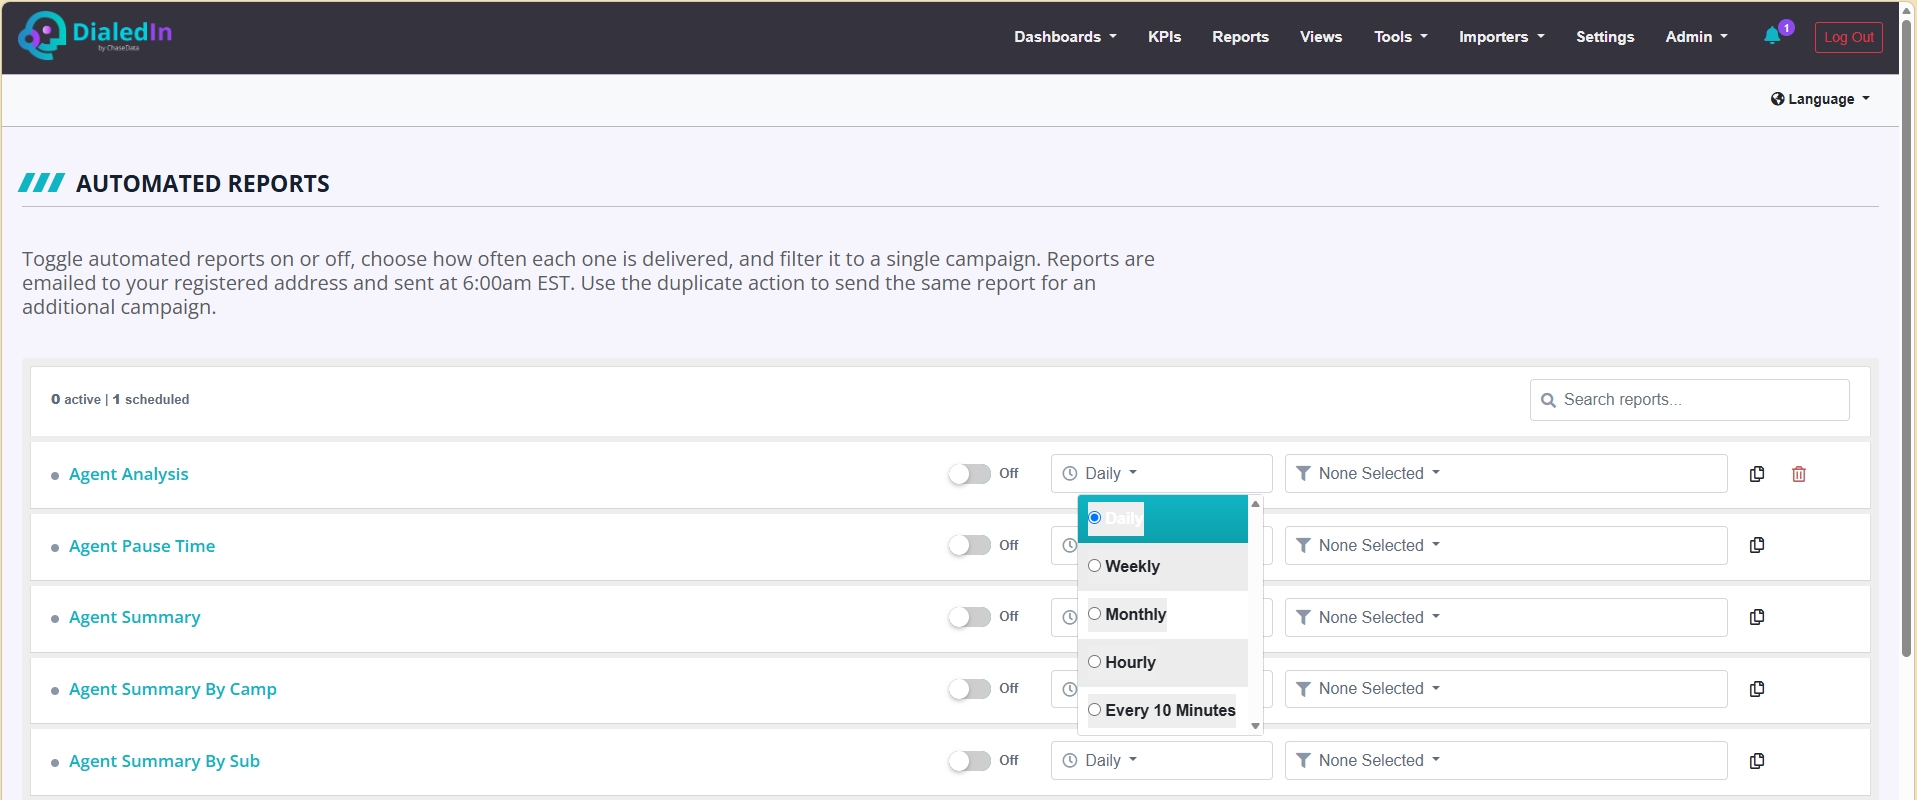
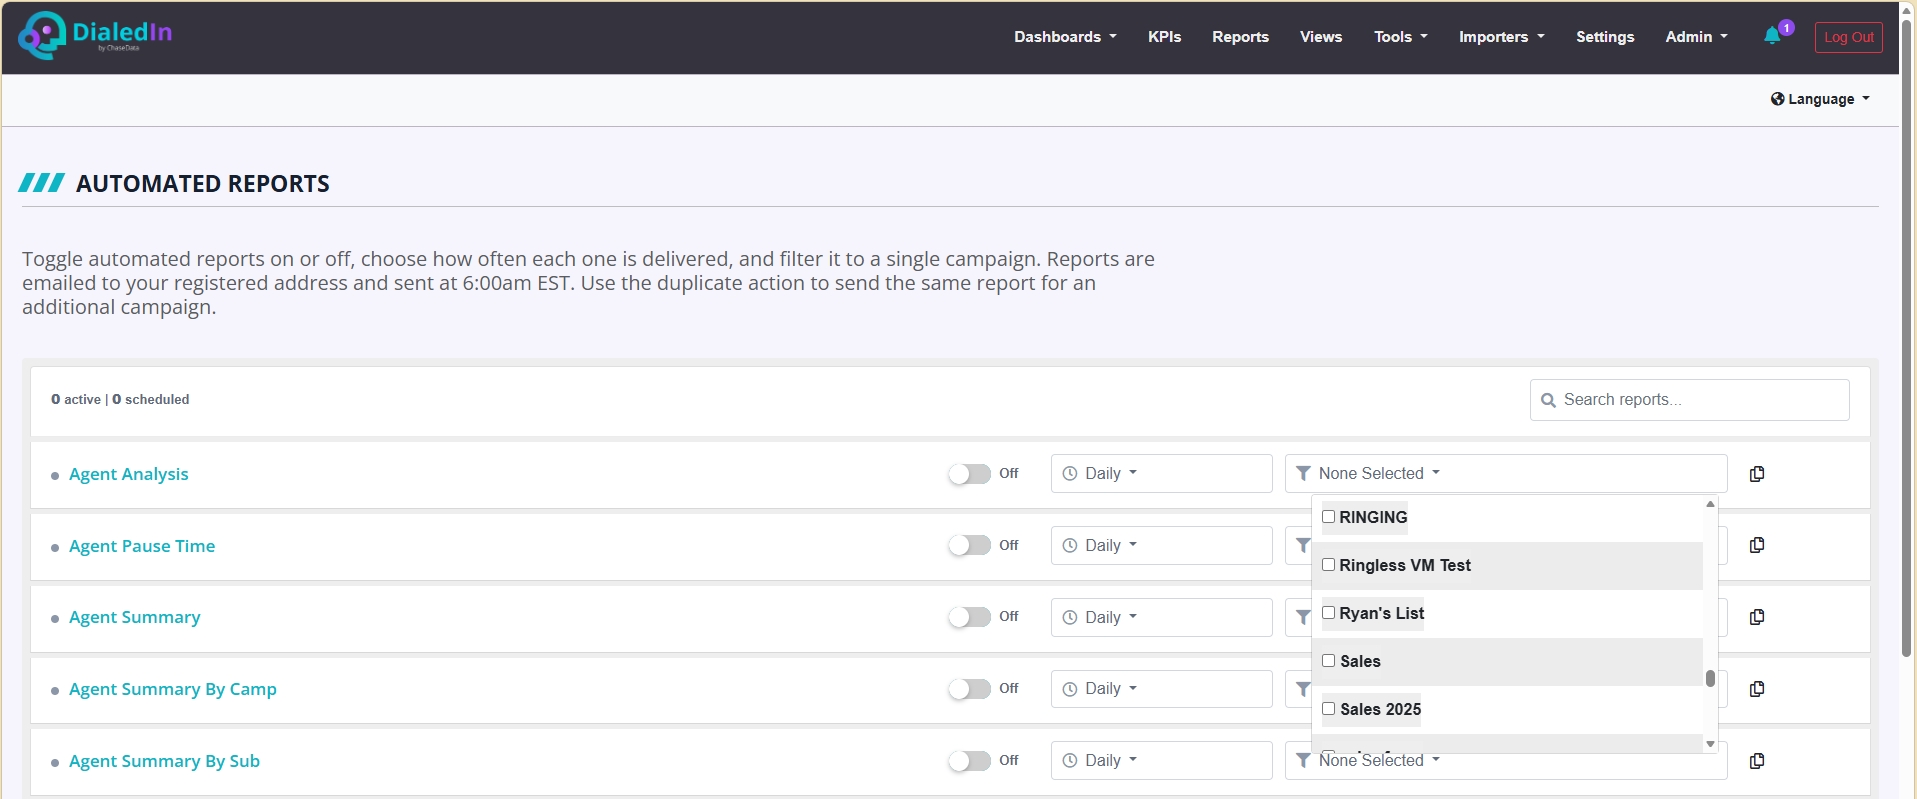
The report can be filtered to only run on one or more selected Campaigns, as shown in the following picture.
Two other actions available are to clone a scheduled report, which allows you to define different filters for the same type of report, and to remove a report schedule, as shown in the following picture.
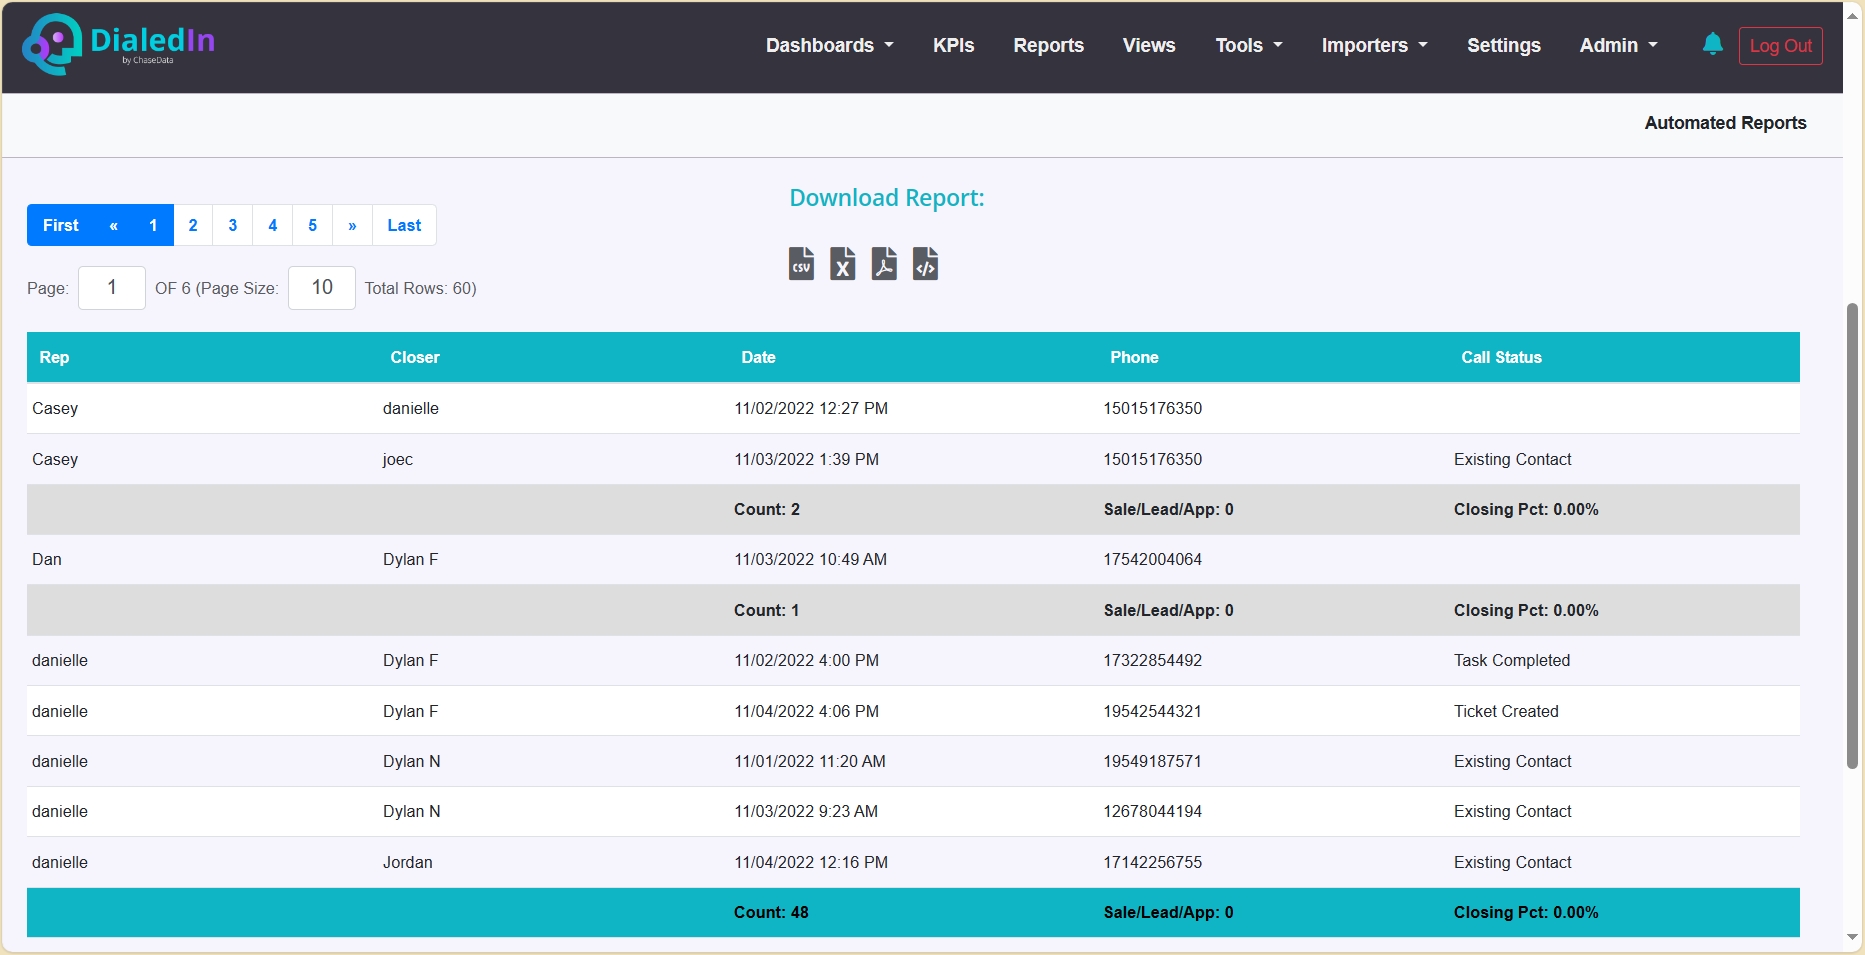
Scheduled and active reports are sent to the user's email address configured in settings, since they're linked to the logged in user. The report email will look something similar to the one in the following picture.
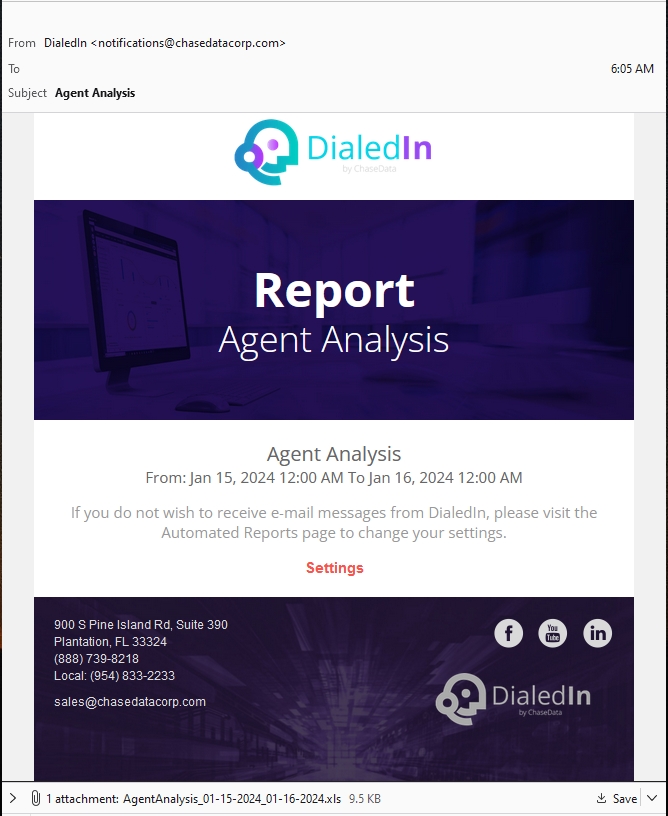
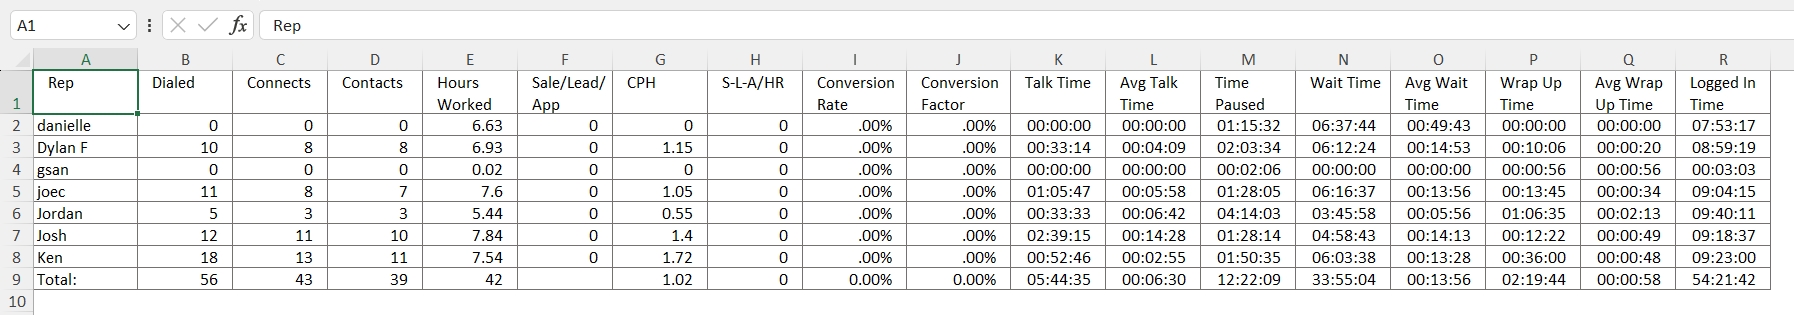
The email will include an attachment for the report, usually in Excel format, similar to the one in the following picture.