The DialedIn CCaaS Management Console is a very good tool not just to configure call management behavior, but also to monitor the health of the operation. One of the means to do so is the Live Dashboard, which can be used by authorized managers and supervisors to view ongoing live information about agents, outbound call activity, and inbound call activity.
To access it, go to the main menu area on the left and click on Live Dashboard. You will see that it includes live information on Agents, Campaigns, Active Lines, and Inbound activity, which you can access selecting the corresponding tab. Refer to the following picture.
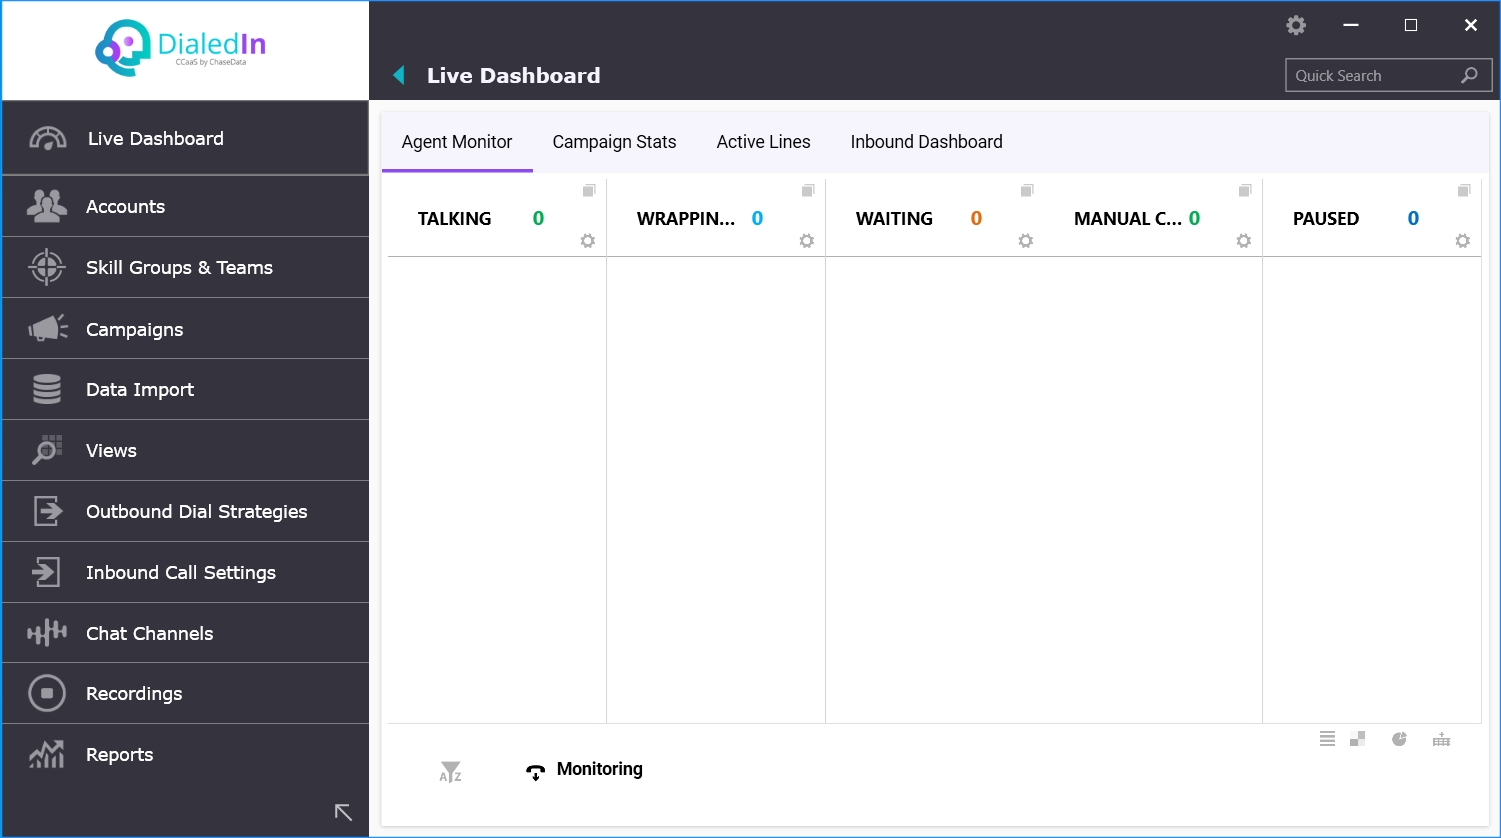
The Agent Monitor area of the Live Dashboard allows viewing live (near-real-time) information about logged in Agents; it does so through charts and/or Lists. Refer to the following picture for a typical display setup.
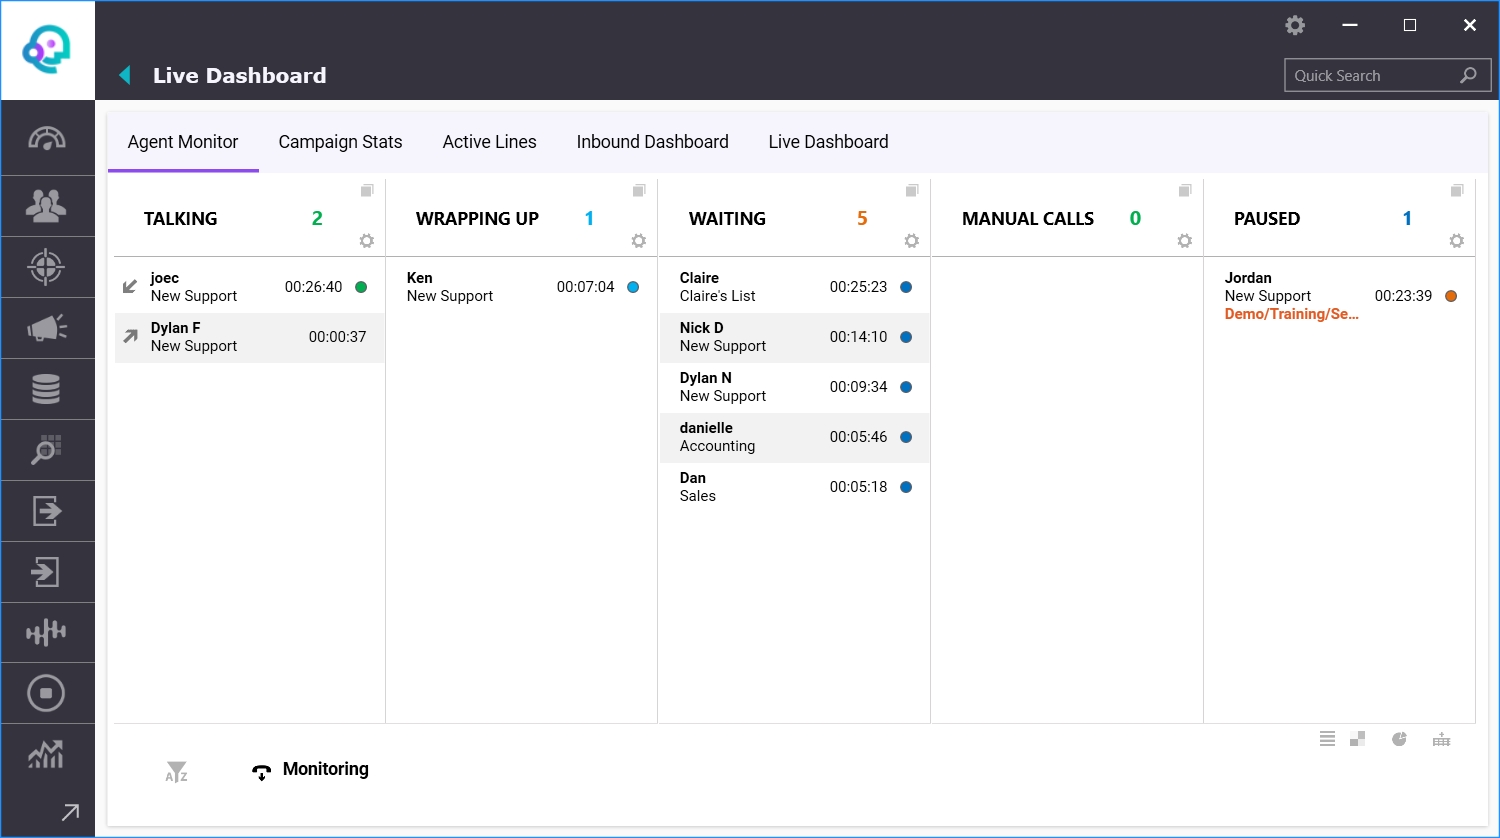
As you can see, the display groups Agents according to top level stages of activity or state, TALKING, WRAPPING UP, WAITING, MANUAL CALLS, and PAUSED.
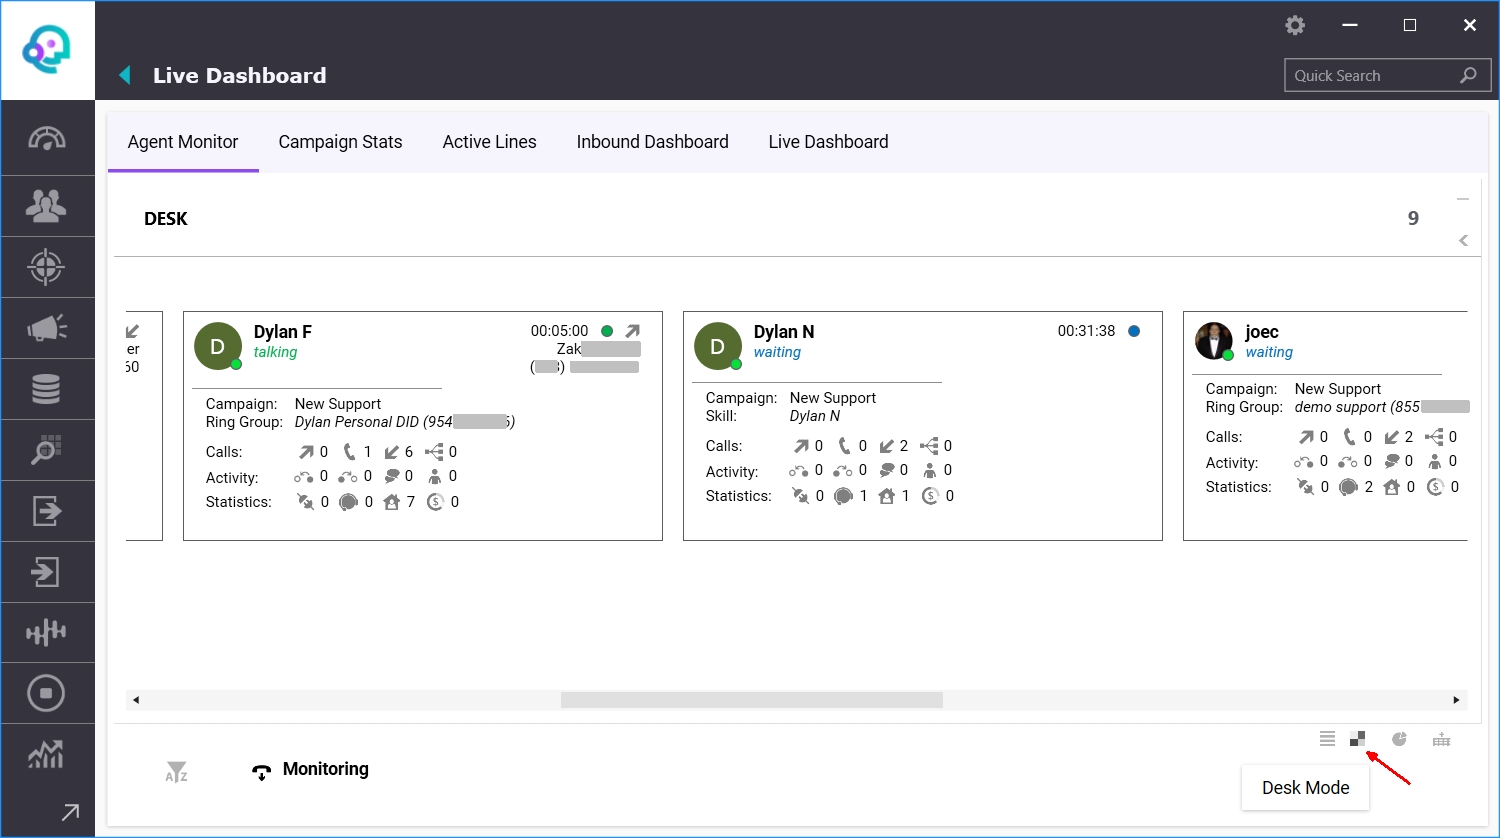
If you need a more detailed view of each Agent, access Desk Mode by clicking the corresponding icon (bottom right corner); it will expand the statistics for each Agent accordingly. Refer to the following picture.
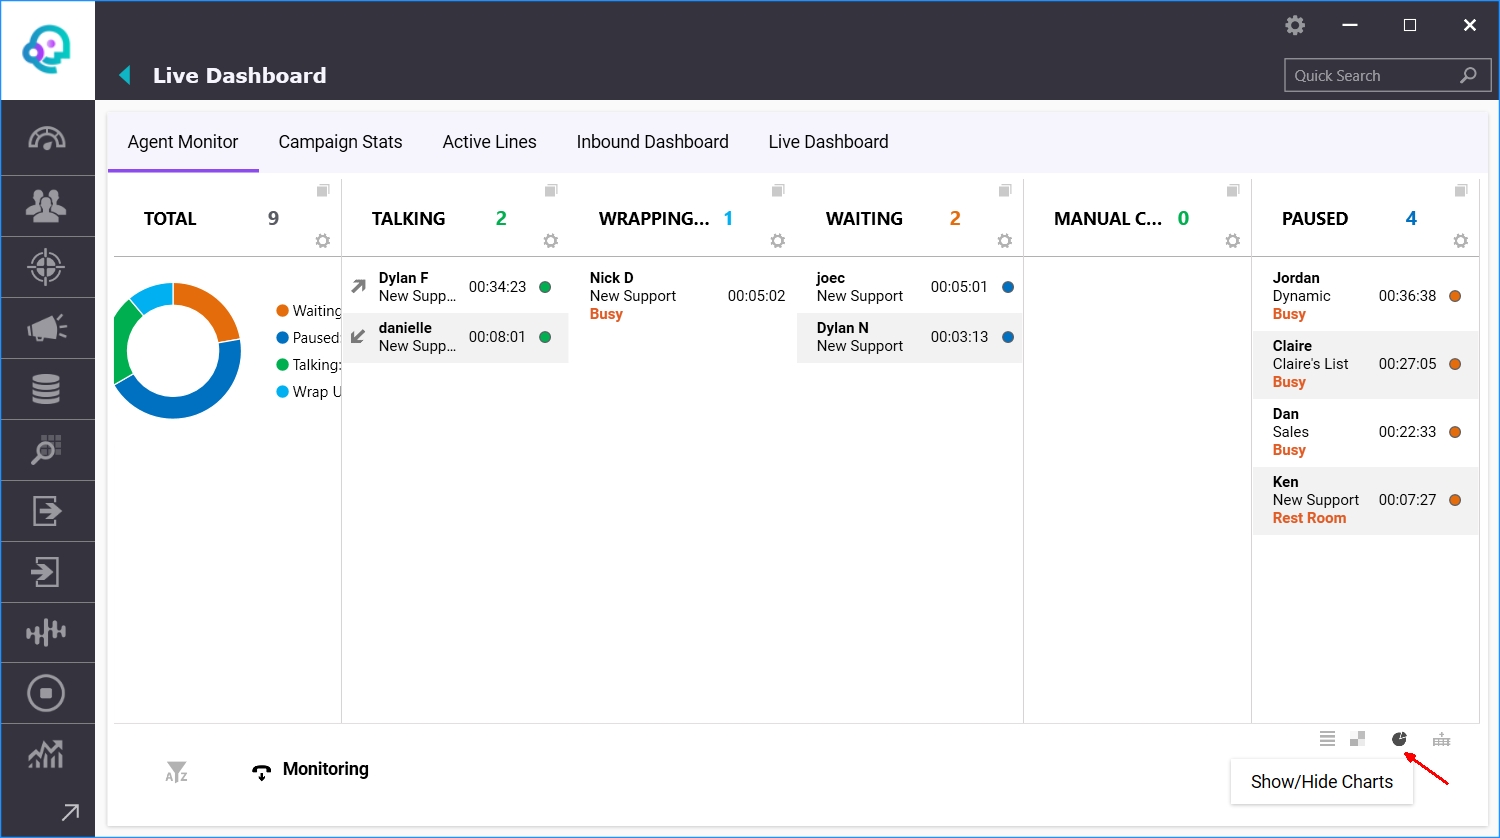
By clicking the corresponding icon (bottom right corner), you are able to show (or hide) a chart with the distribution of Agents in each state. Refer to the following picture.
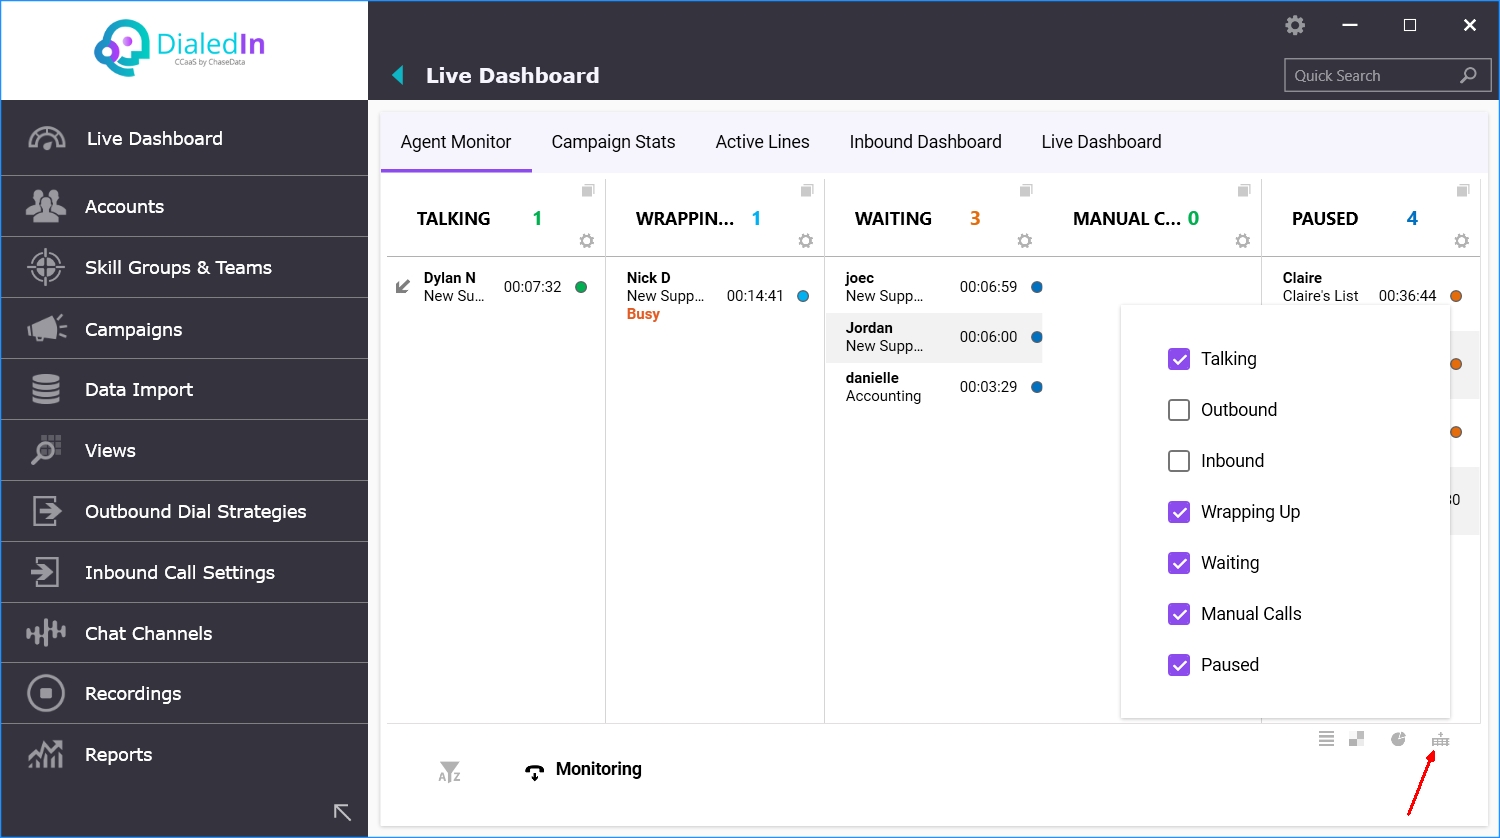
Also by clicking the corresponding icon (bottom right corner), you can select which activity states to display. Refer to the following picture.
And you can also configure what and how to display under each Agent state, as well as the refresh frequency, by clicking on its Settings icon. Refer to the following picture.

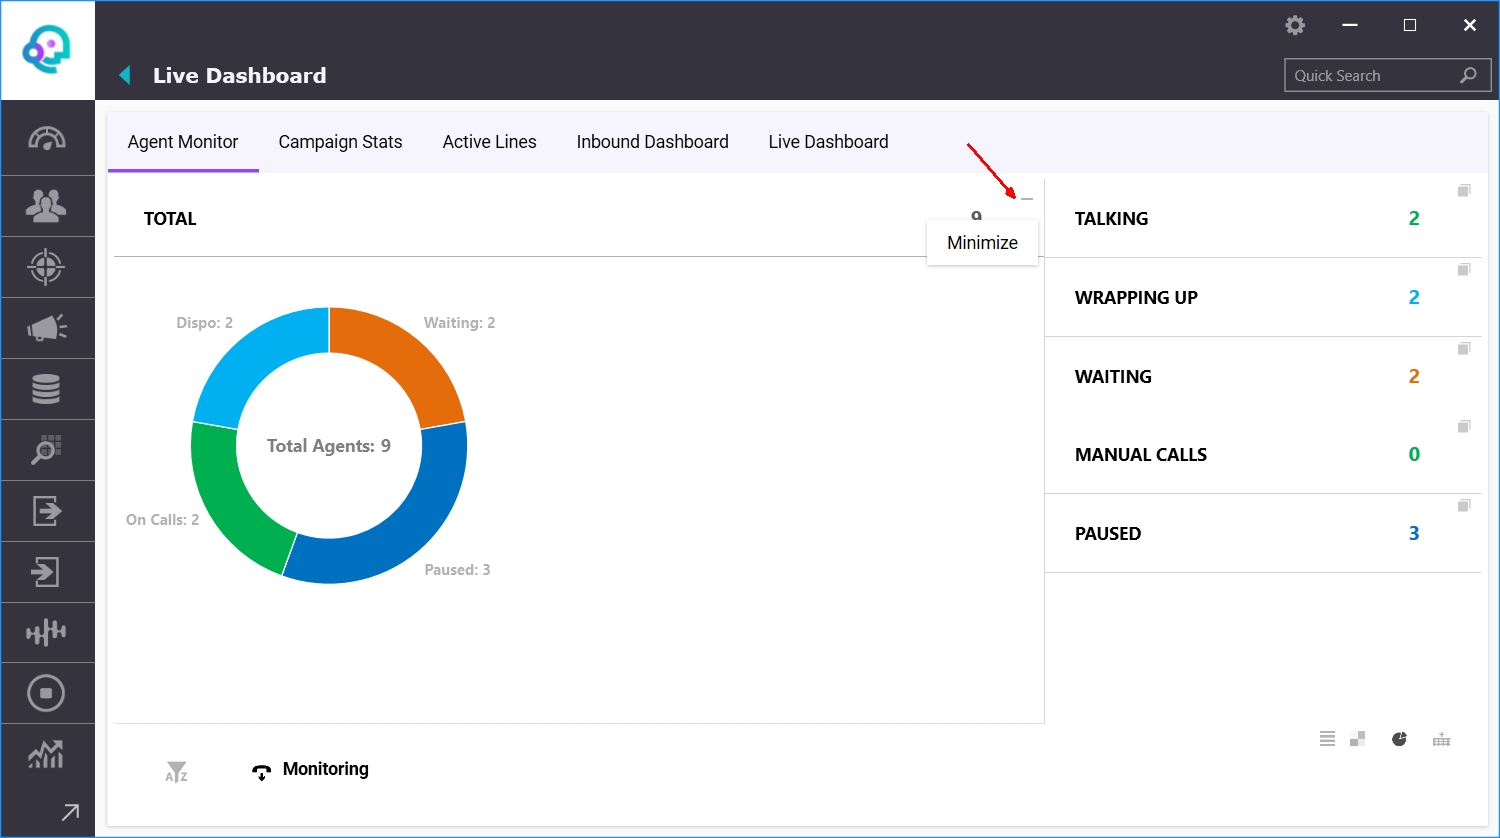
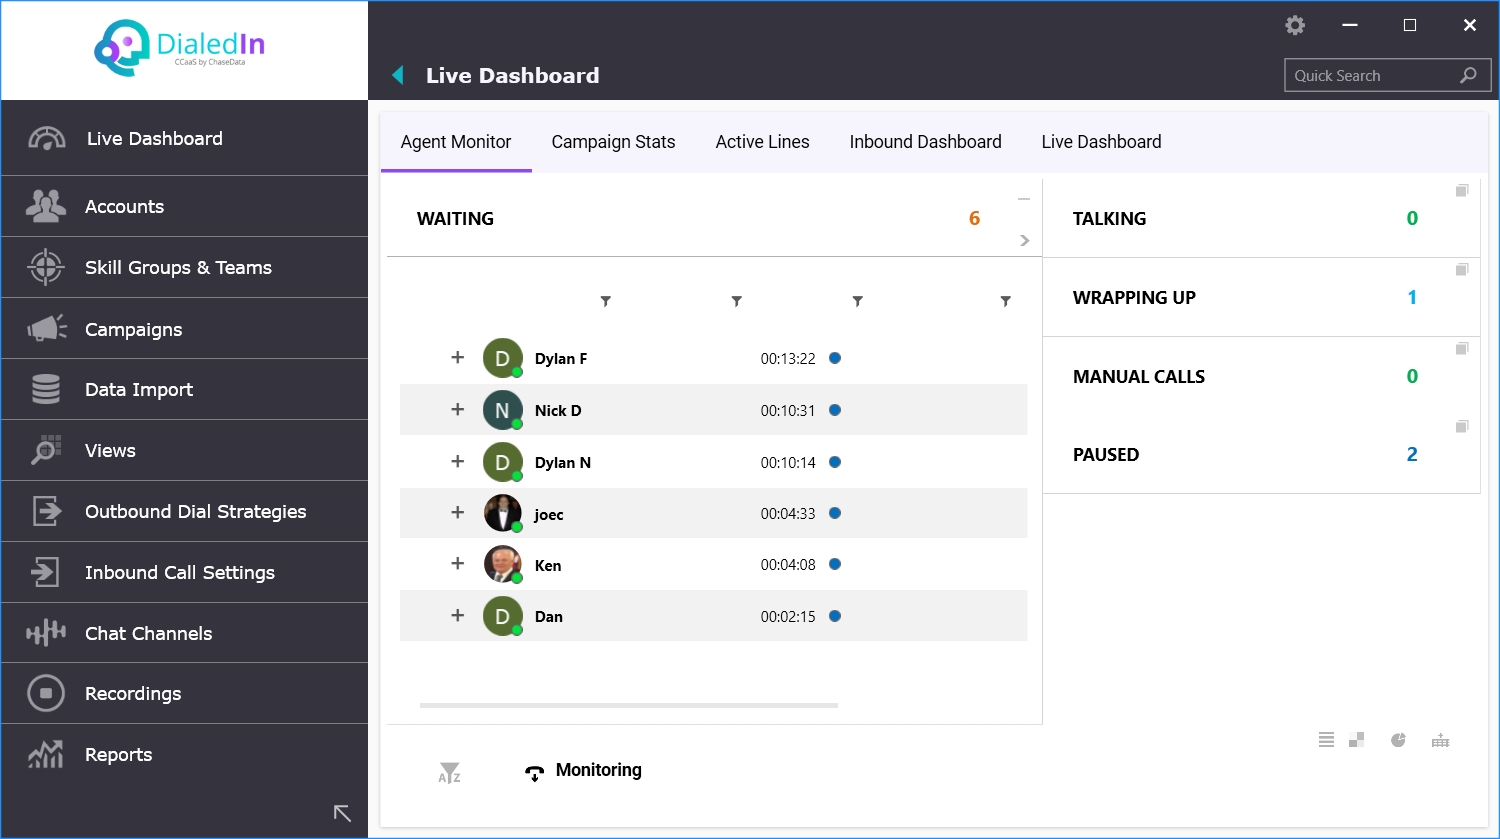
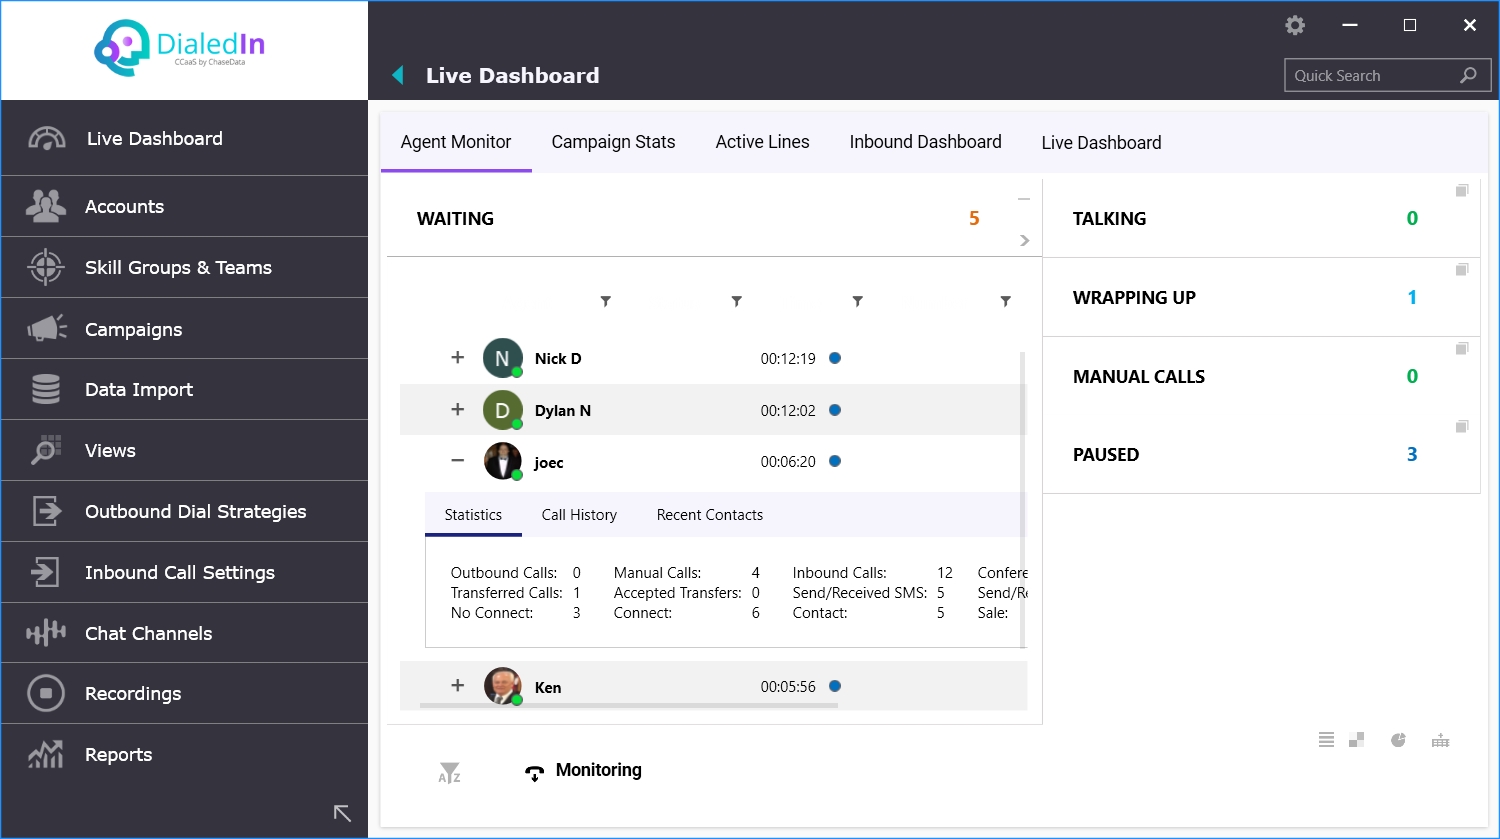
A particular Agent state can be expanded, to see details of Agents in that state, by clicking on the corresponding icon (top right corner of the Agent state); click again to retract back. Refer to the following pictures.
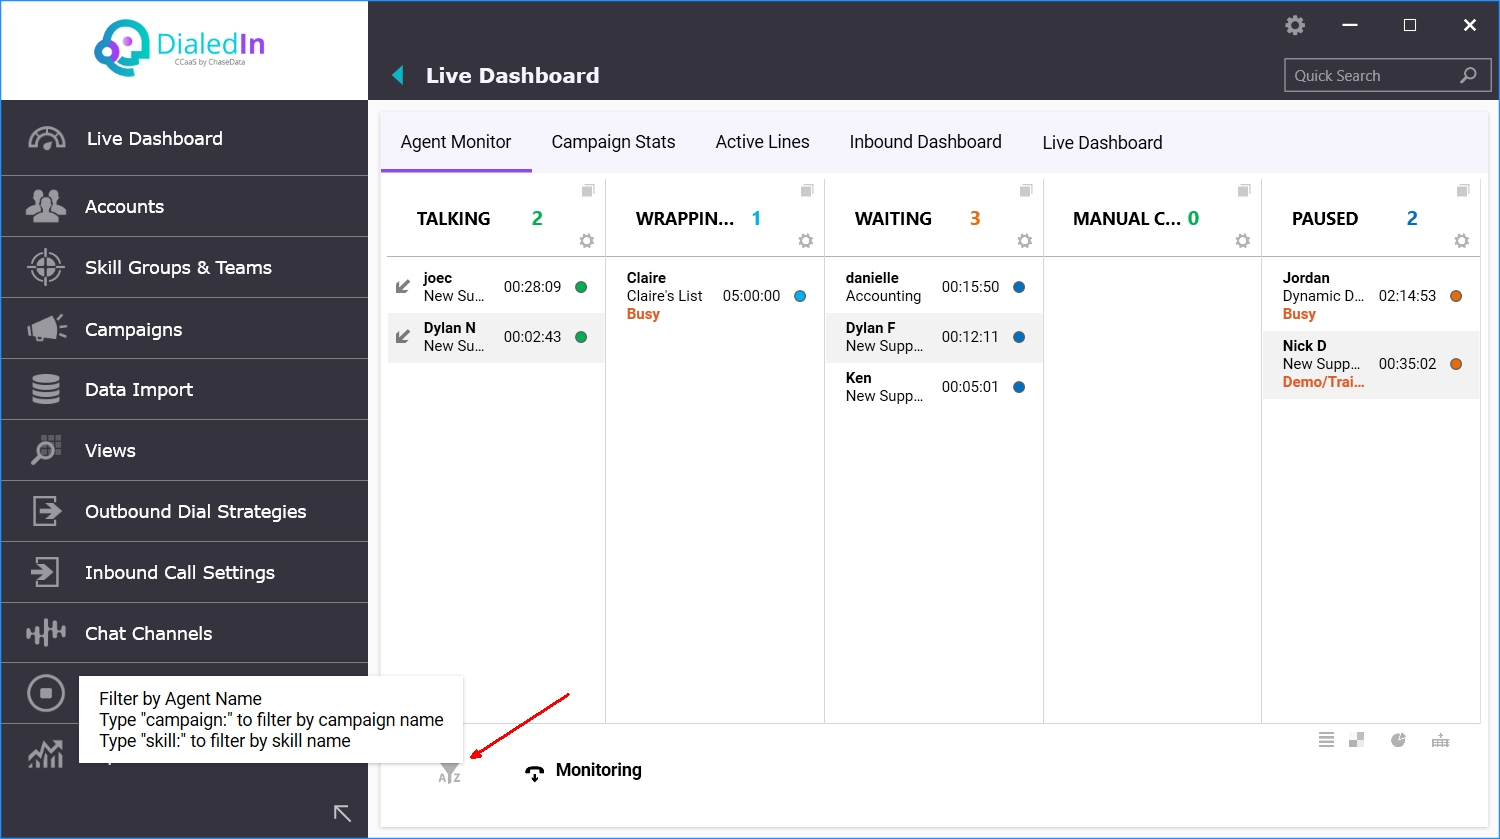
Filtering on an Agent, Campaign, or Skill can be done by typing on the filter field, which is expanded by clicking on the corresponding icon (bottom left). Refer to the following picture.
Another important part of the Live Dashboard's Agent Monitor dashboard doesn’t just provide live statistical data on Agents, but also provides the tools to start live monitoring of Agent calls (audio) and screens (video), if the administrator/manager logged in has the proper privileges.
Clicking on the corresponding icon (bottom left) gives access to the parameters to follow when monitoring an Agent. Refer to the following pictures.
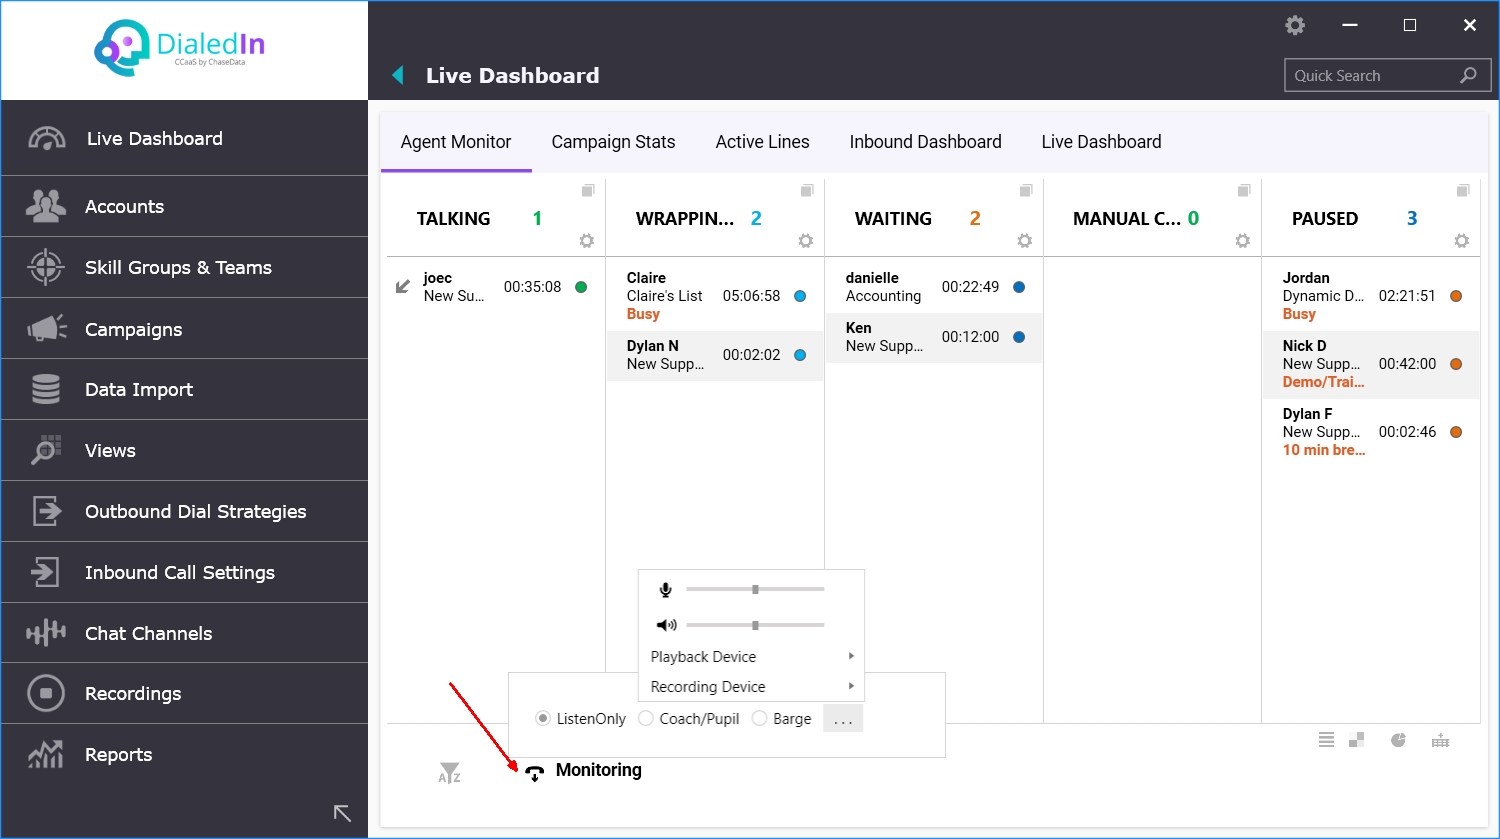
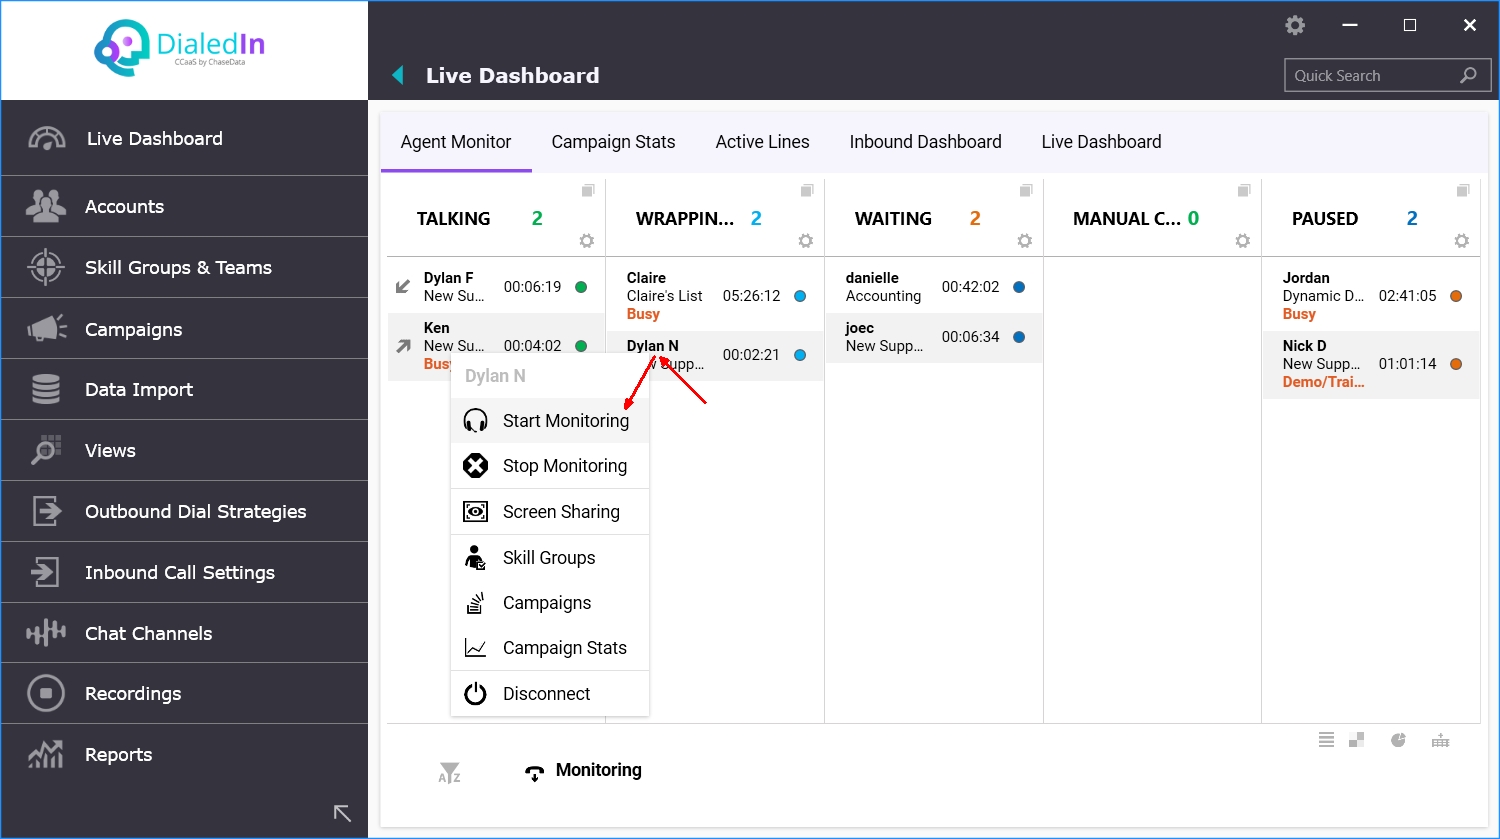
To Start/Stop Monitoring and/or Screen Sharing, right-click on the desired Agent name. Monitoring allows listening to the live audio of the selected Agent, while Screen Sharing allows to see the live screen of the selected Agent. Refer to the following picture.
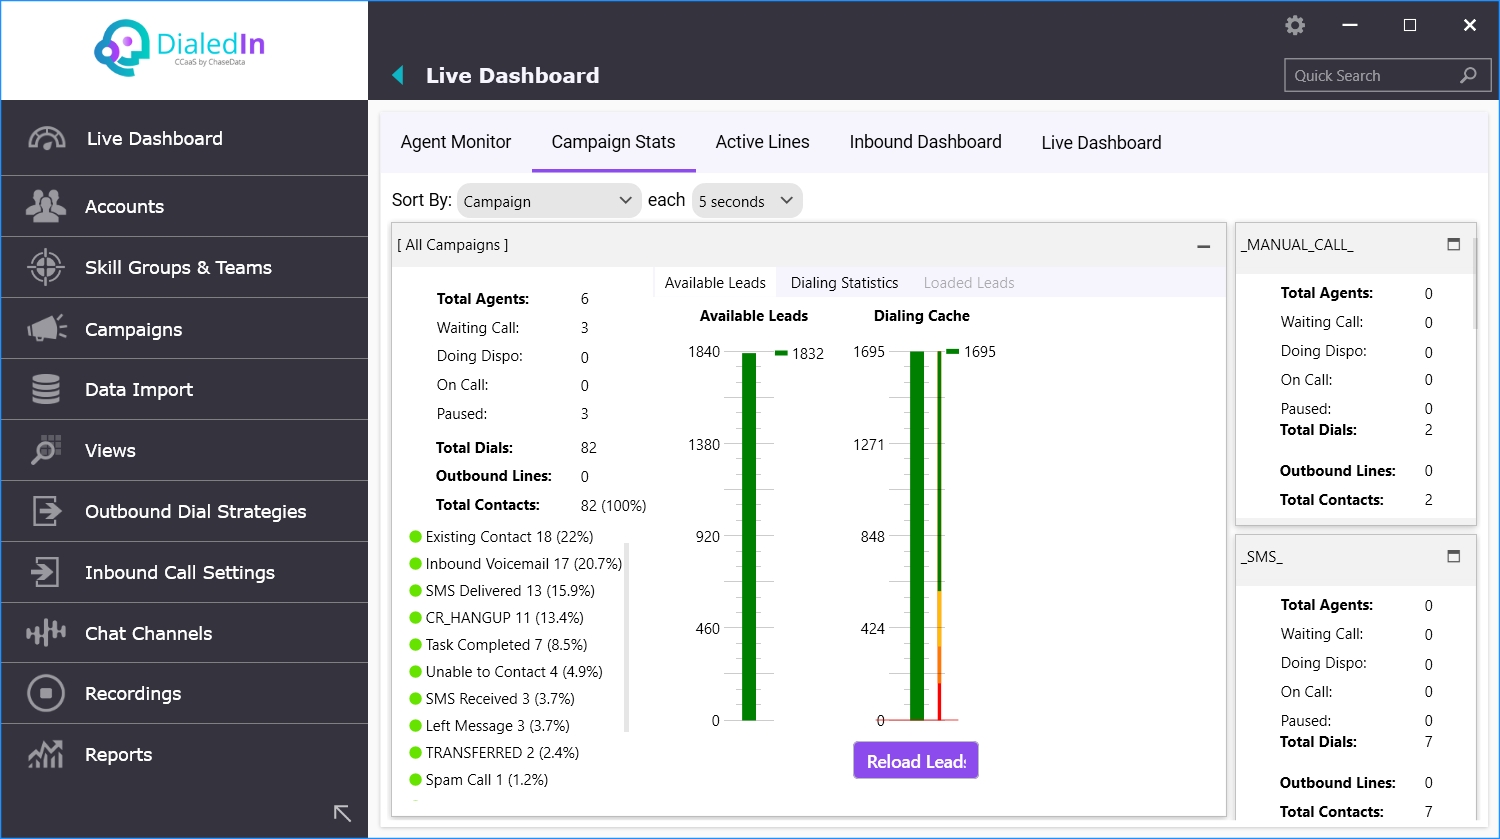
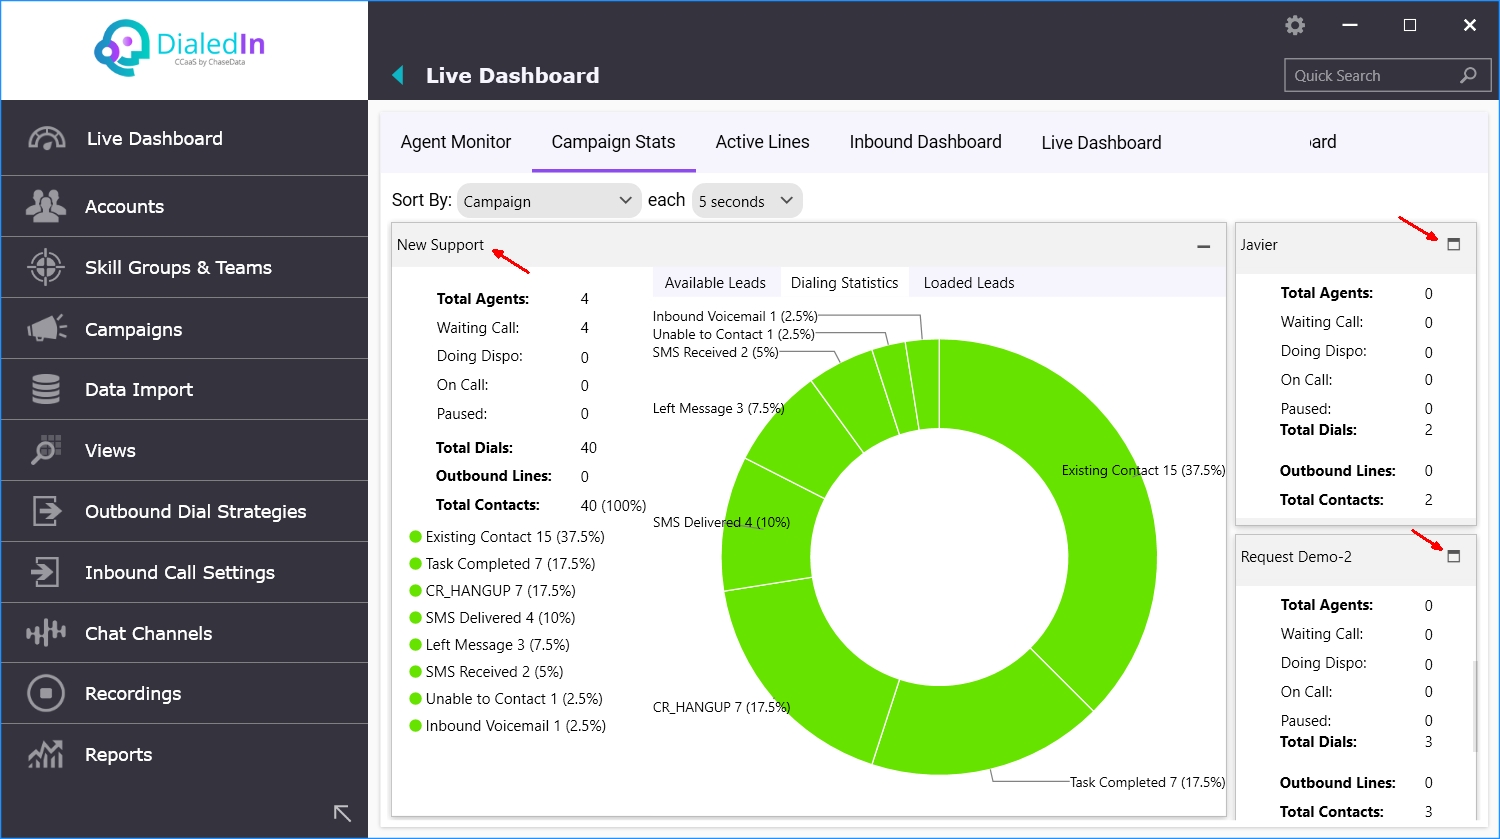
The Campaign Stats area of the Live Dashboard allows viewing live (near-real-time) information about Outbound Campaigns; it includes three tabs, Available Leads, Dialing Statistics, and Loaded Leads (for a specific Campaigns). Campaigns Stats can be sorted by Campaign, Most Dialed, More Agents, Currently Dialing, Highest Contact Rate, and Highest Drop Rate; this is done via the pull-down menu on the top-left of the window panel.
Campaign Stats are available for active Campaigns, which are each shown in separate window sub-panel, of which one is expanded, and the rest are summarized; this includes a sub-panel for All Campaigns (expanded by default). To switch a summarized campaign to be in the expanded sub-panel, click on the expansion icon on the top-right of the corresponding summarized sub-panel.
The Available Leads tab of Campaign Stats shows an agent summary, as well as two graphical representations of the number of leads (Contacts) available for dialing (out of total leads) and the actual dialing cache, if the selected Campaign(s) include outbound lines. The Dialing Cache shows both the size of the cache and the current level of processing on the cache.
Refer to the following picture.
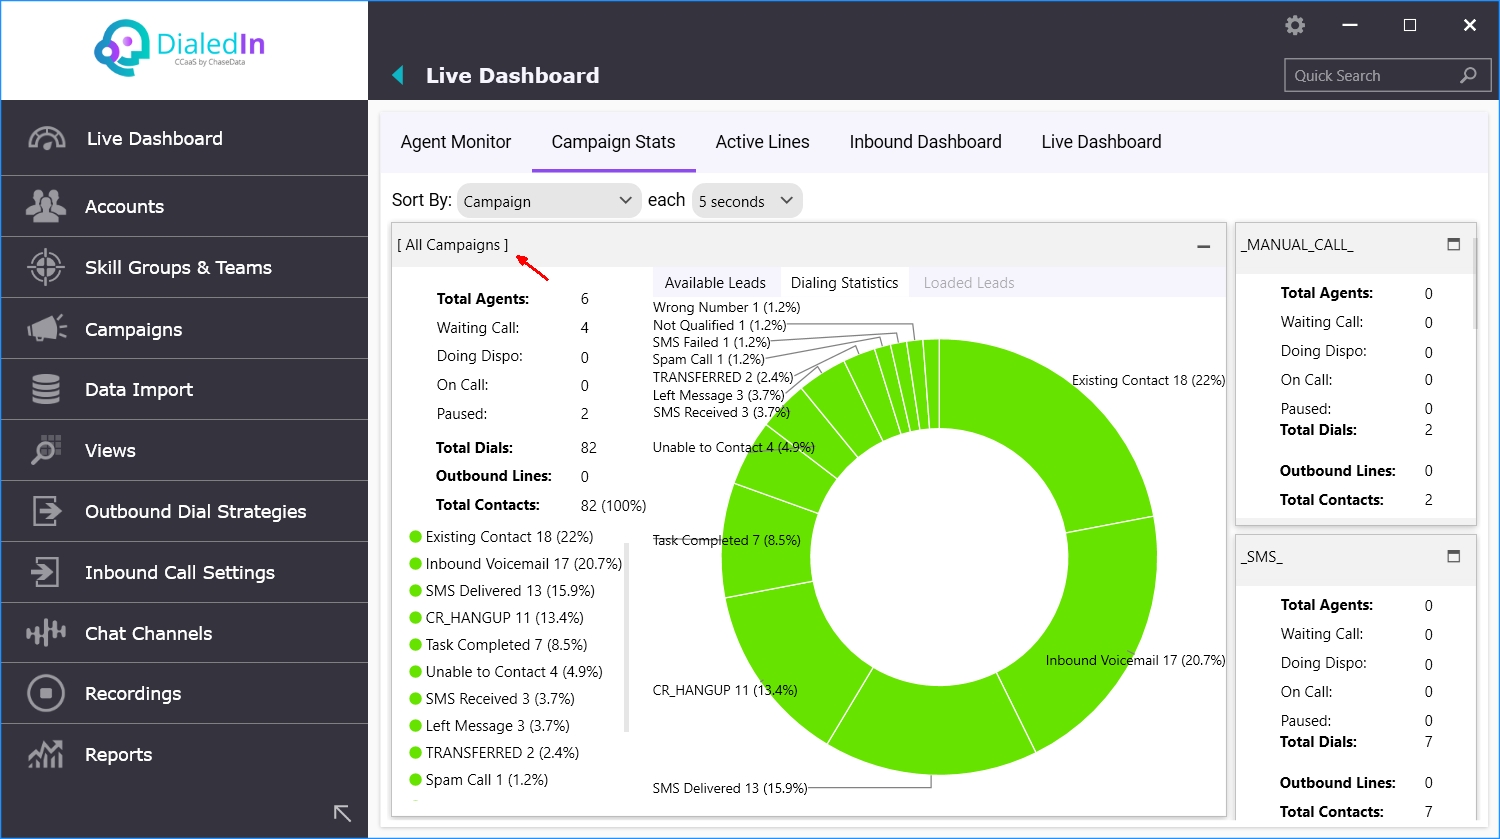
The Dialing Statistics tab provides statistical information around Contacts and calls attempted to those Contacts. Information on Contact status is presented in both an ordered list and in a graphical manner (chart). The chart is color-coded based on disposition / wrap-up code type. Refer to the following pictures.
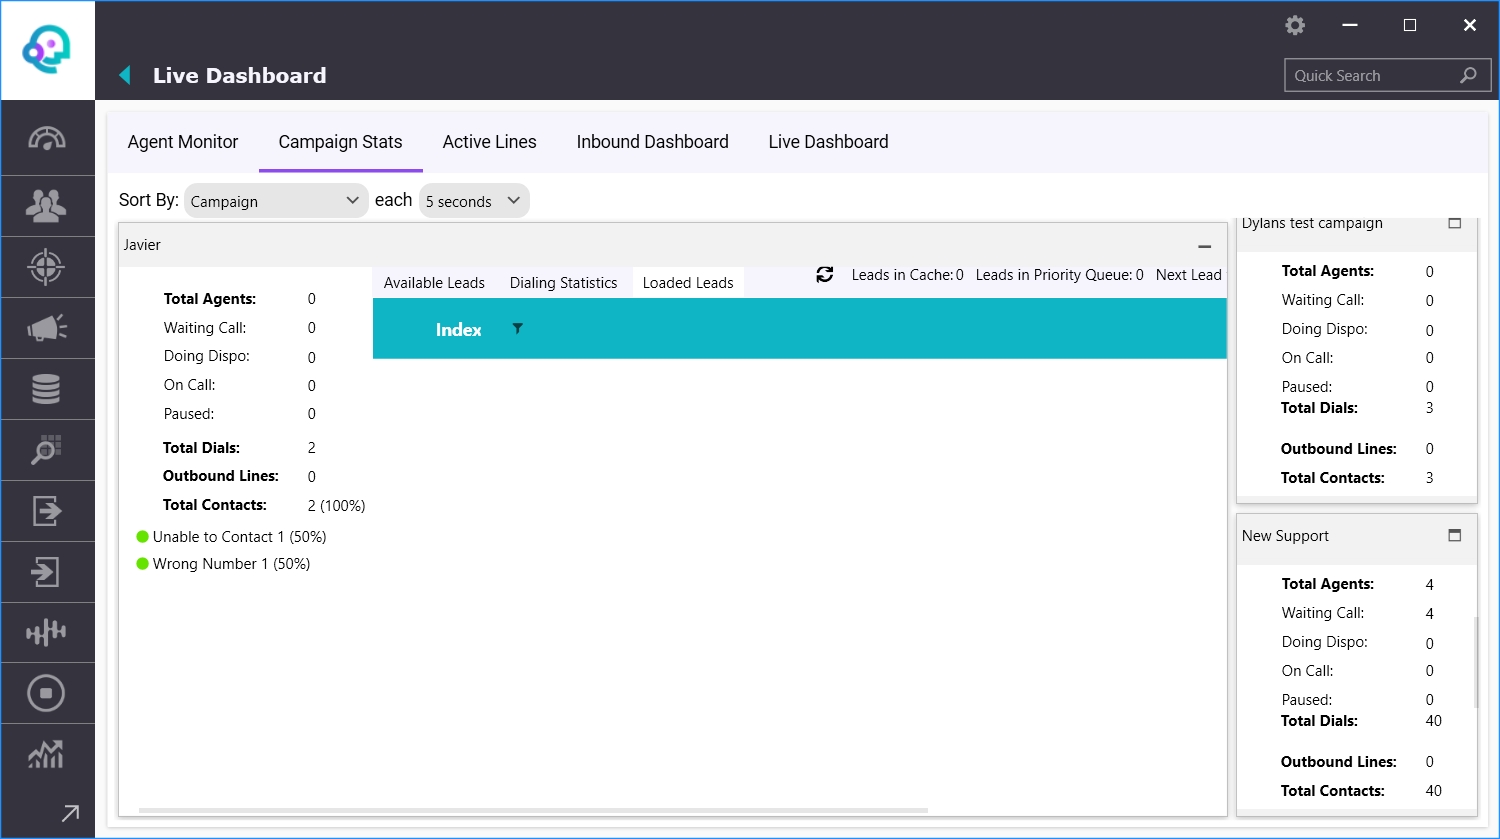
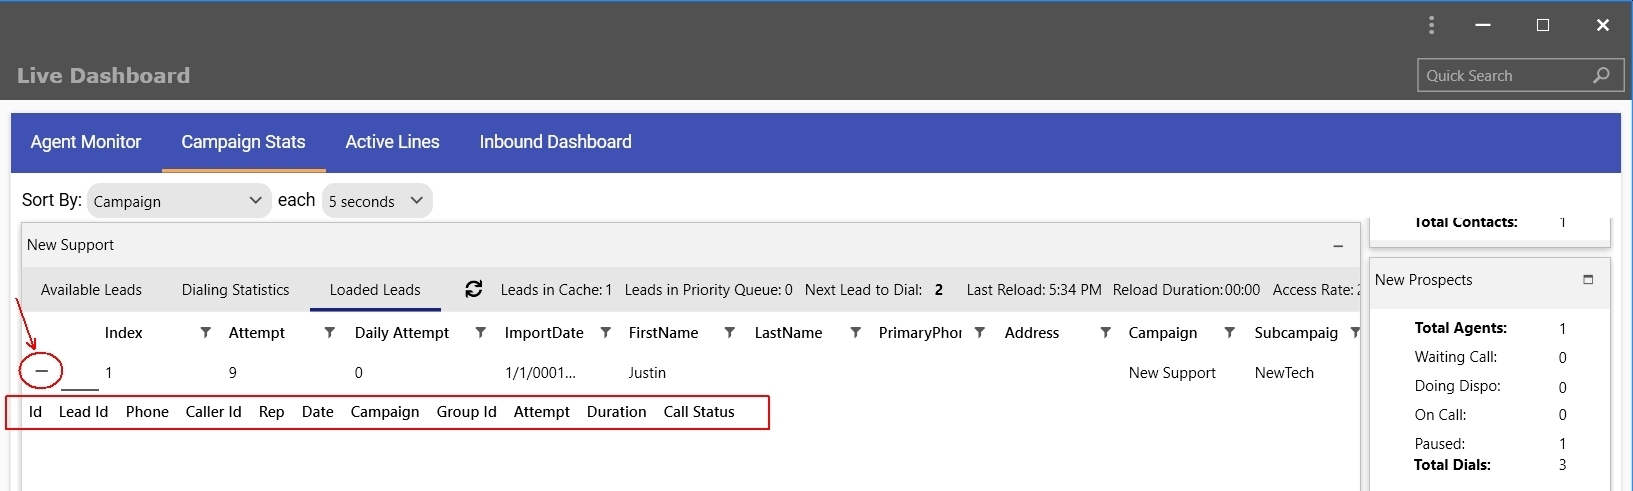
The Loaded Leads tab is available for individual campaigns (not for All Campaigns) and shows, in a tabular form, Contacts in the Campaign that are available for dialing. It also shows, above the table, current cache and dialing activity on those Contacts (leads). A Contact (lead) row can be expanded using the ‘+’ icon on the left end of the corresponding row. Refer to the following picture.
An expanded Contact (lead) row shows call history for the Contact. Refer to the following picture.
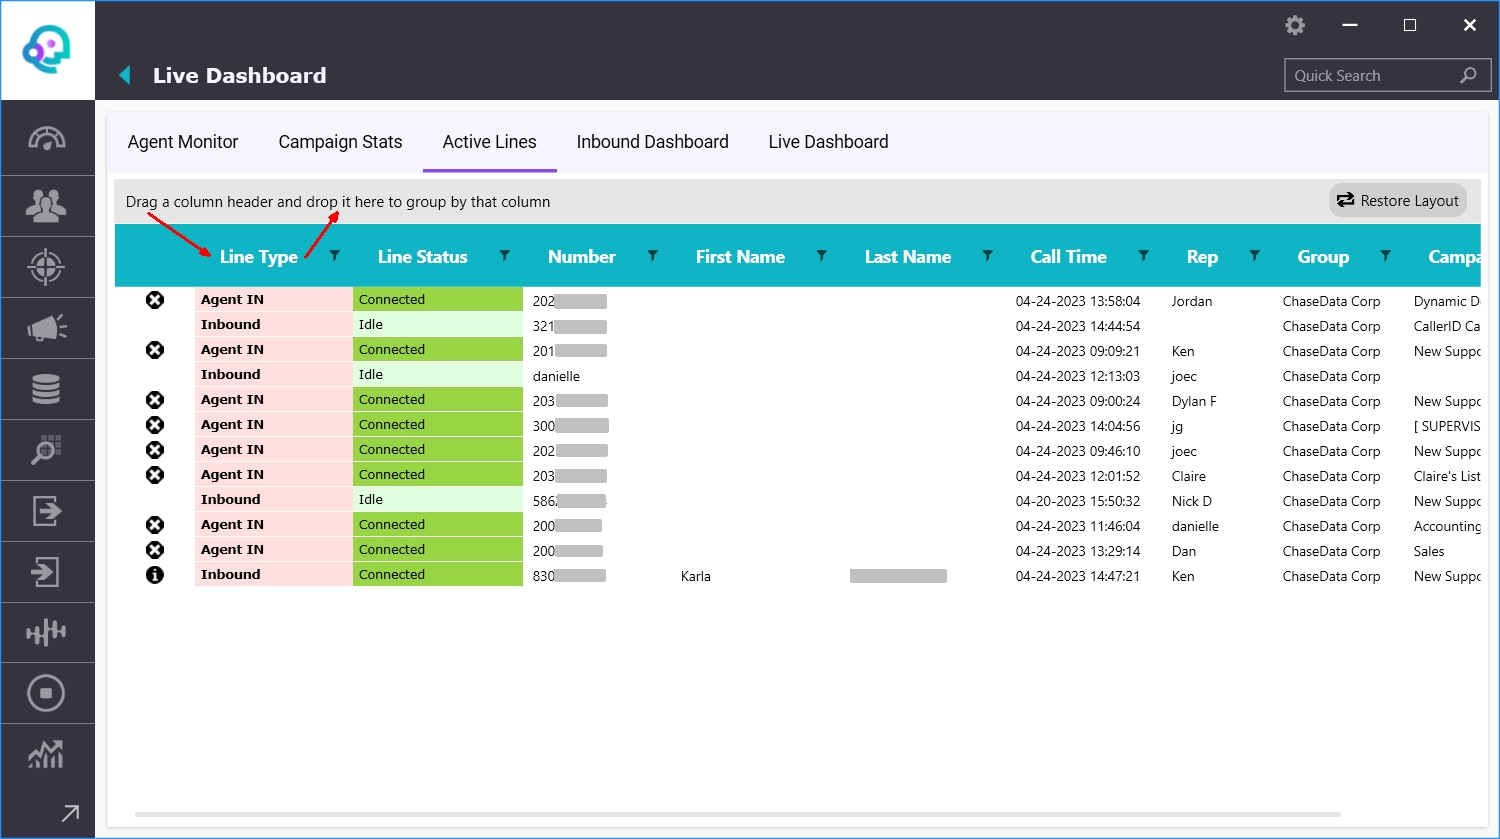
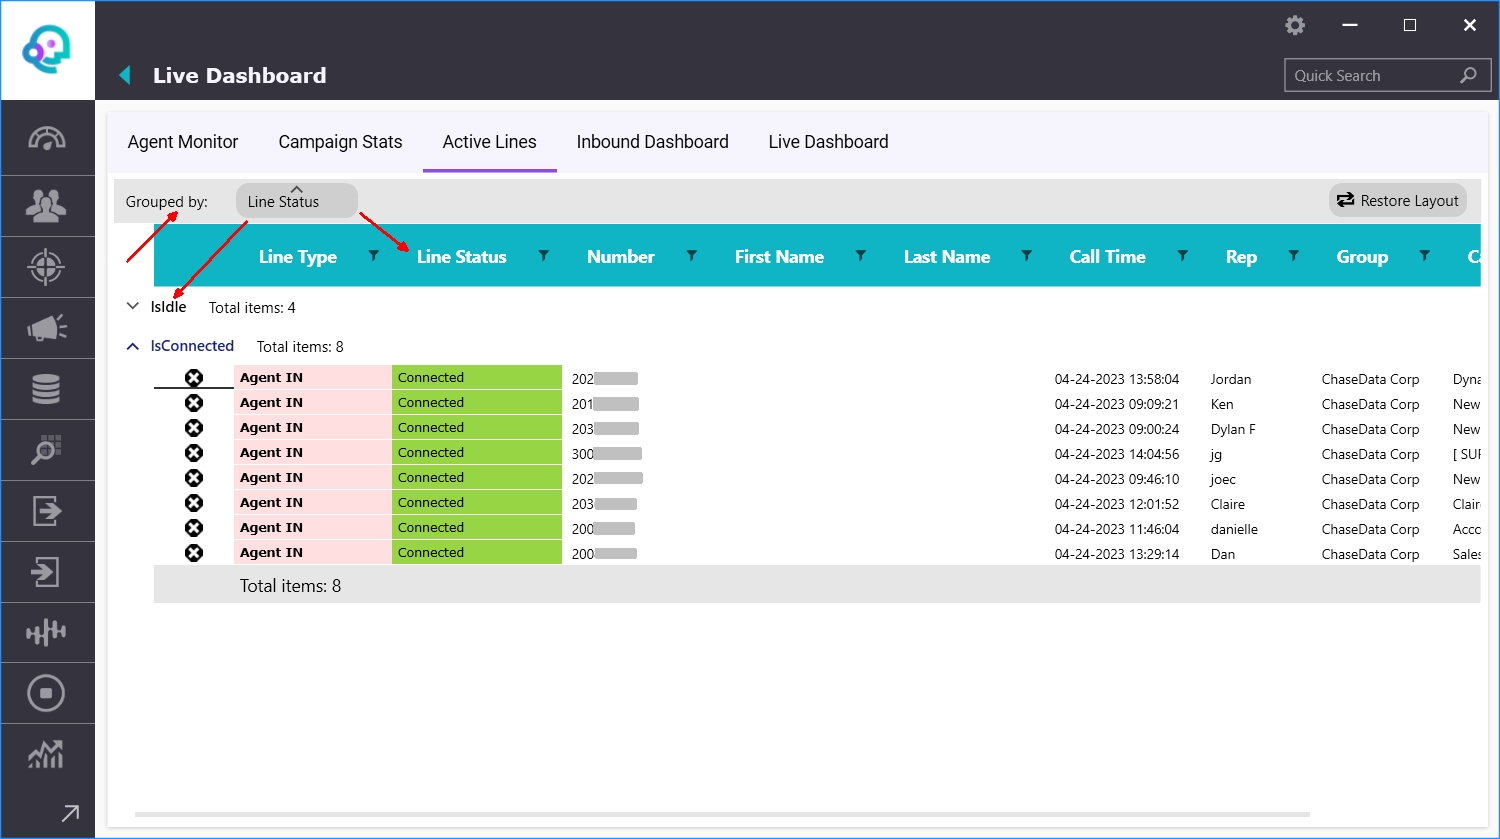
The Active Lines area of the Live Dashboard provides live (near-real-time) details on current calls. Refer to the following picture.

You can group items by dragging one or more column headers to the grouping area (top grey row); using multiple headers allows for grouping and sub-grouping. Refer to the following picture.
The Inbound Dashboard part of the Live Dashboard allows viewing live (near-real-time) information about Inbound Calls; it includes Active Calls in Queue, Inbound Metrics, and Agent Metrics.
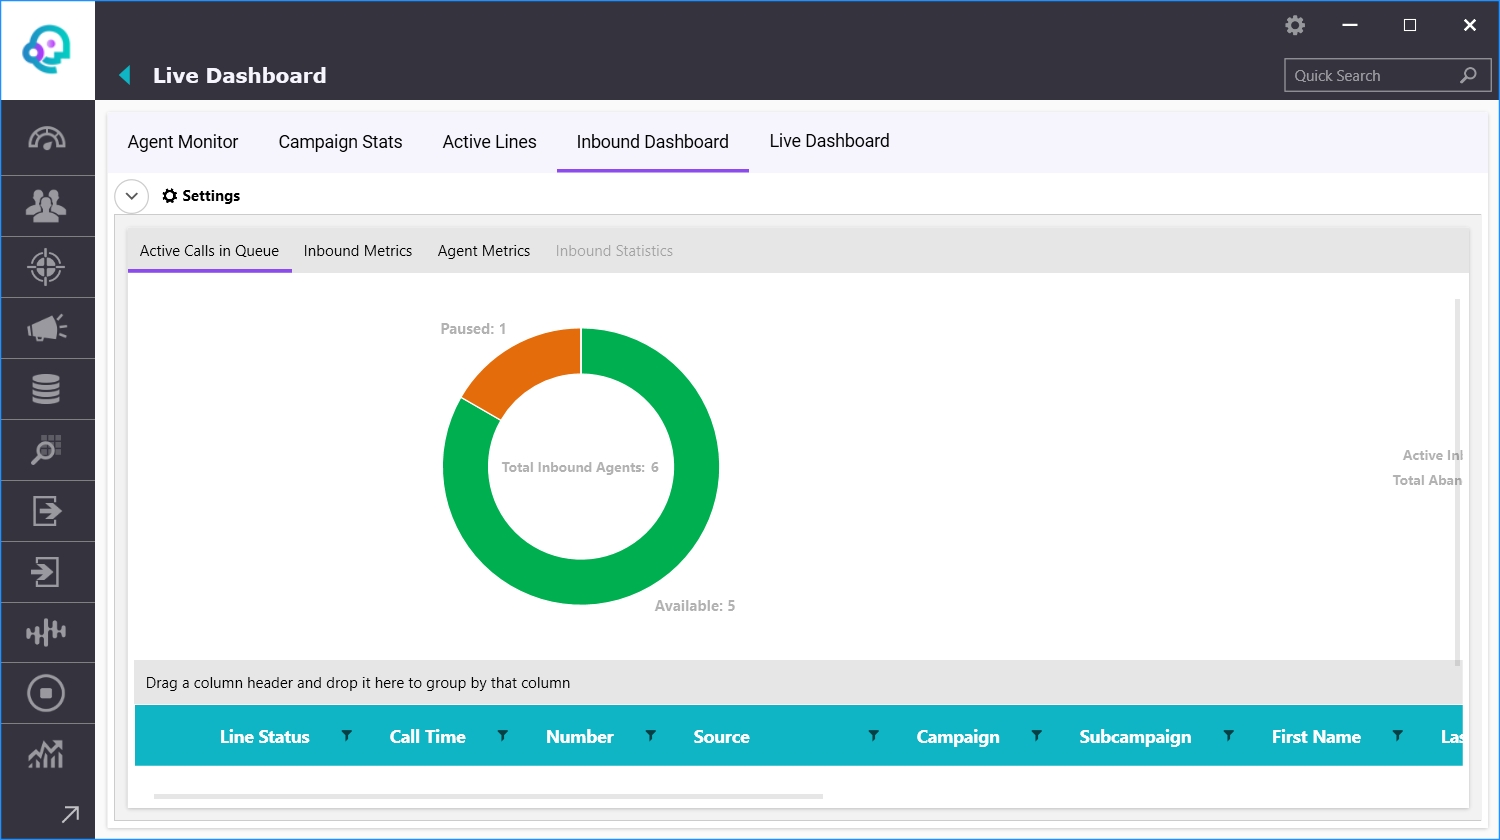
The Active Calls in Queue tab provides charts about the agent queue and status statistics, the inbound activity and its handling statistics, and incoming call distribution. It also shows the inbound call queue in a tabular form.
The information display of the Active Calls in Queue can be configured by expanding Settings at the top of the panel area; this allows you to specify which charts to display and in which mode, as well as customize some of the chart colors.
Refer to the following picture.
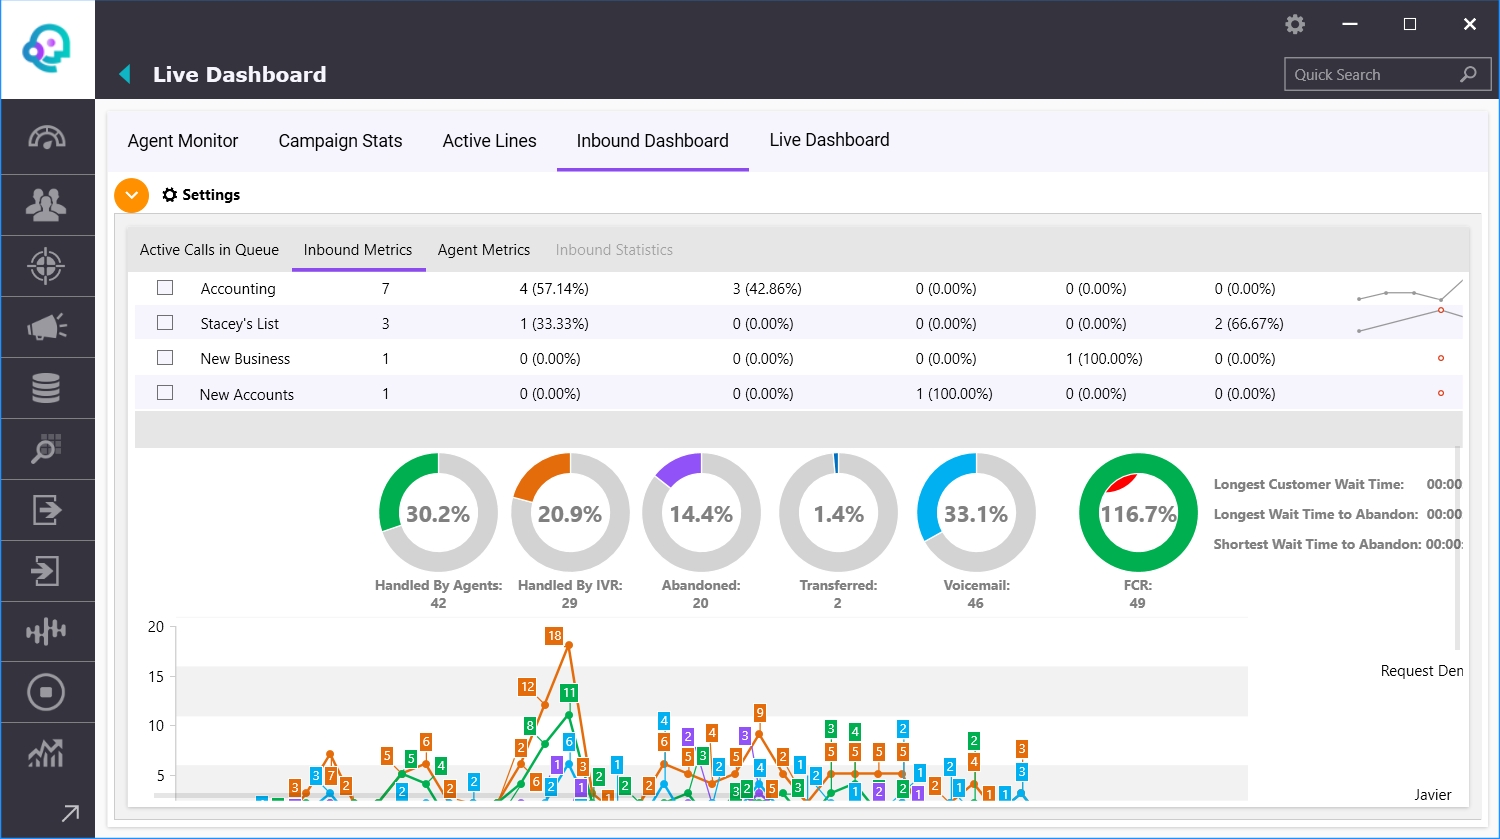
The Inbound Metrics tab provides a healthy amount of statistics on Inbound Calls. On the top, a Metrics Grid provides statistics in a tabular form, grouped either by Campaign or Source (DID).
Below that, charts provide Metrics Total, which show amount and percentage of calls for each handling method; it also includes the First Call Resolution (FCR) value and its ratio over Handled By Agents. In addition, it provides longest and shortest Wait Time information.
The information display of the Inbound Metrics can be configured by expanding Settings at the top of the panel area; this allows you to specify which charts to display and in which mode, as well as what information to include on them.
Refer to the following picture.
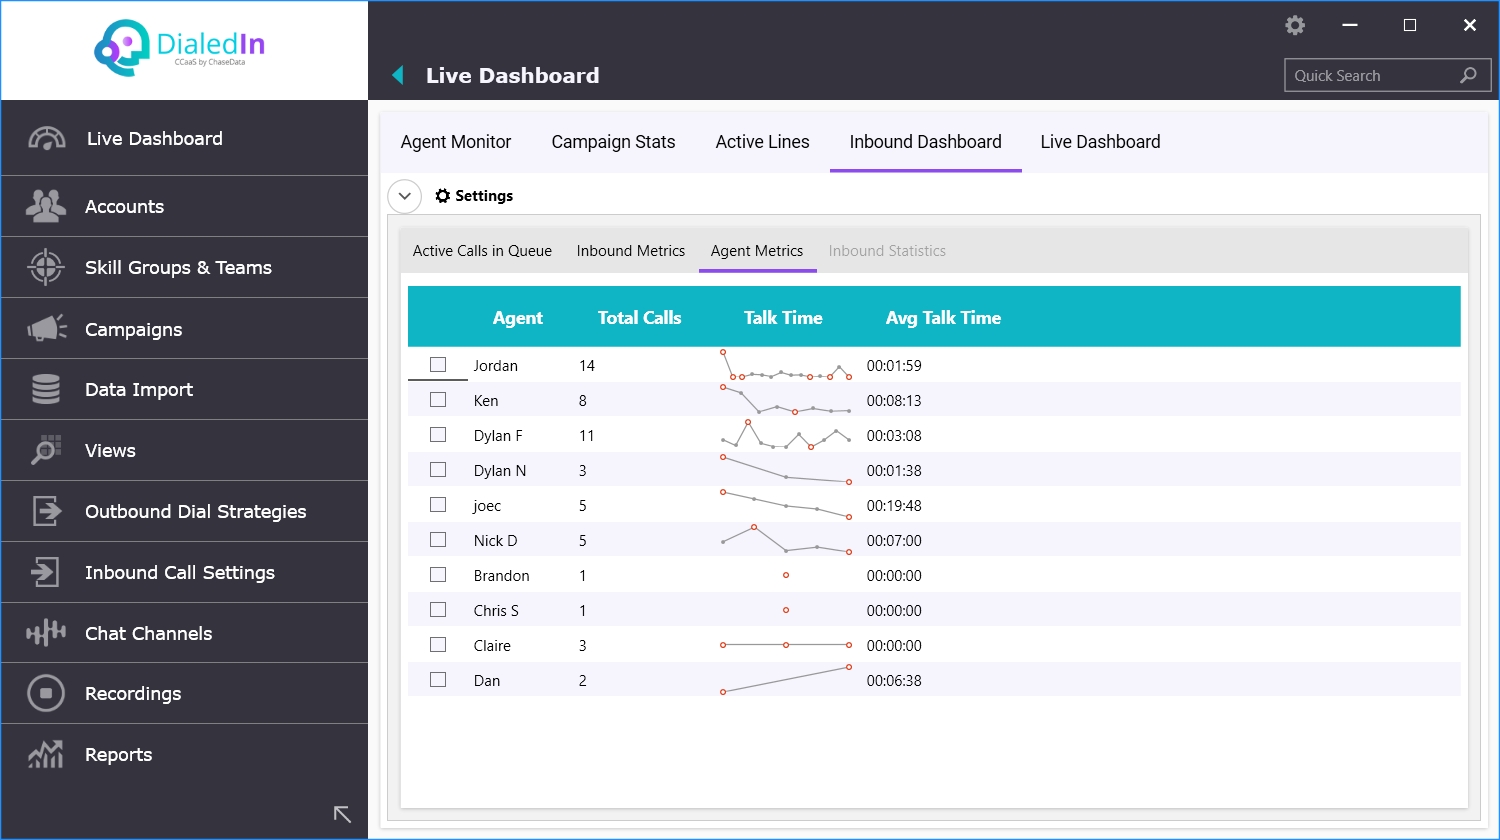
The Agent Metrics tab provides statistics for each Agent, related to number of calls and talk time. Refer to the following picture.
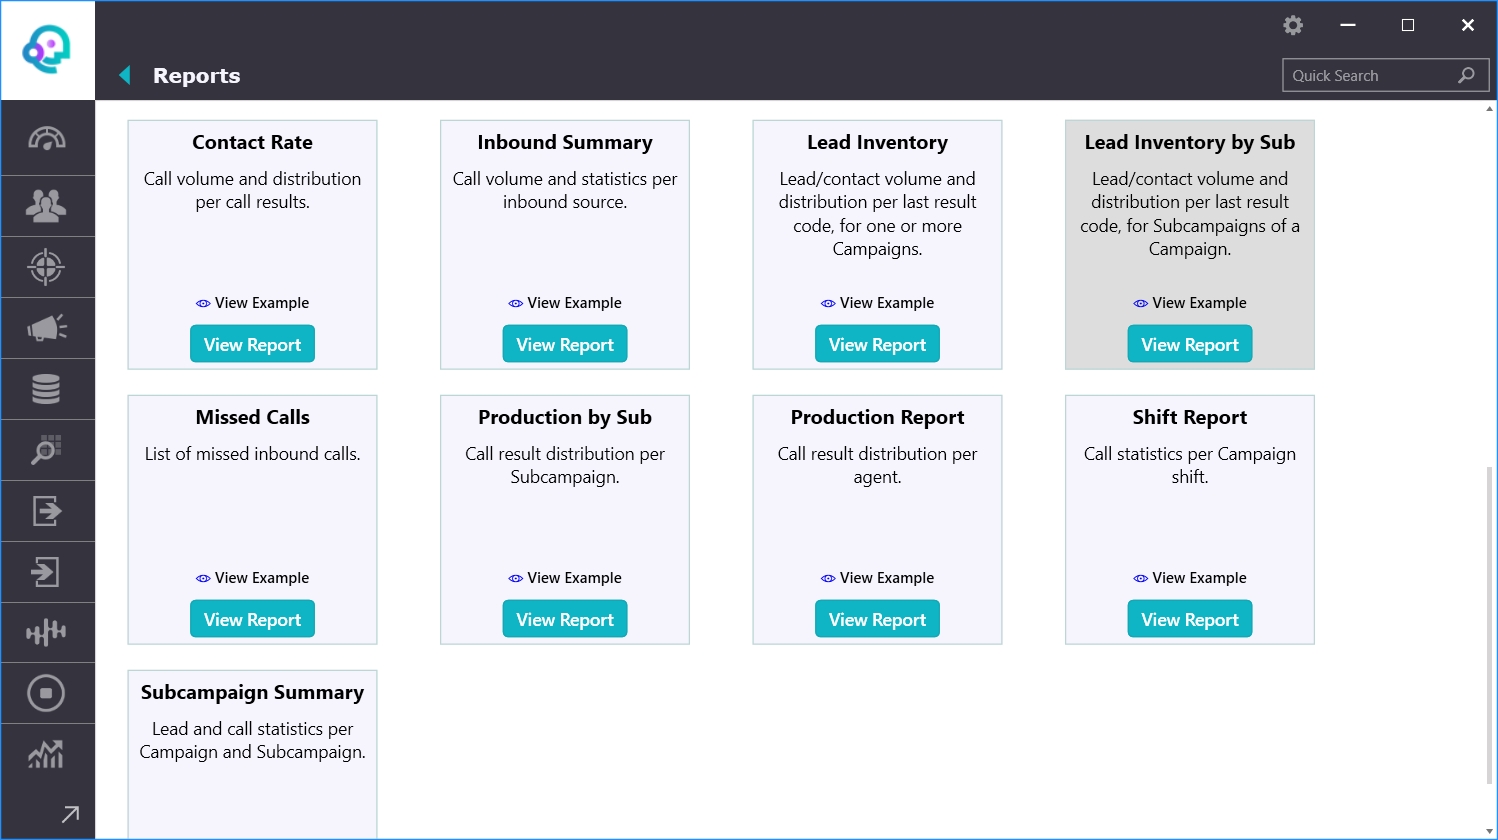
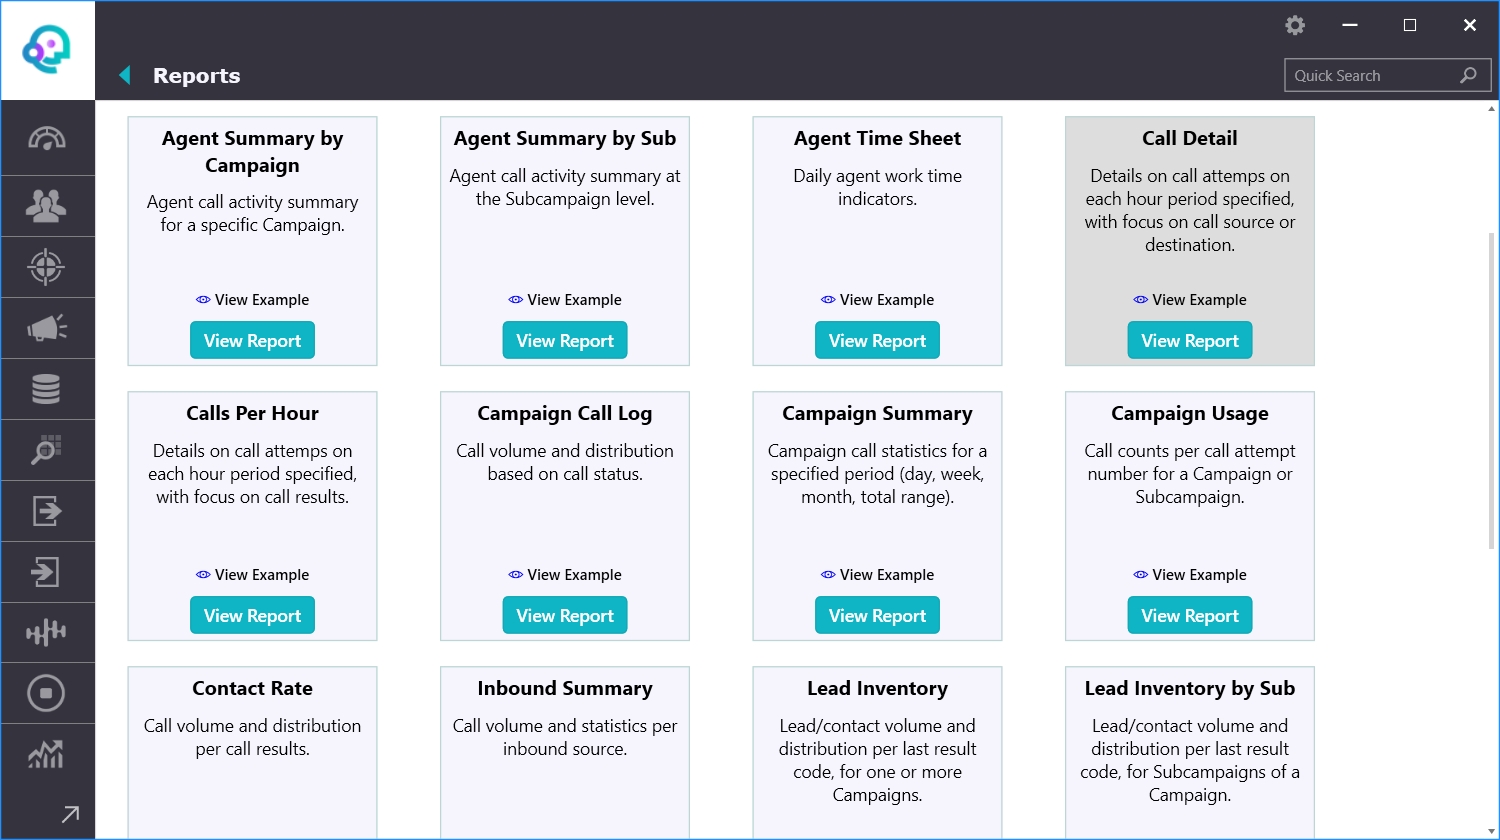
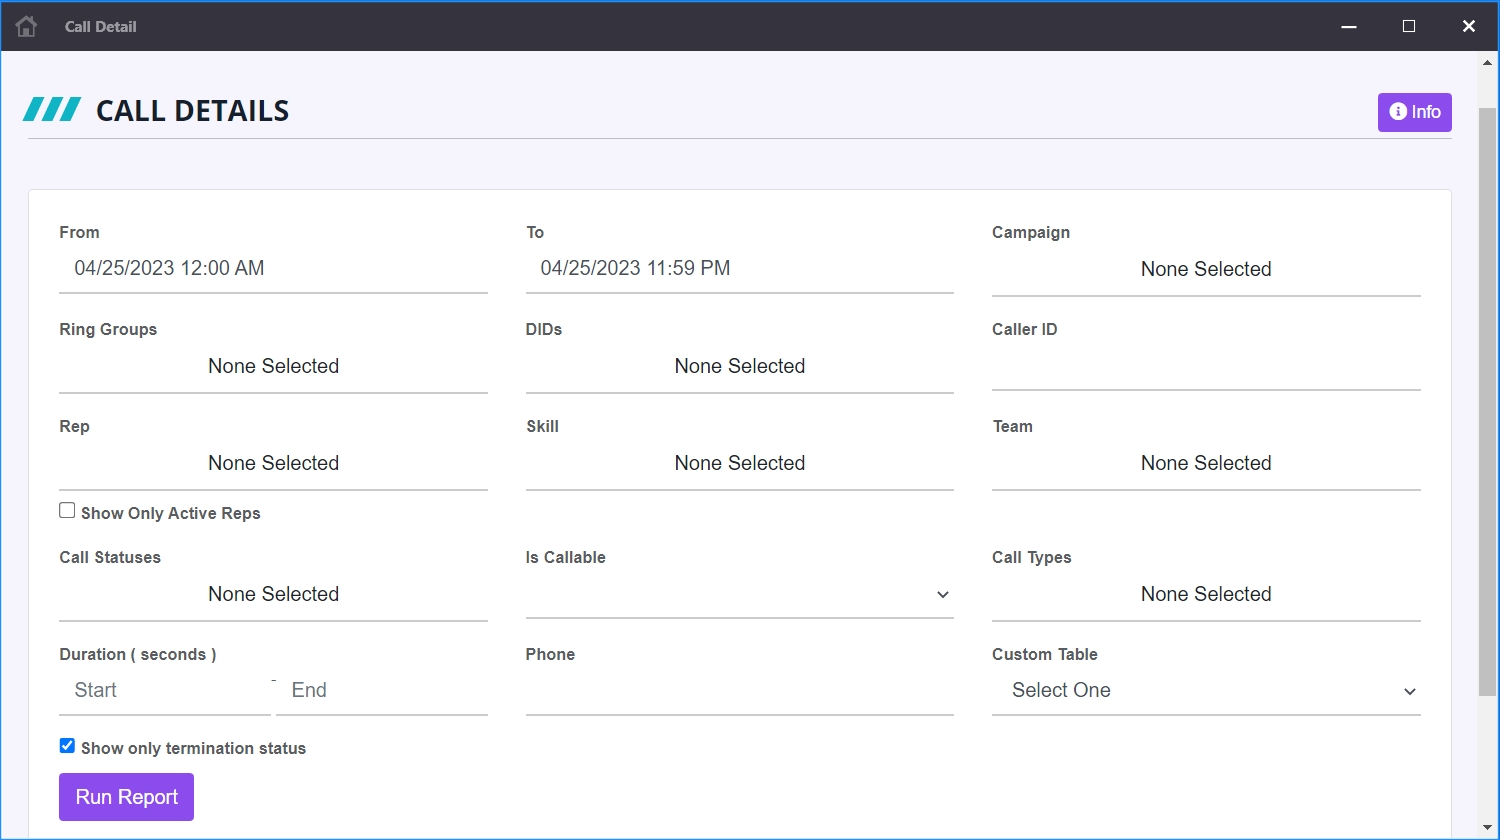
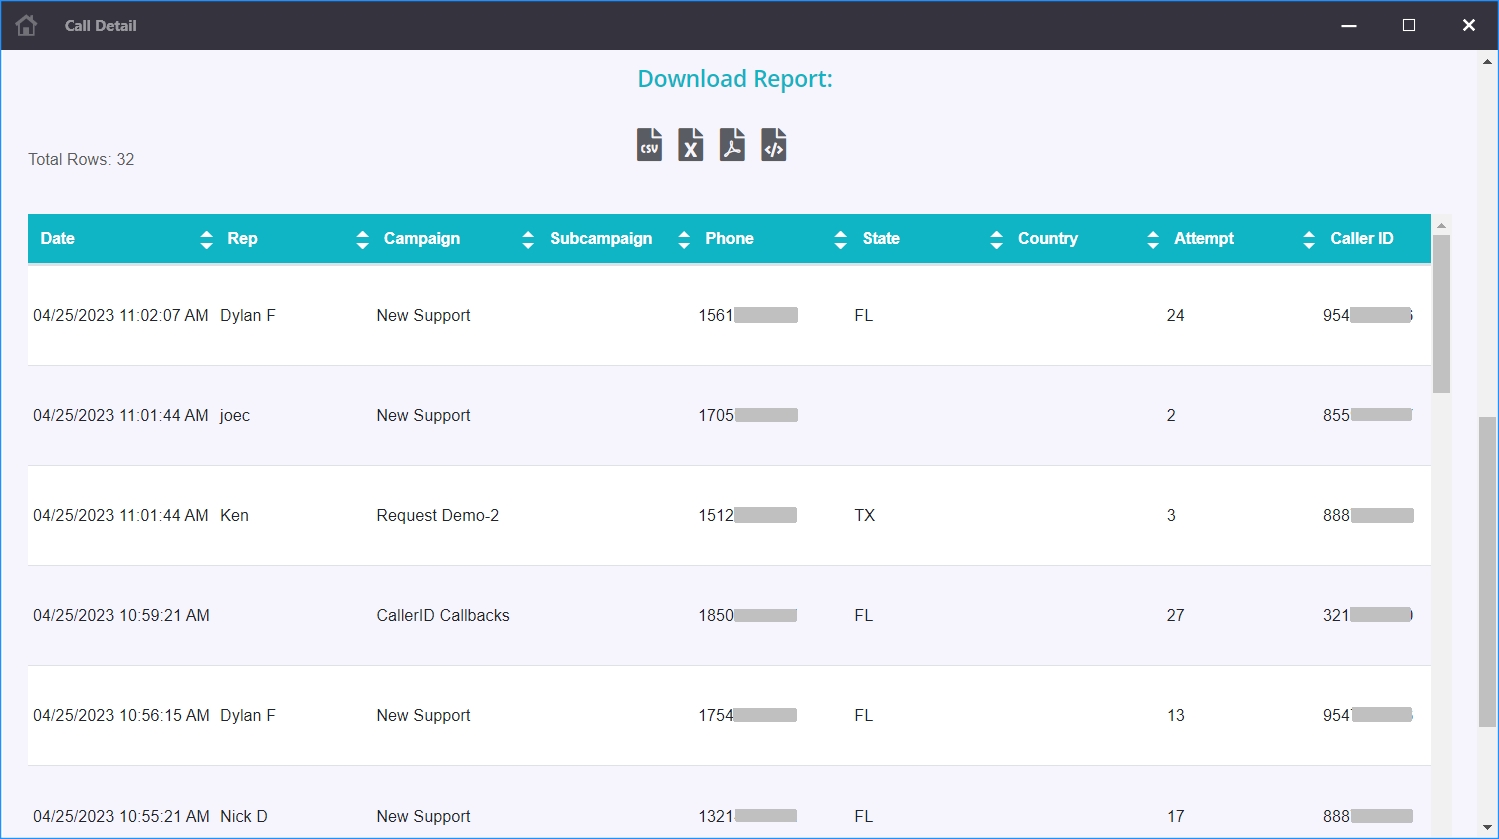
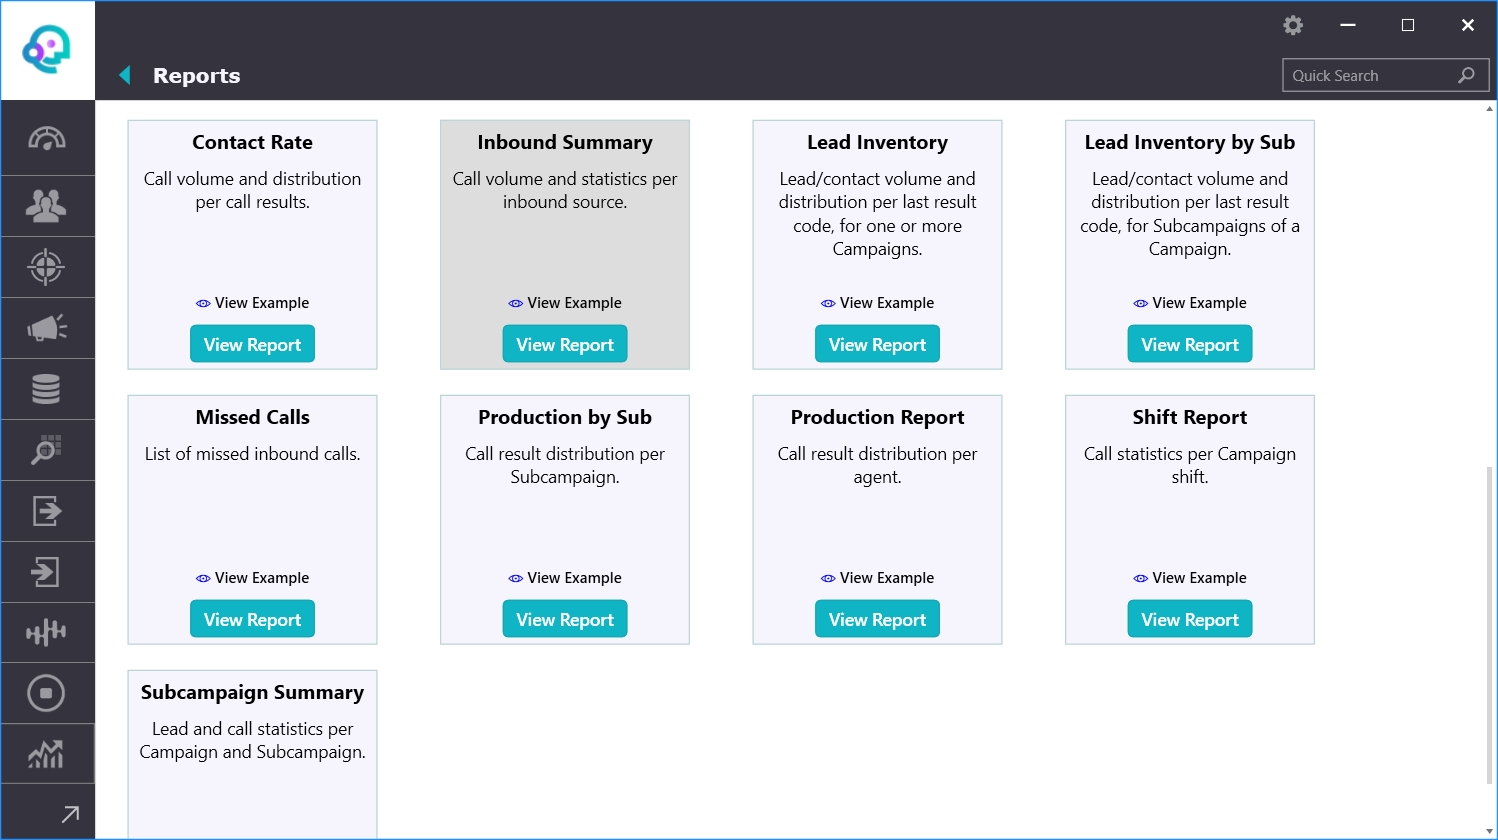
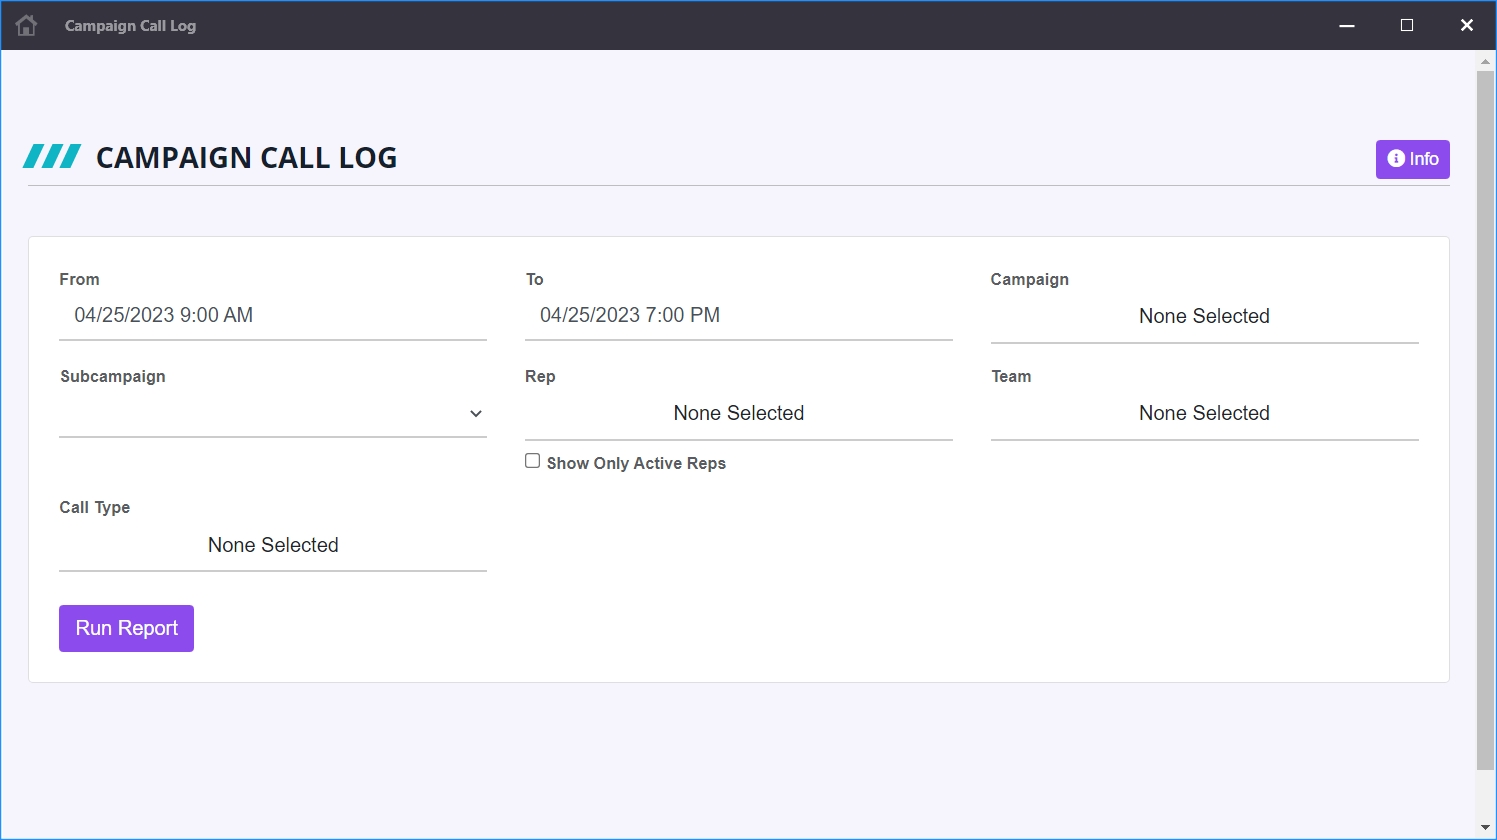
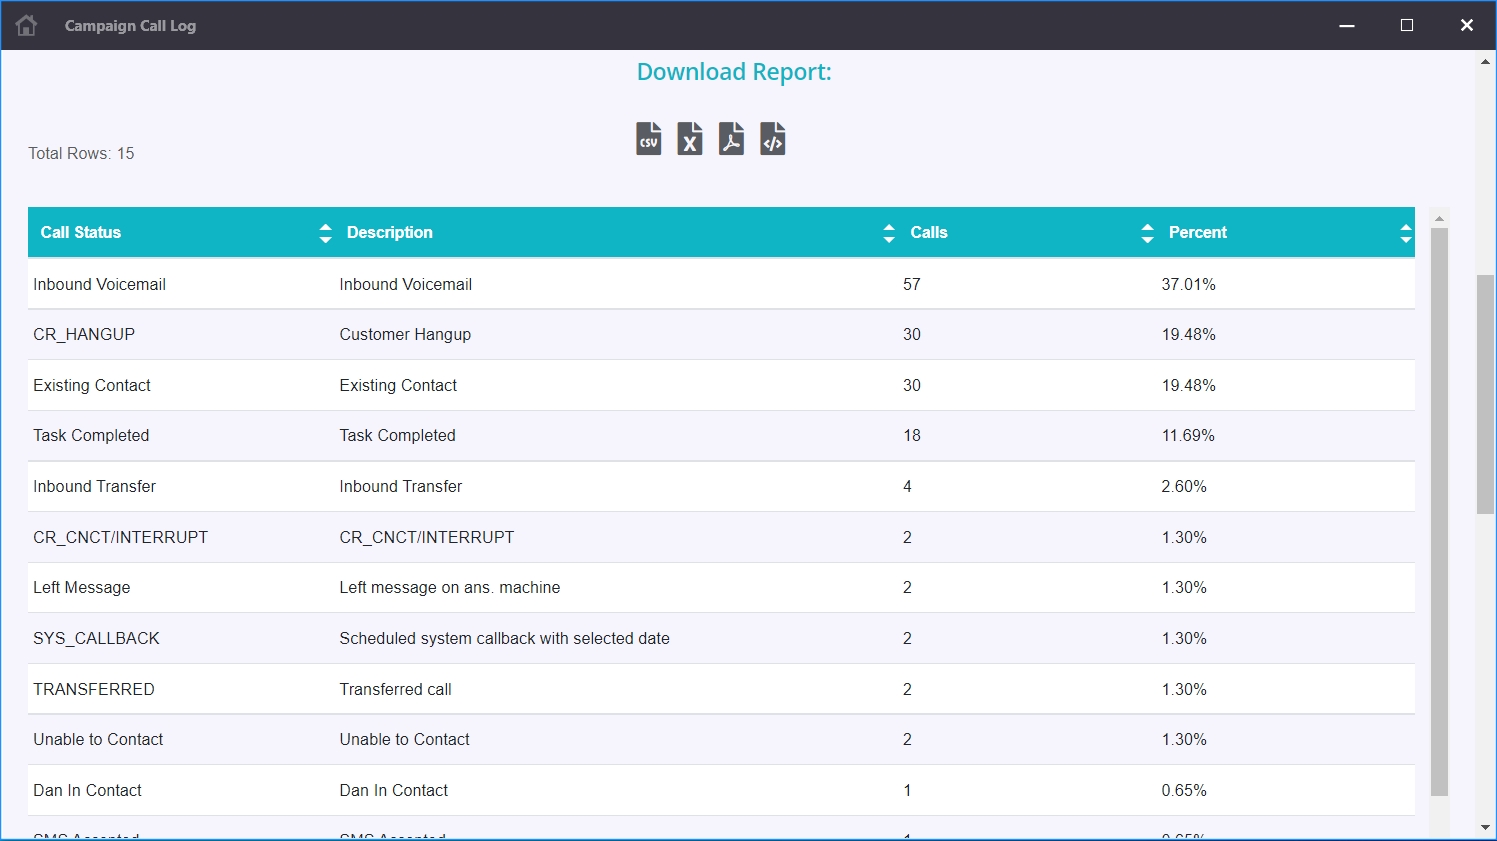
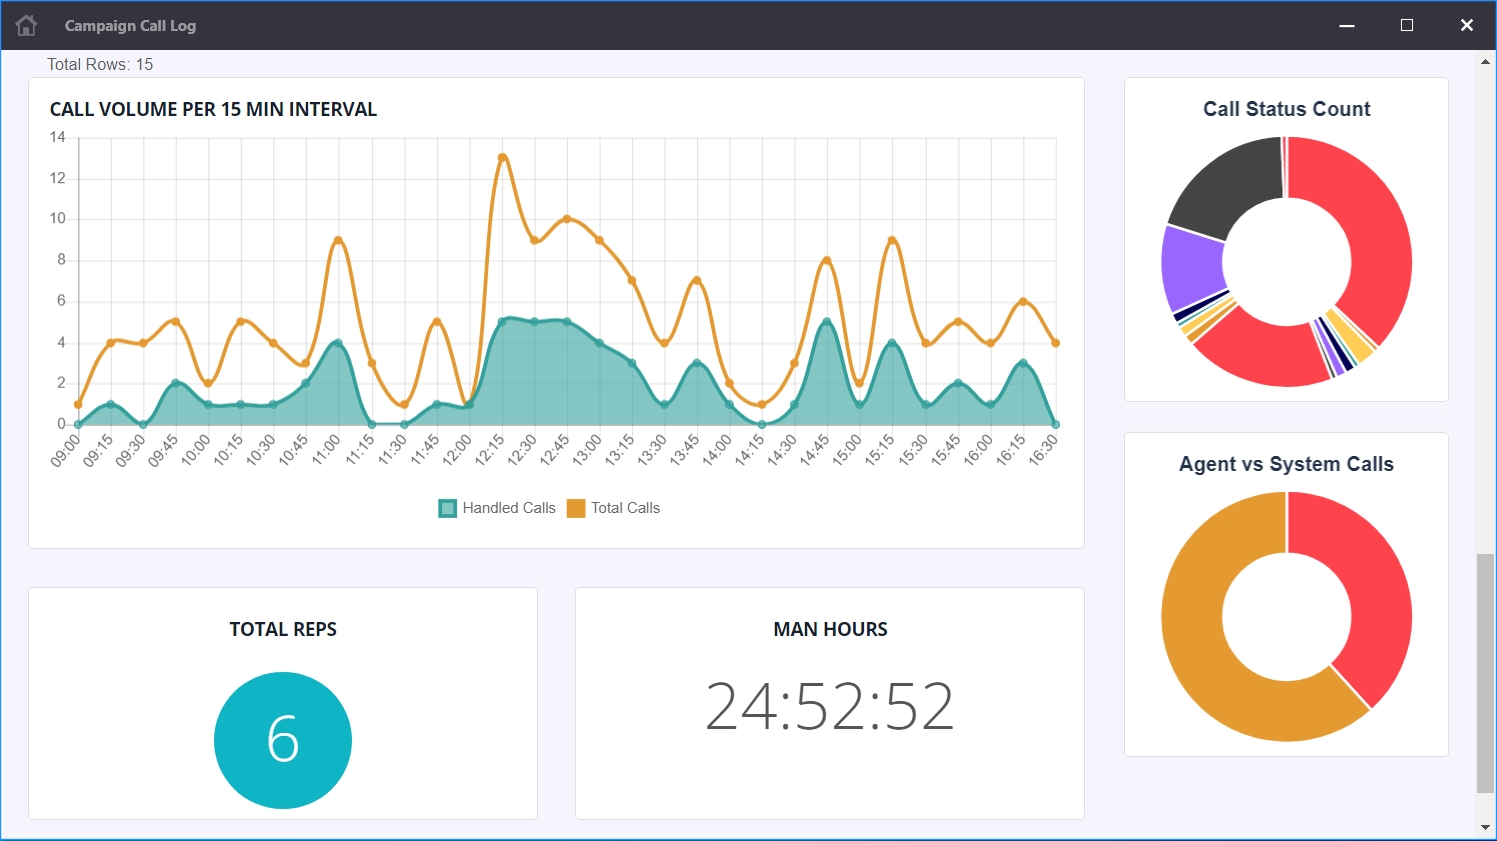
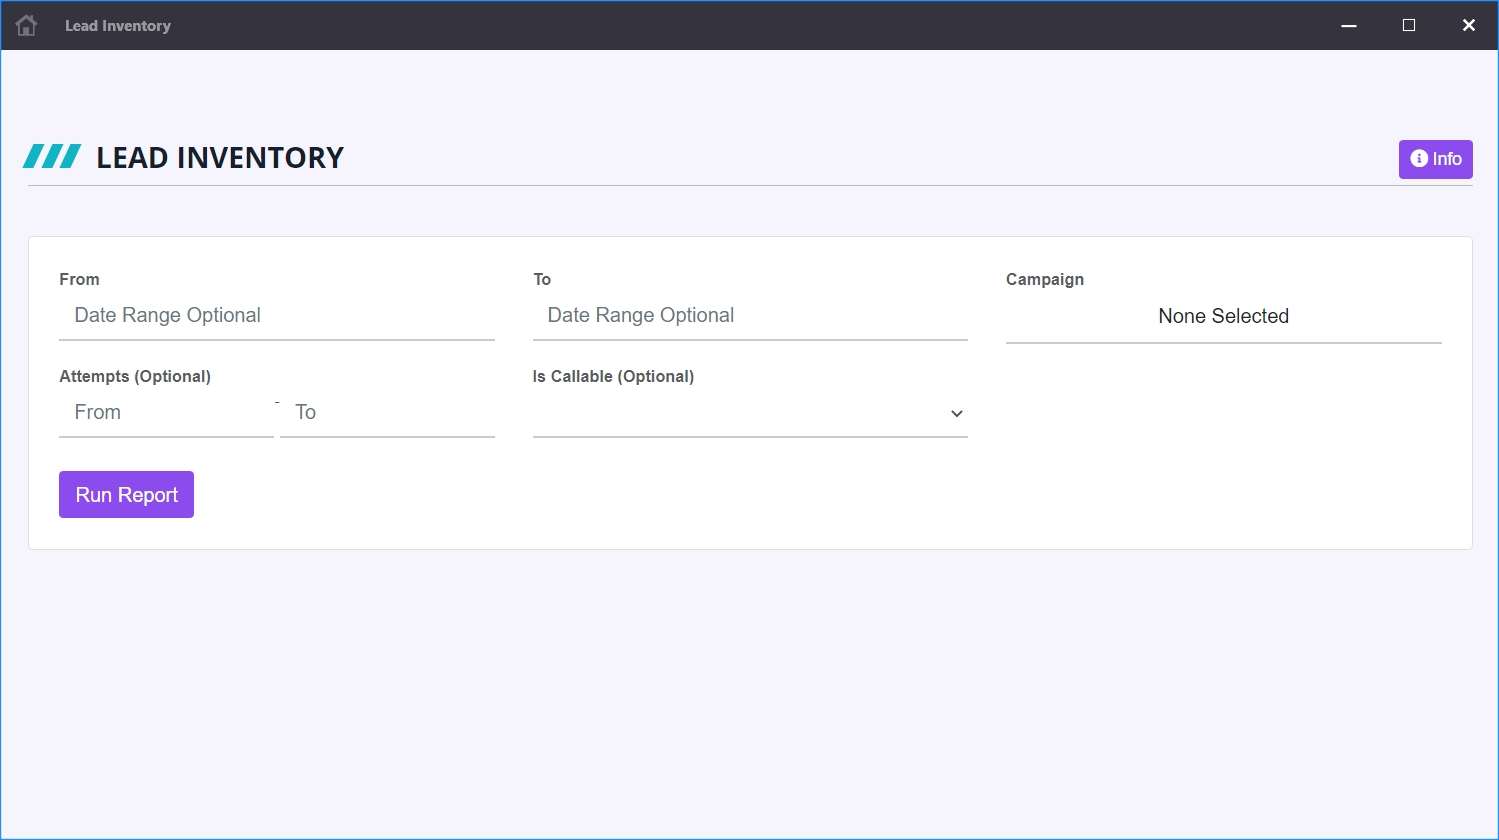
The purpose of this report is to list call records, with typical details, based on a specified criterion. The expectation is that customers usually want to review call records for a particular campaign within a date range. Other filters are provided for the customer to fine tune their target list.
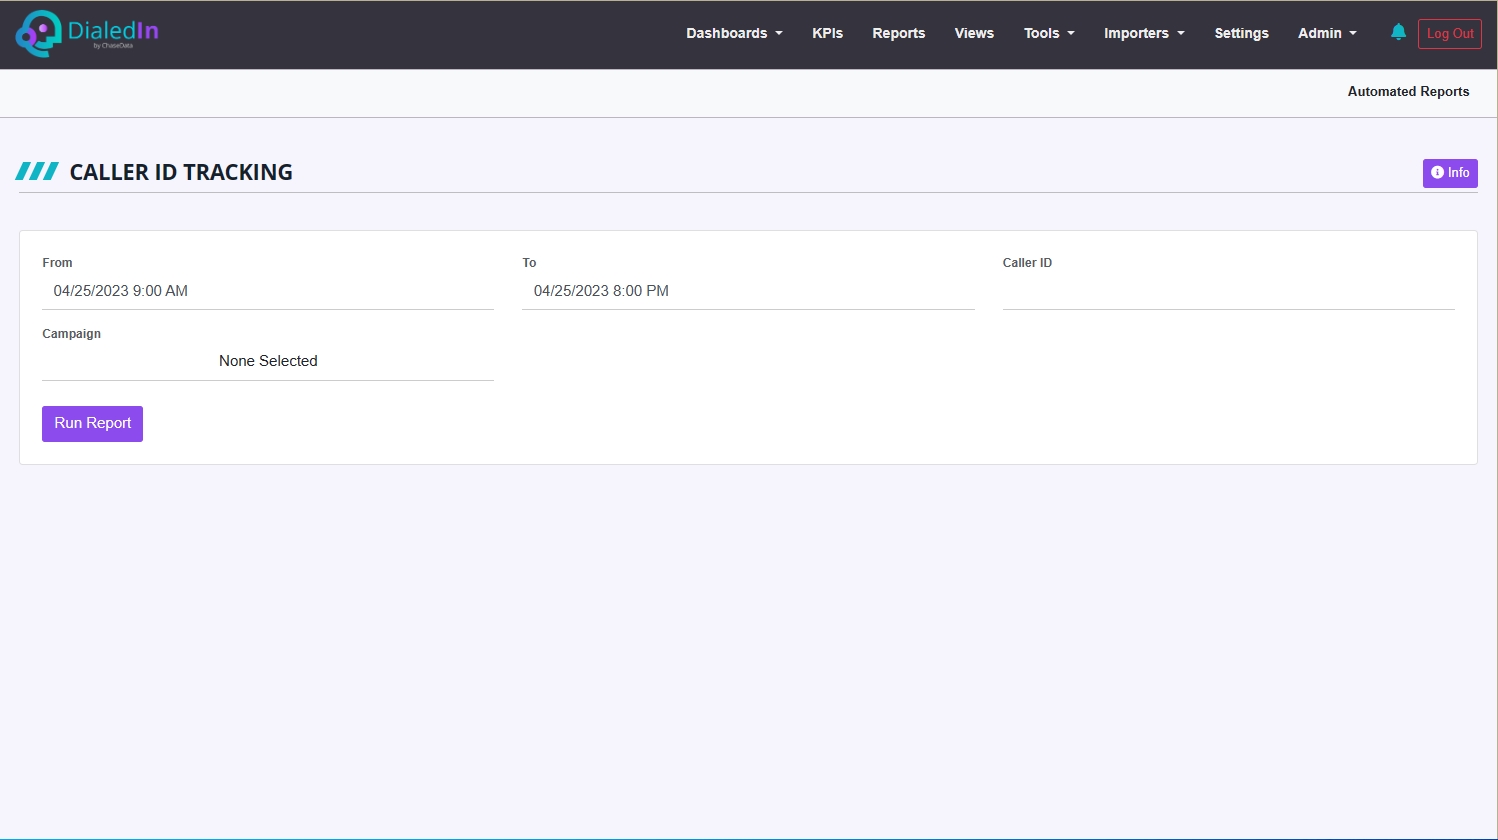
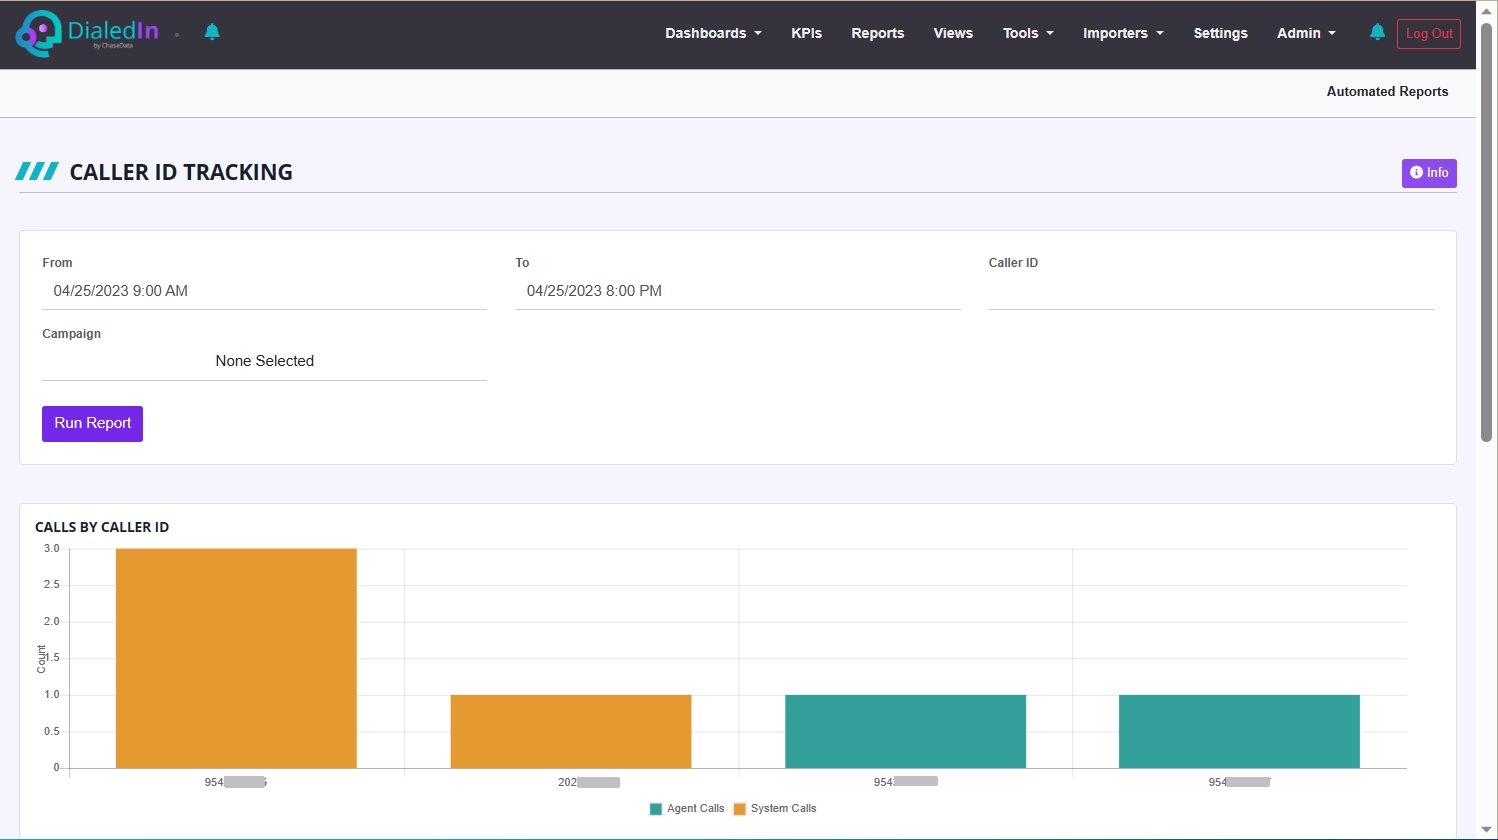
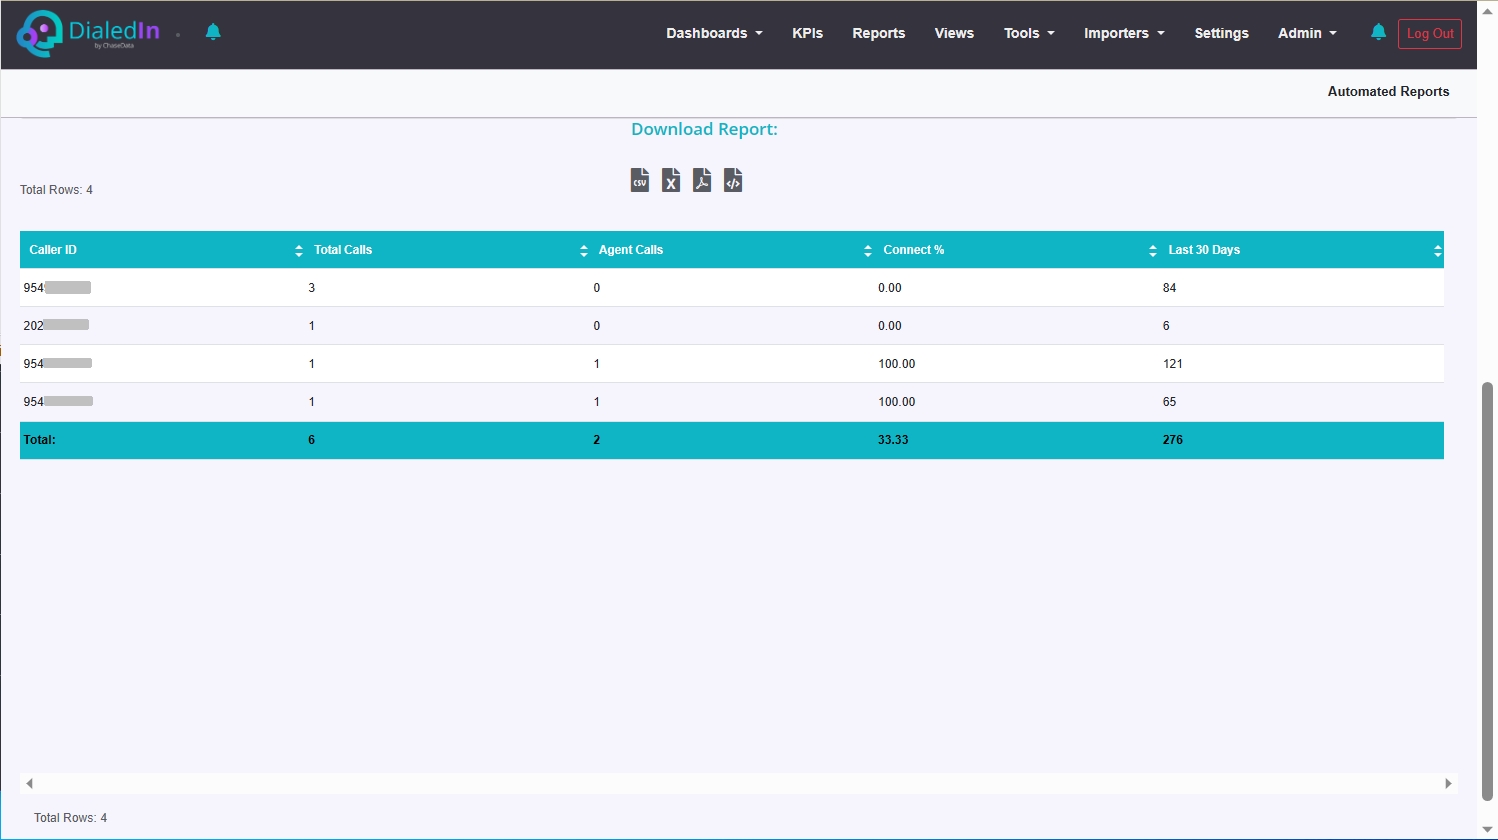
The purpose of this report is to present all telephone numbers that were used as Caller ID for calls in the specified date/time range, providing aggregated number of calls.
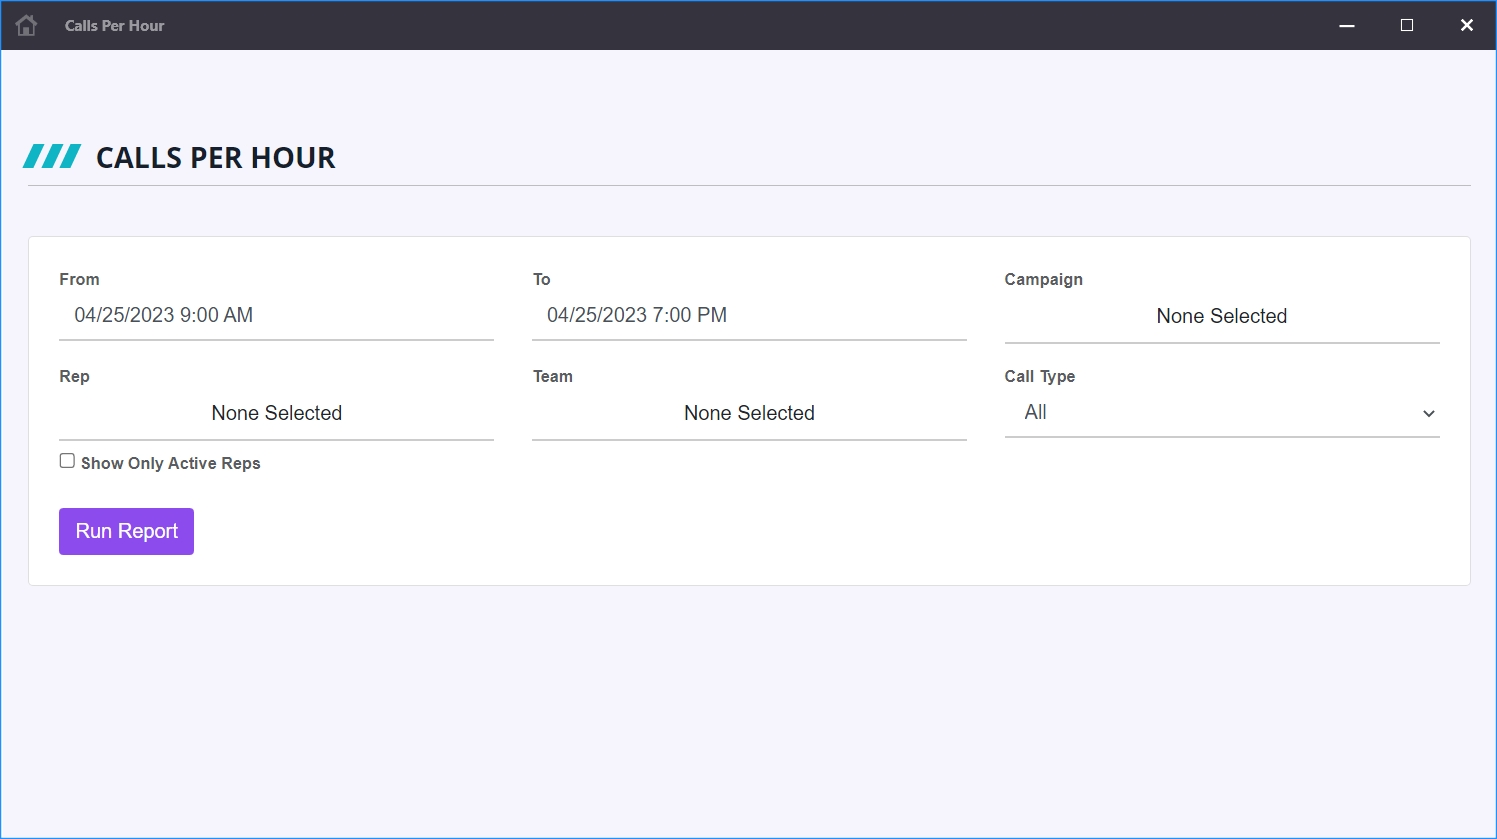
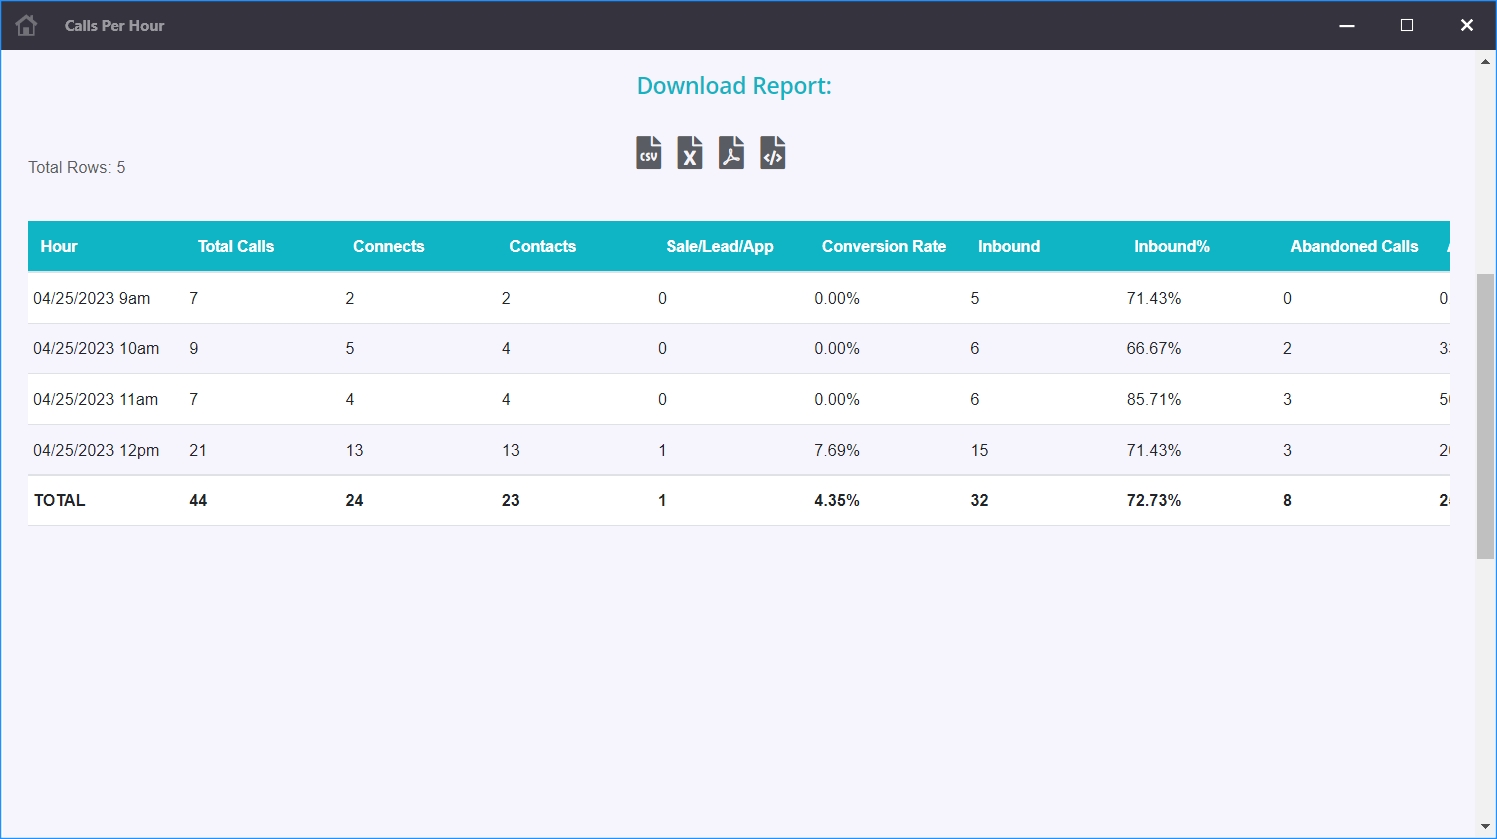
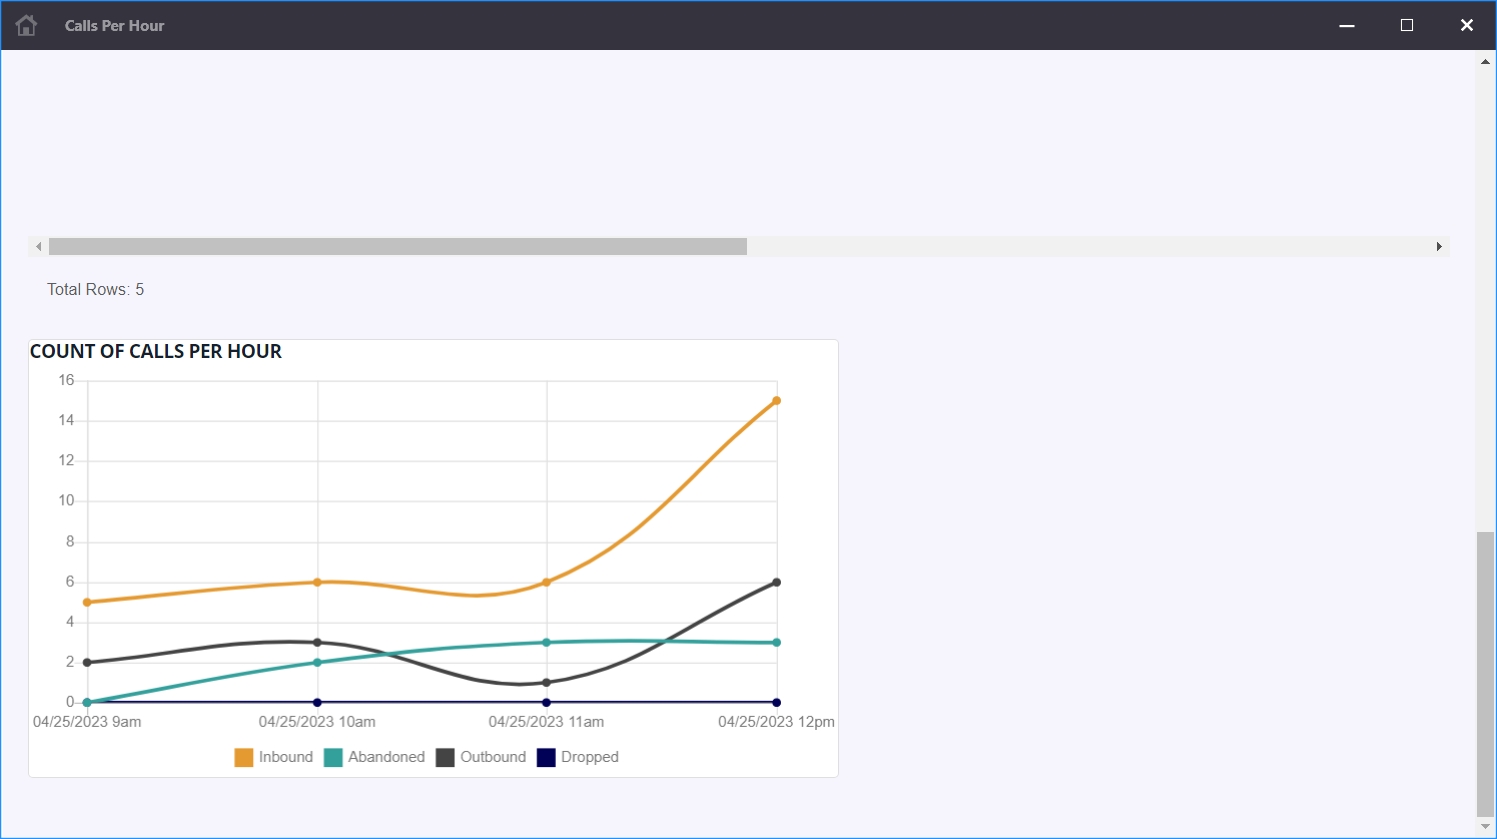
The purpose of this report is to show how call volume fluctuates over each hour of the day.
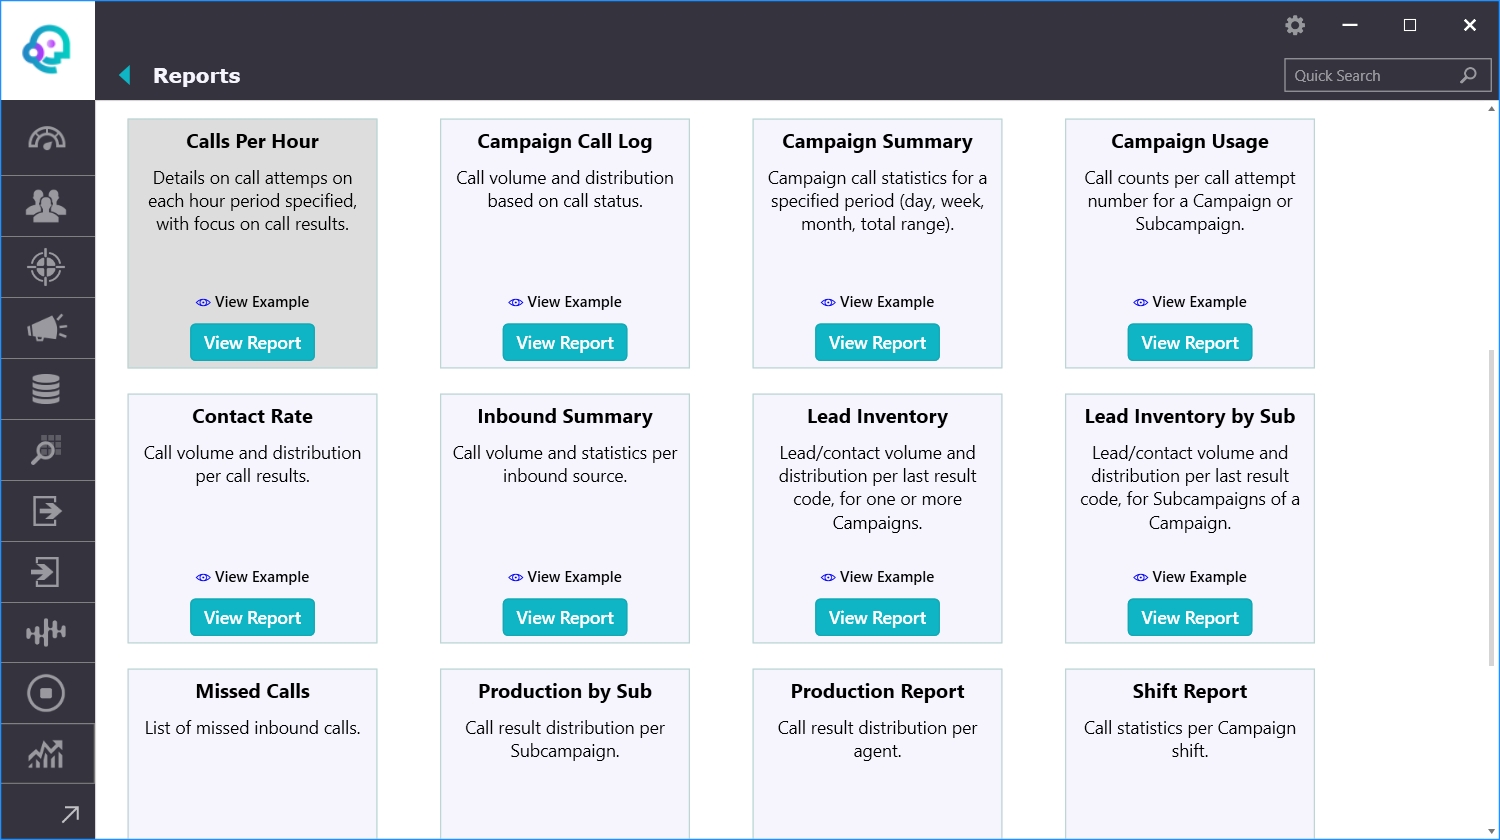
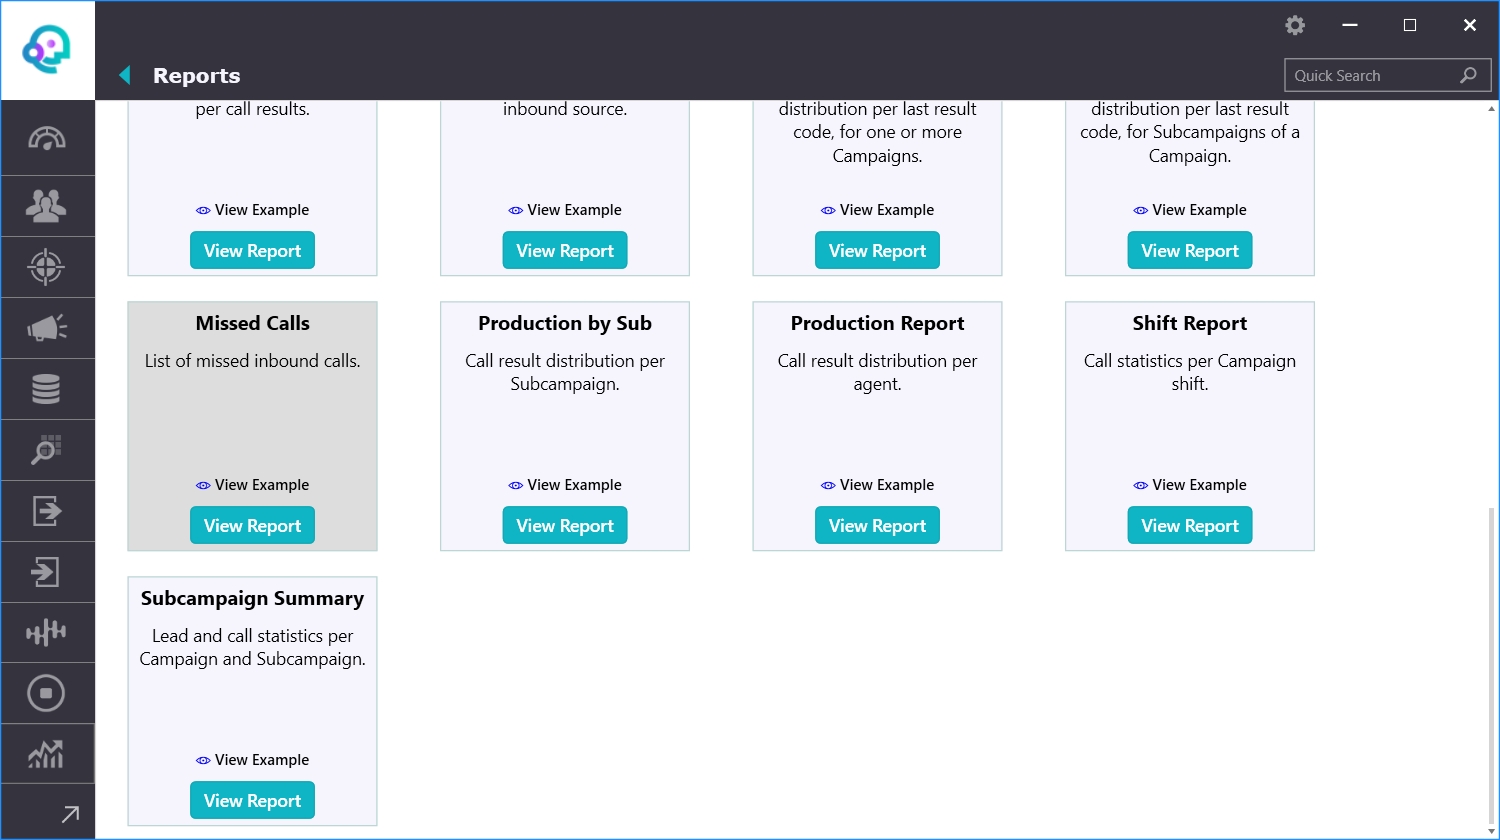
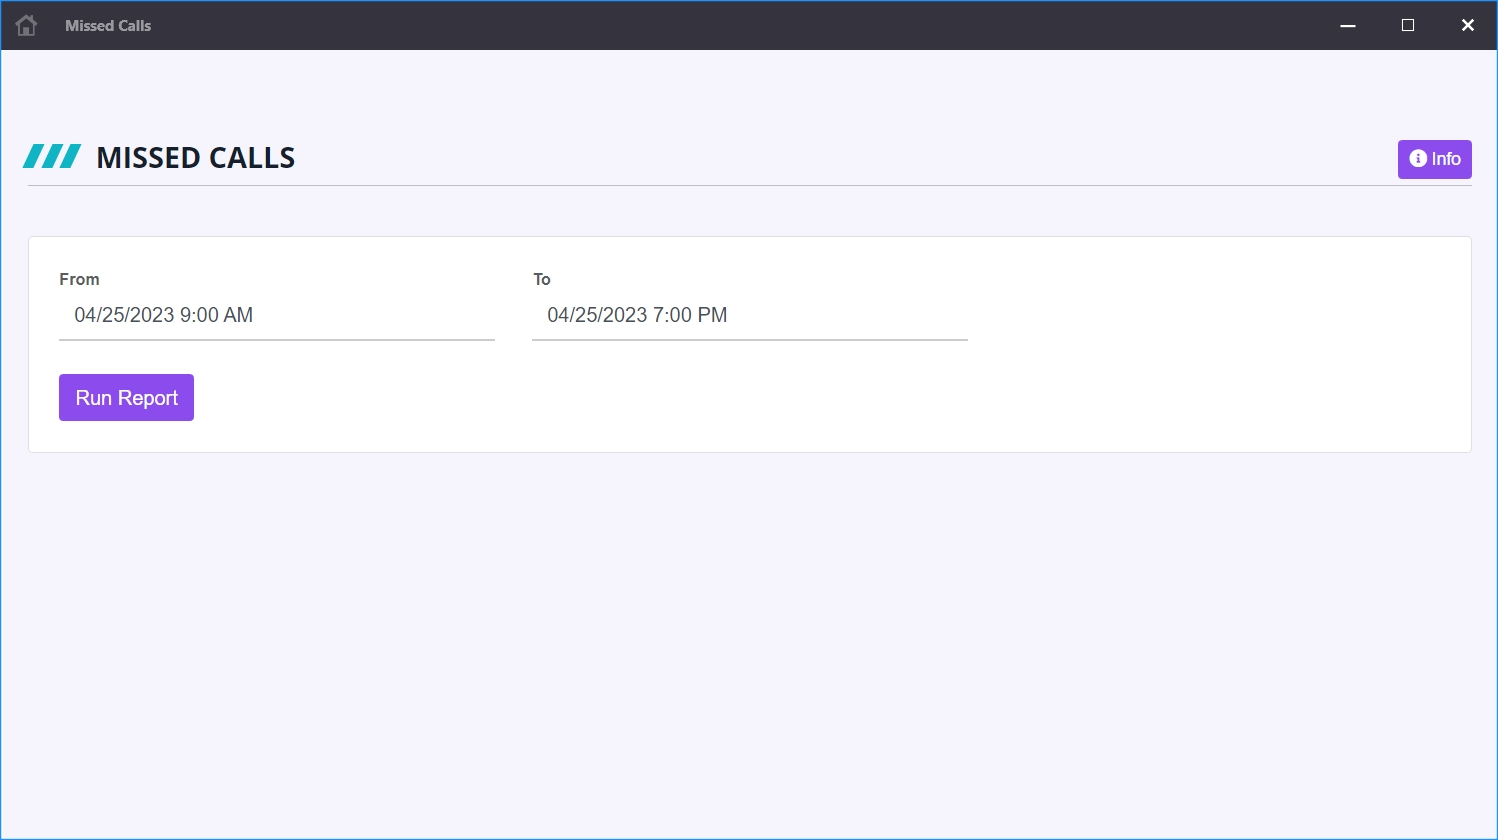
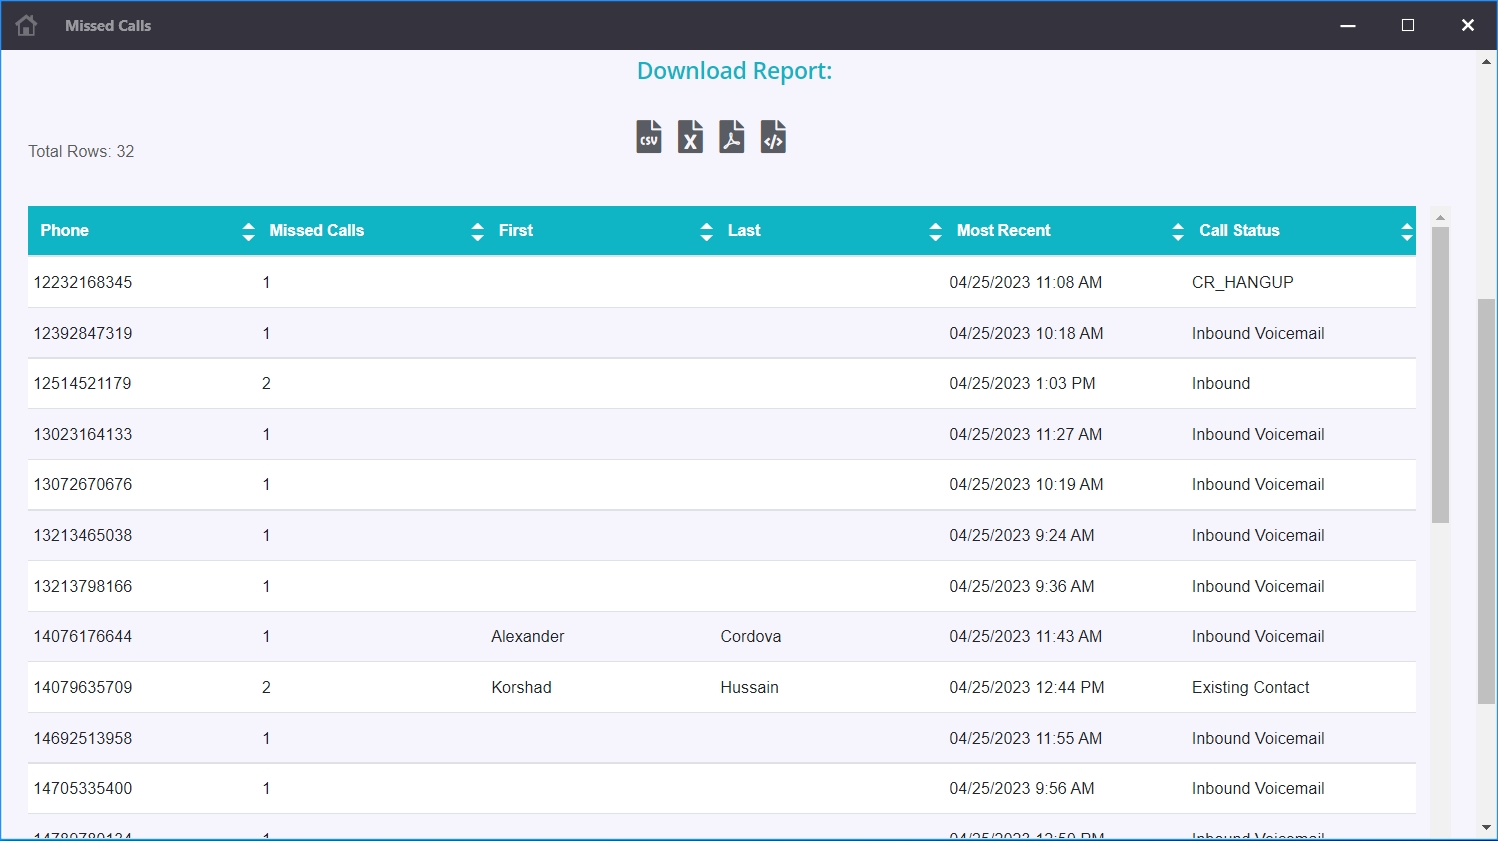
The purpose of this report is to list phone numbers that have called in and where not answered by a live agent; either hang up or went to voicemail. Only calls that are associated with a lead with a non-blank last name and non-blank first name in record are included.
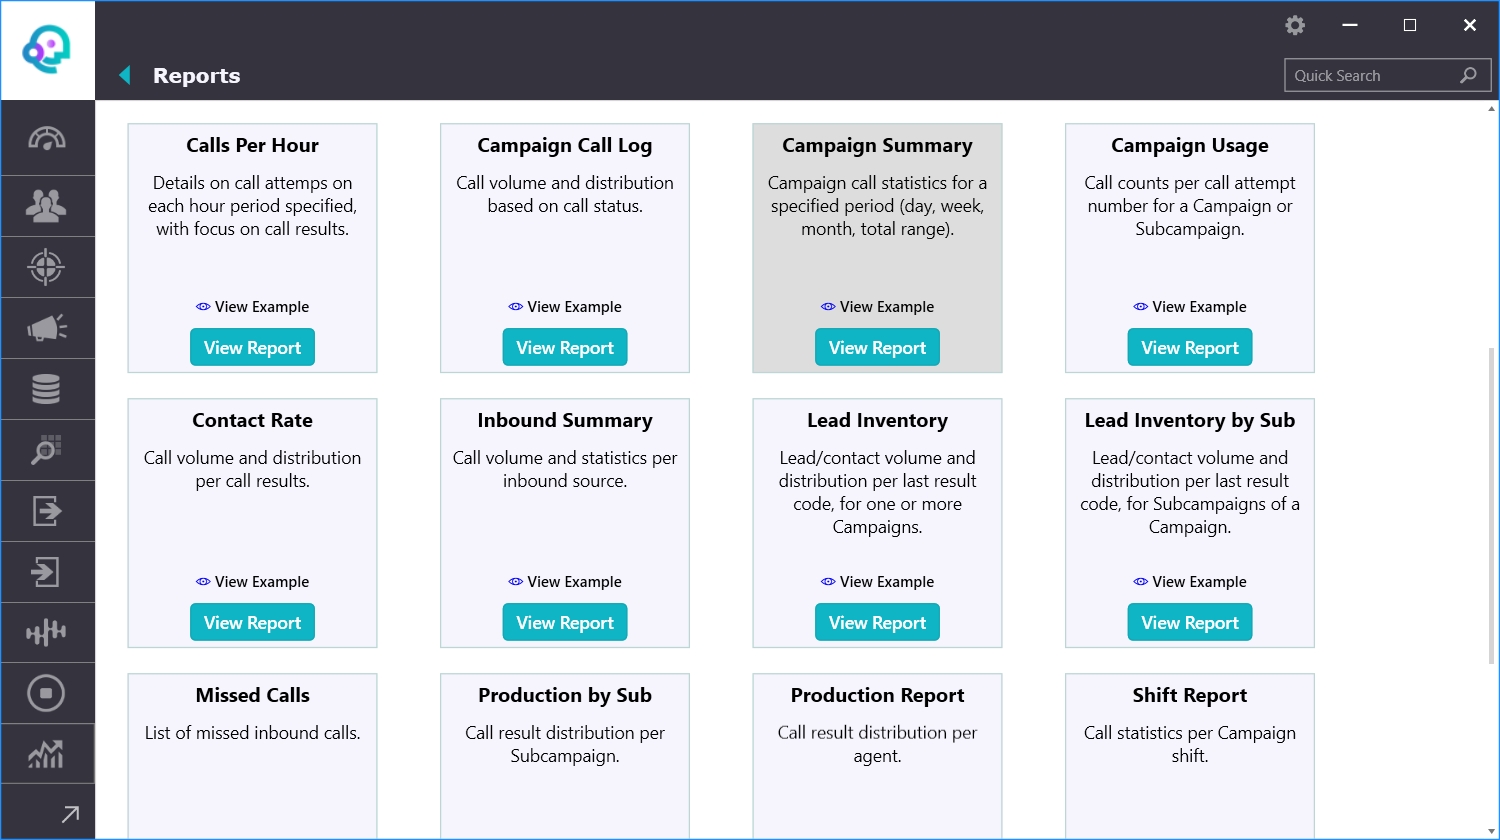
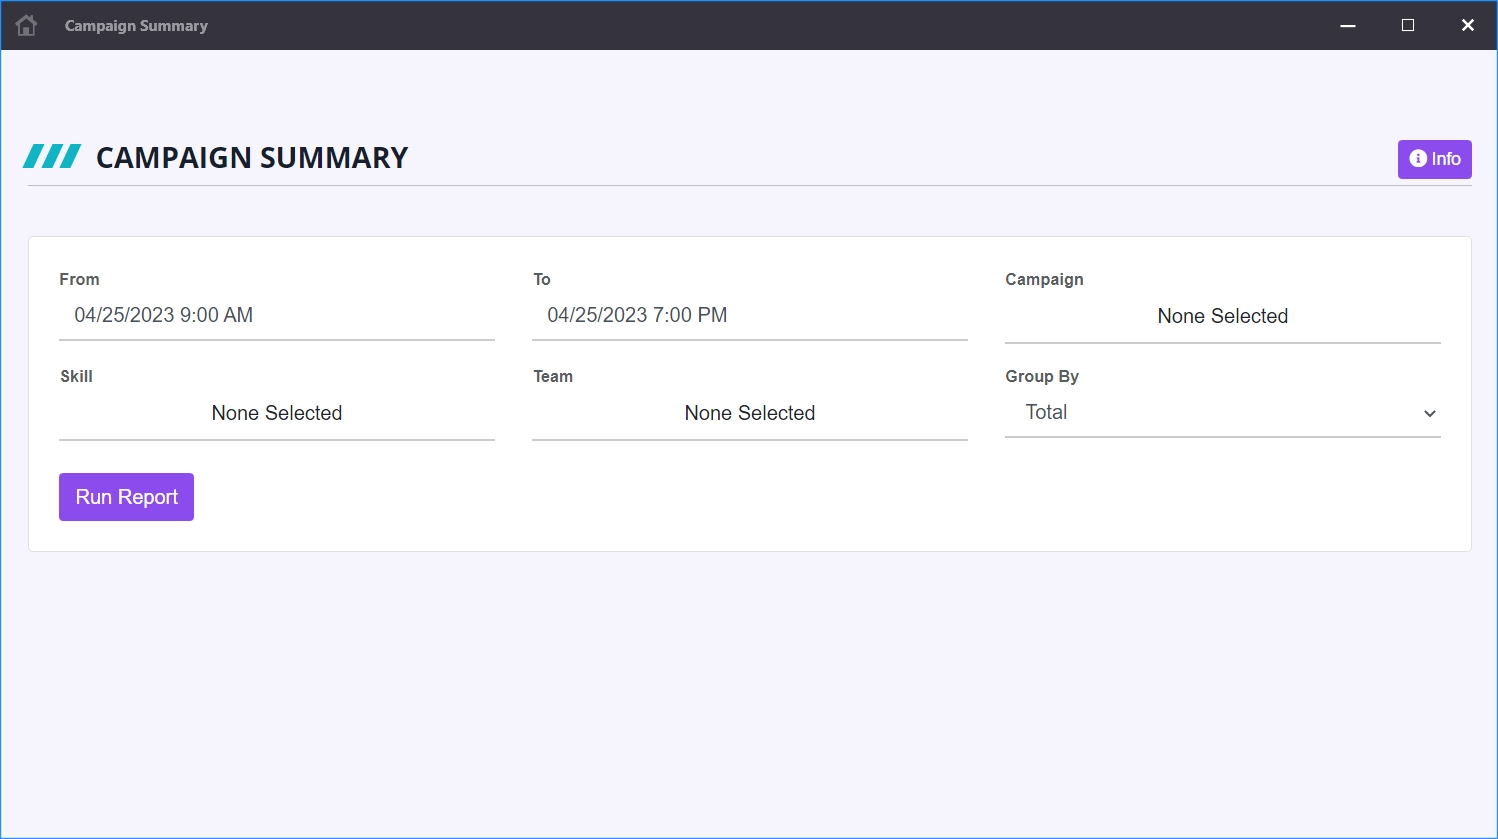
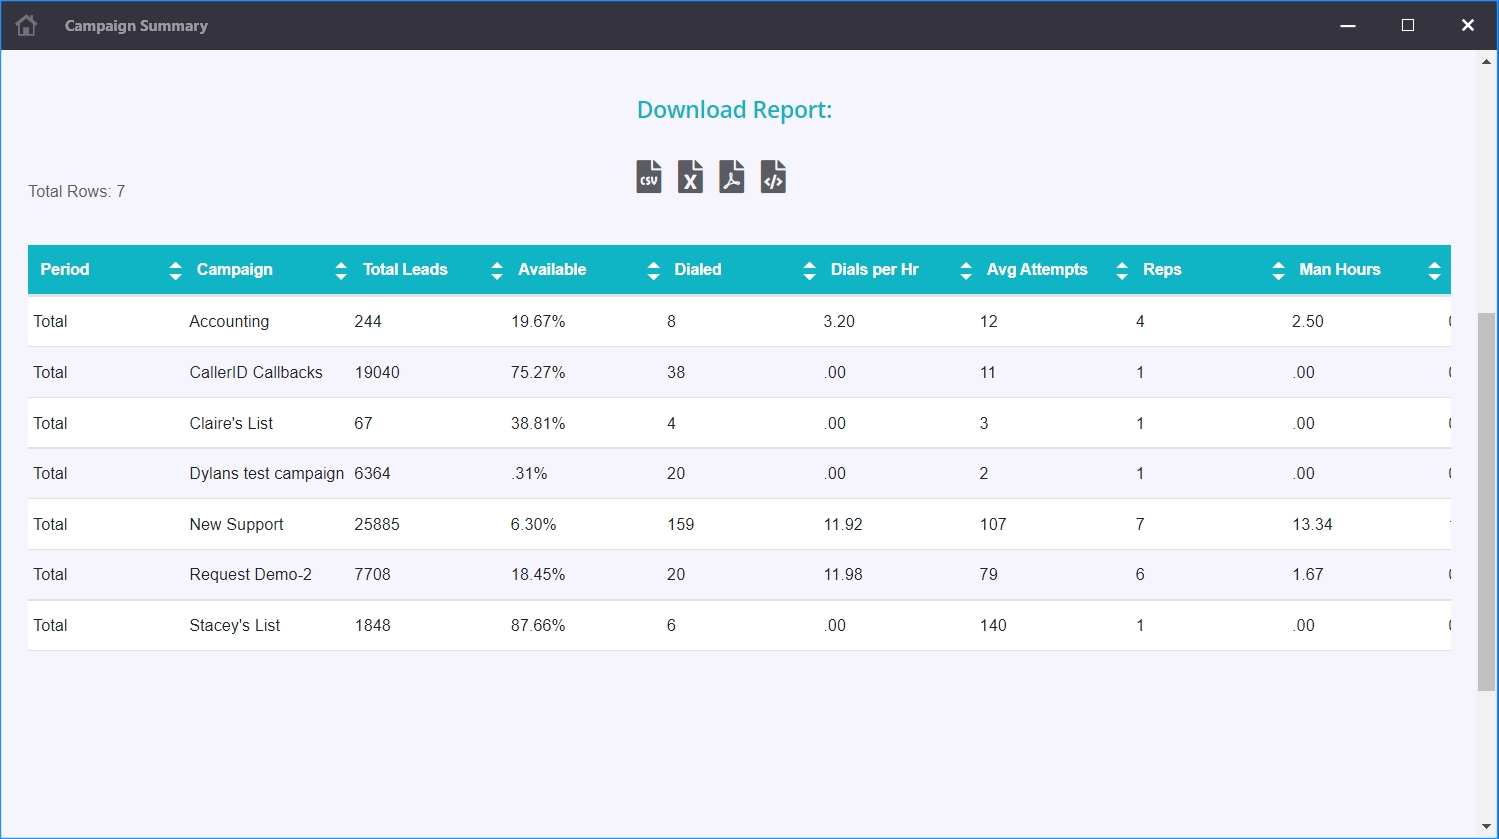
The purpose of this report is to provide key statistics about each active campaign, and, to some degree, provide indication of the effectiveness of those campaigns by focusing on data that compares quantity of calls versus their results.
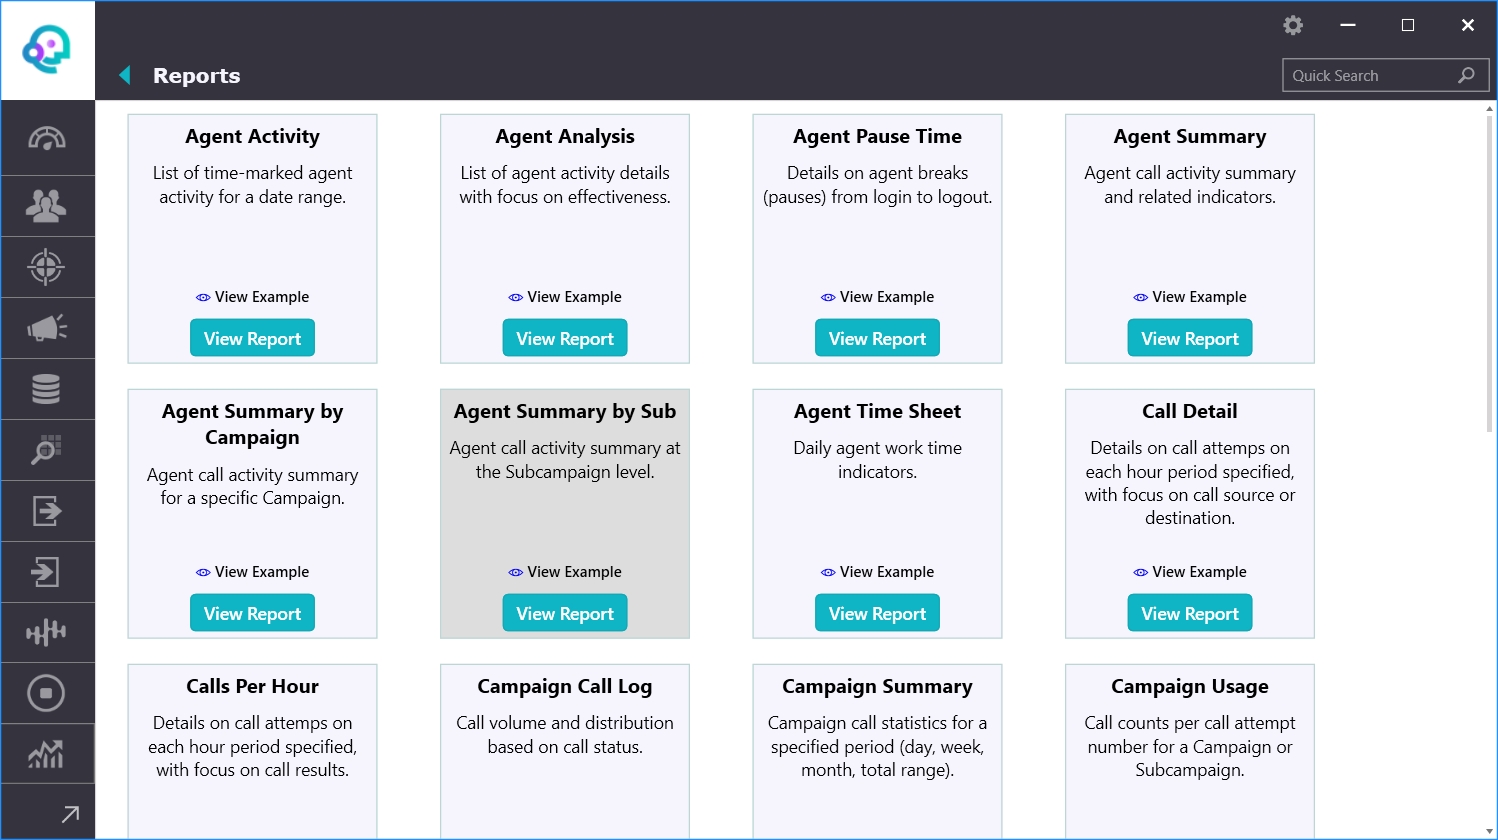
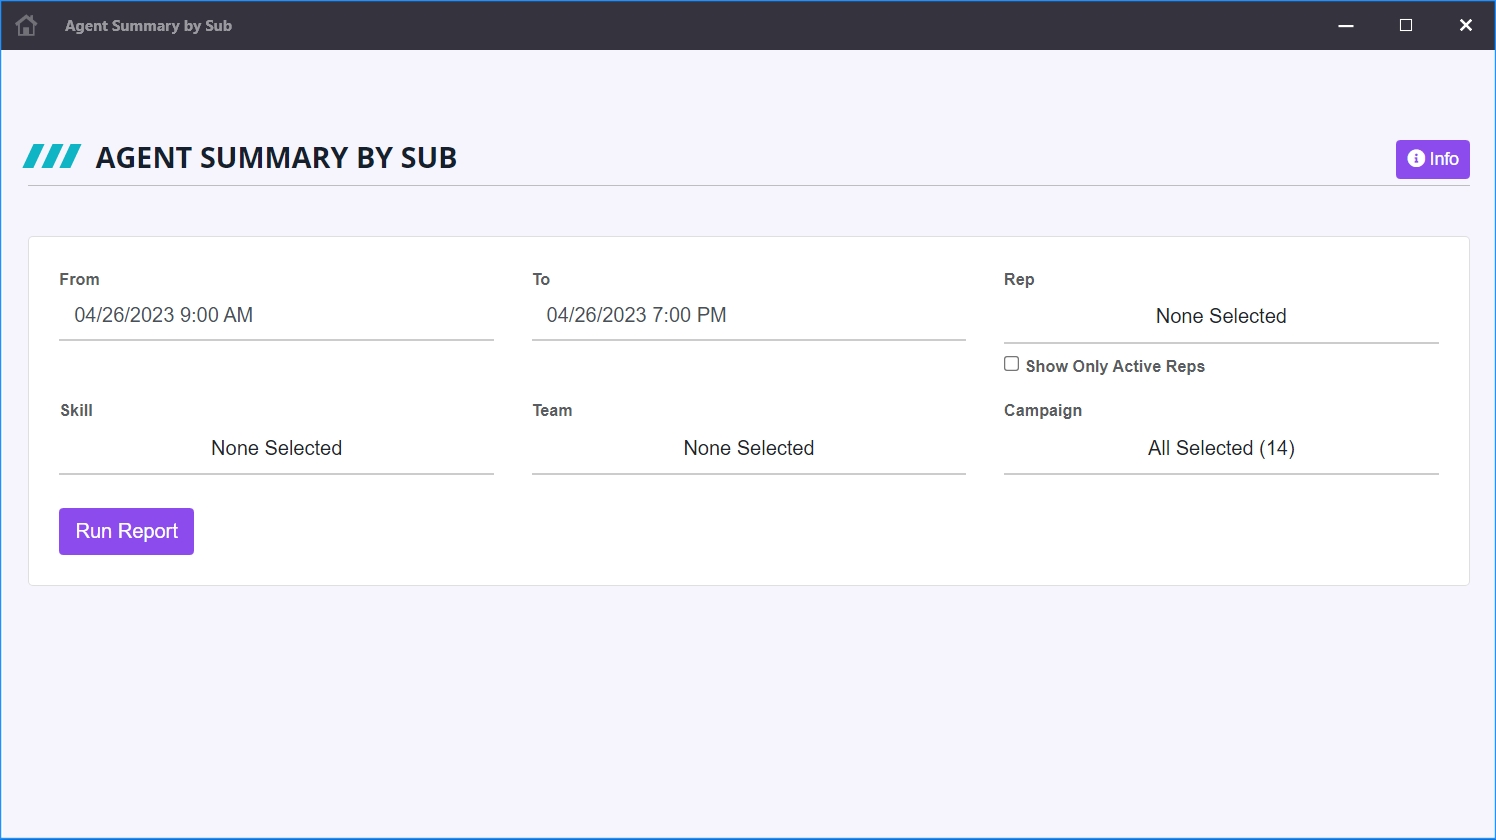
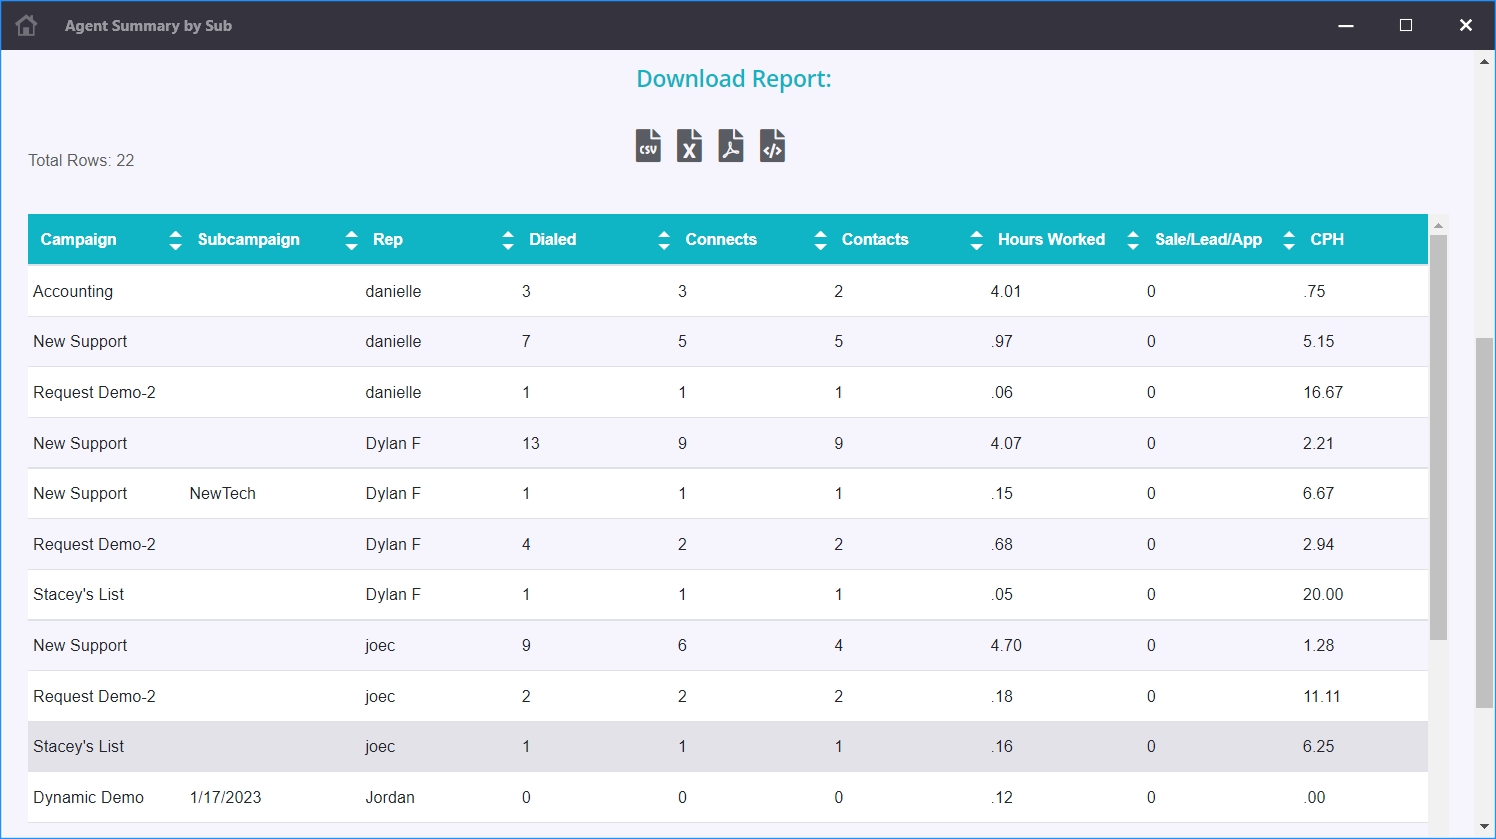
This is similar to the Campaign Summary Report, but broken down by sub-campaigns, when applicable. The purpose of this report is to provide key statistics about each active campaign and its sub-campaigns, if it has any, and, to some degree, provide indication of the effectiveness of those campaigns and sub-campaigns by focusing on data that compares quantity of calls versus their results.
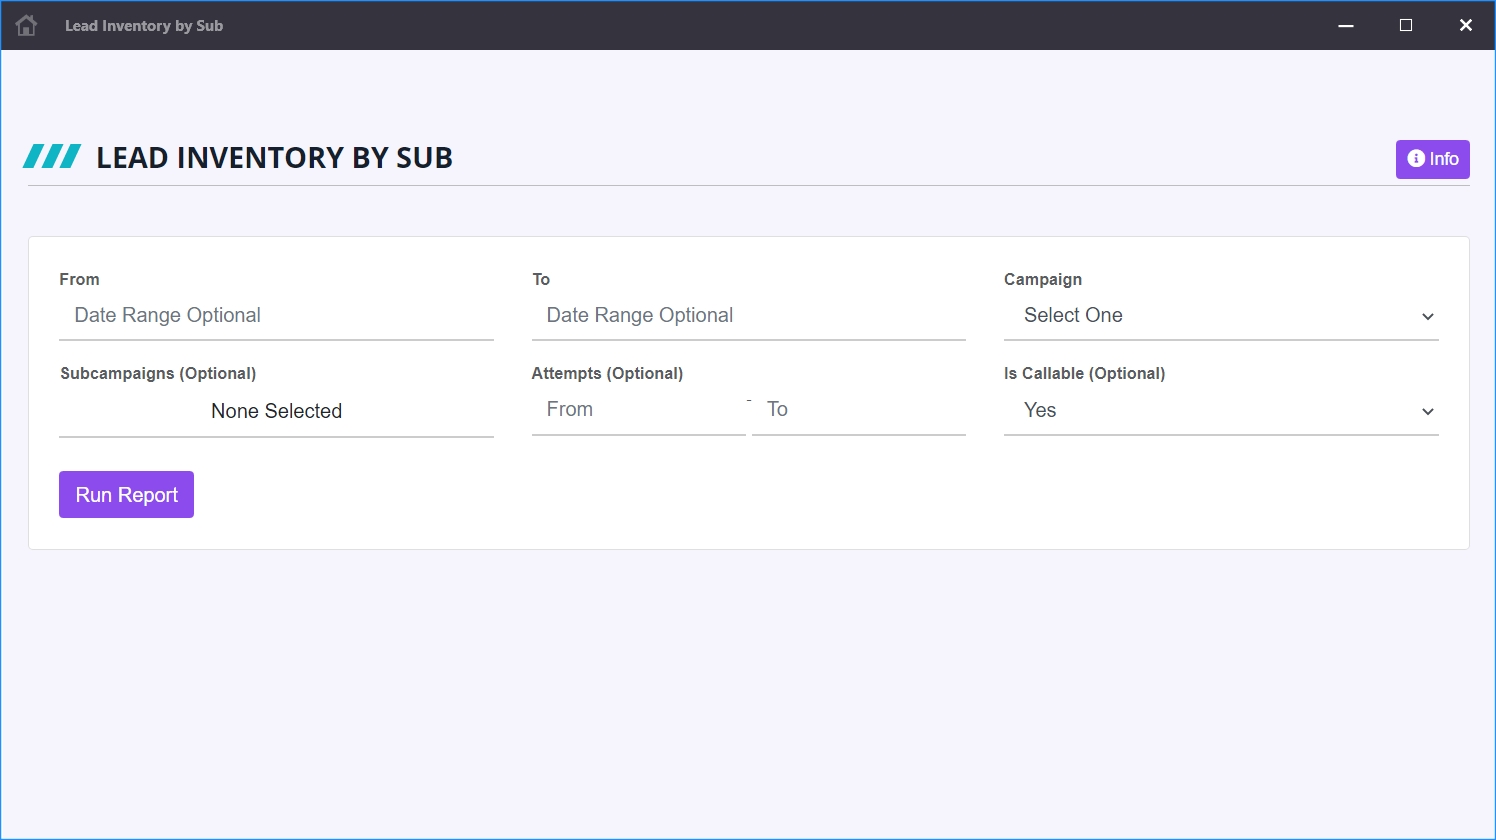
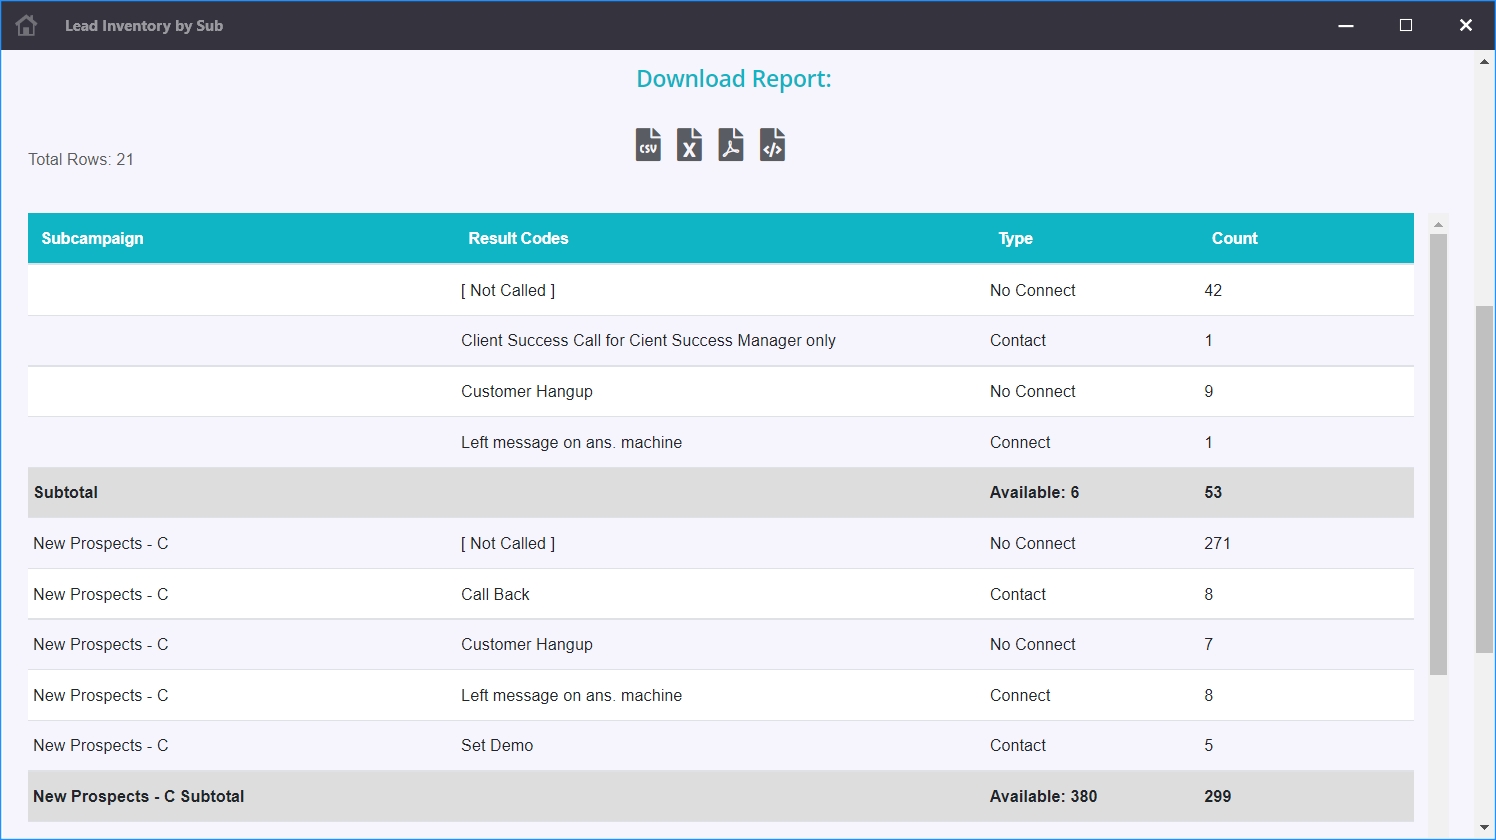
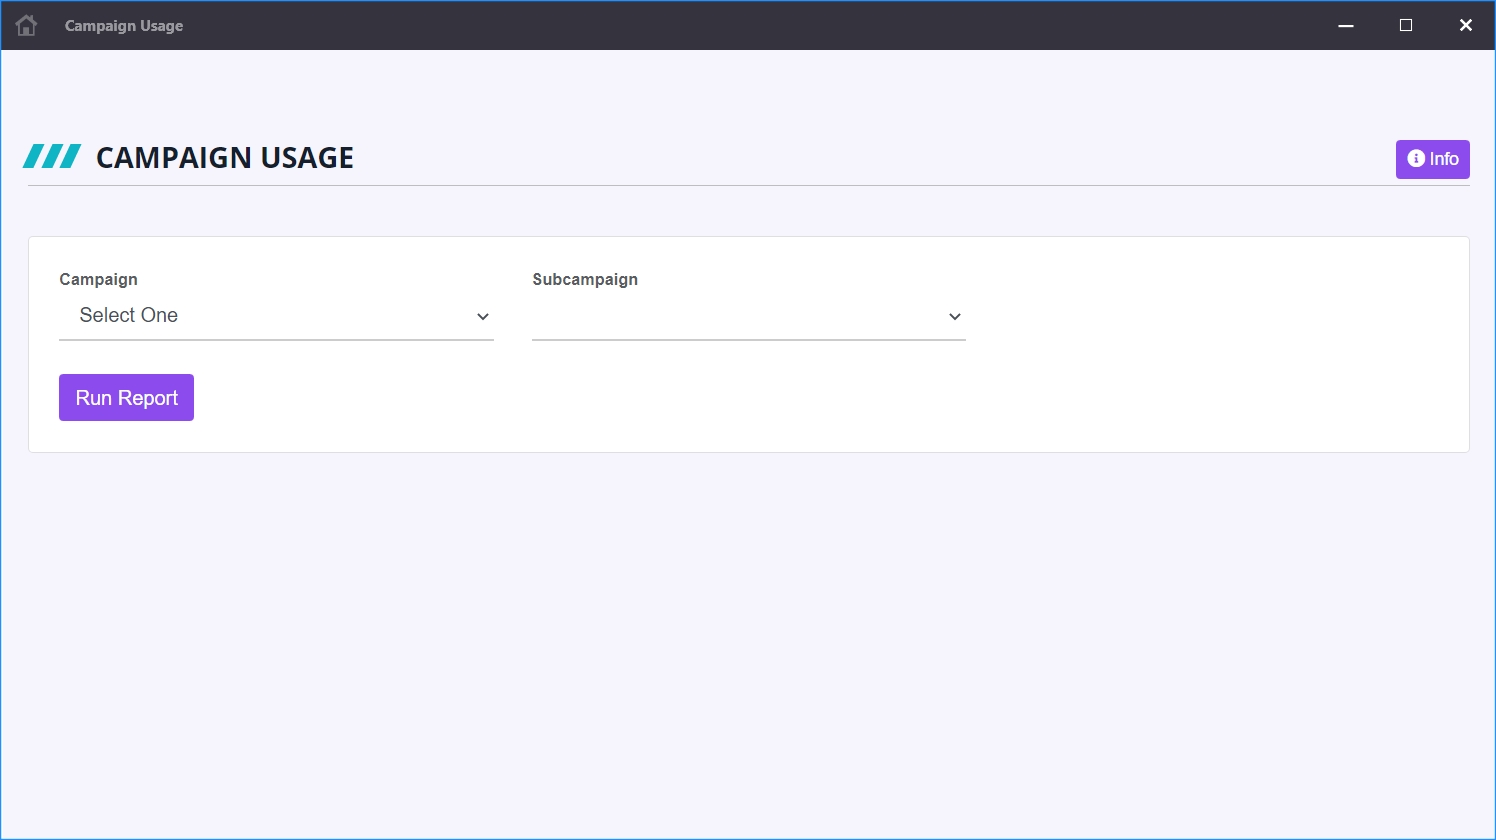
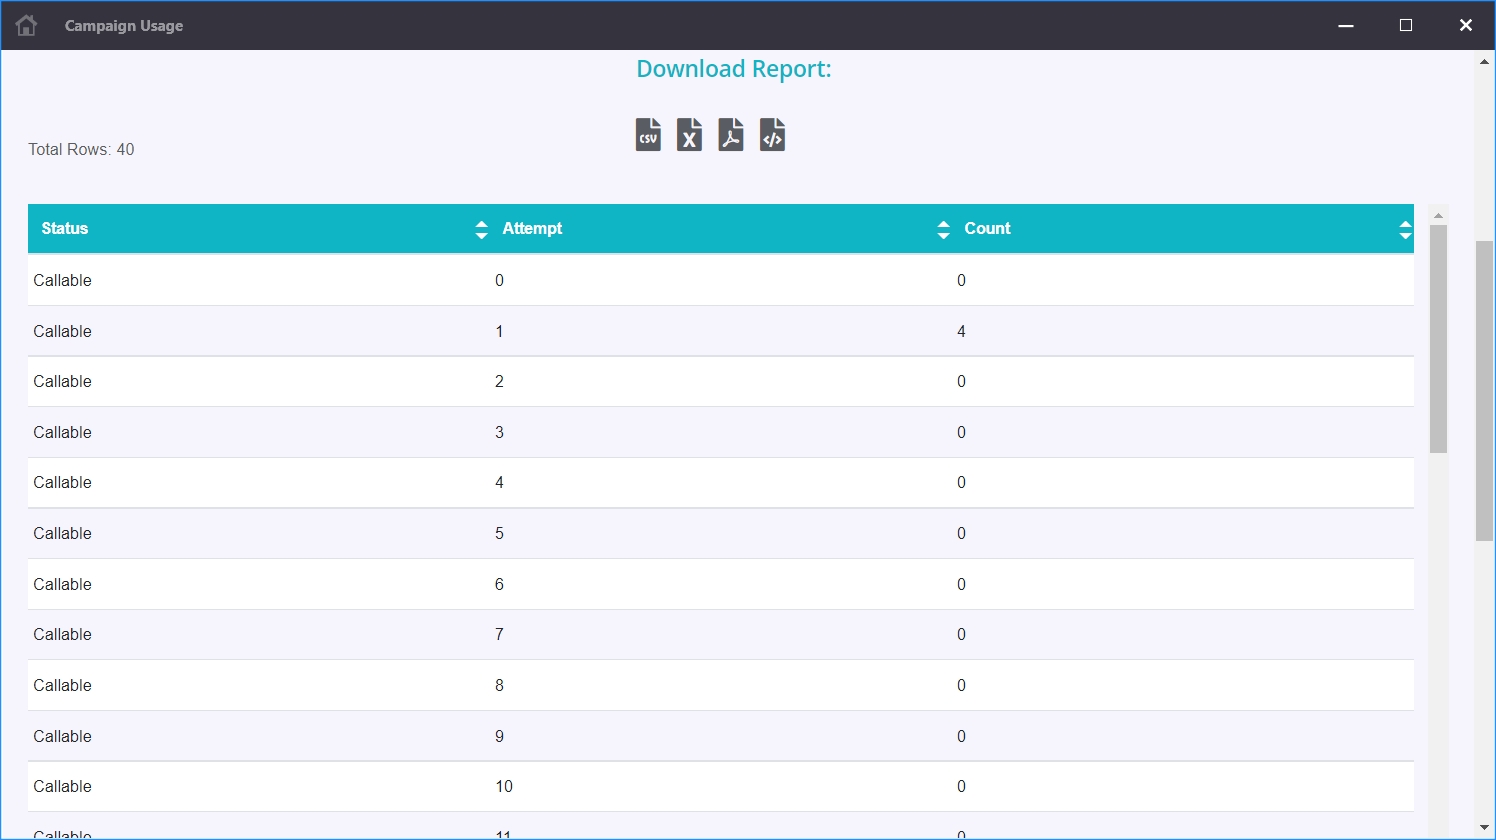
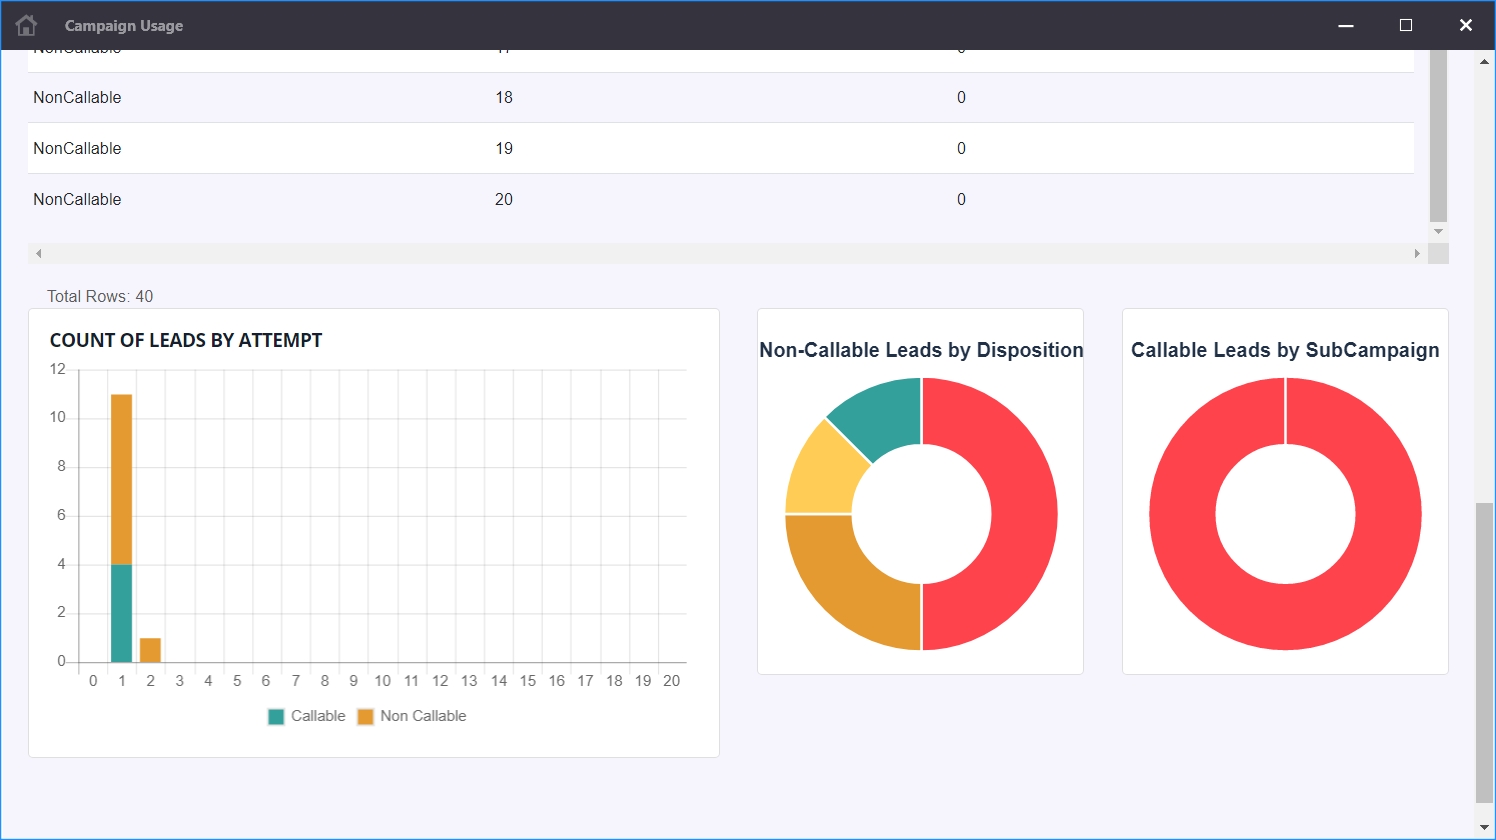
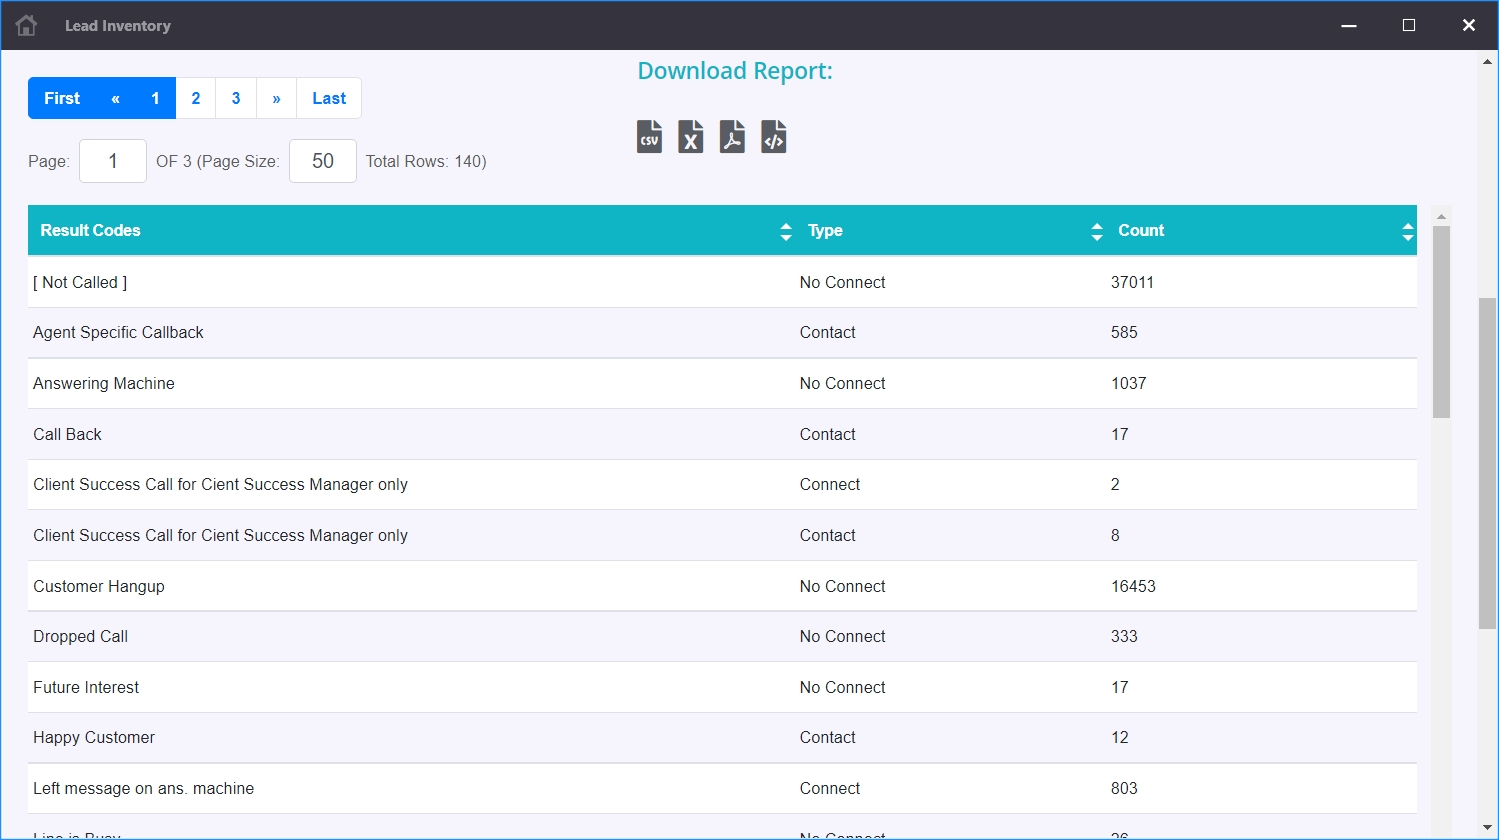
The purpose of this report is to show how leads have been used in a campaign by showing how many contacts/leads have a specific number of call attempts. The report also is split for contact/lead records that are set as callable and those that are set as non-callable (defined by last disposition/status).
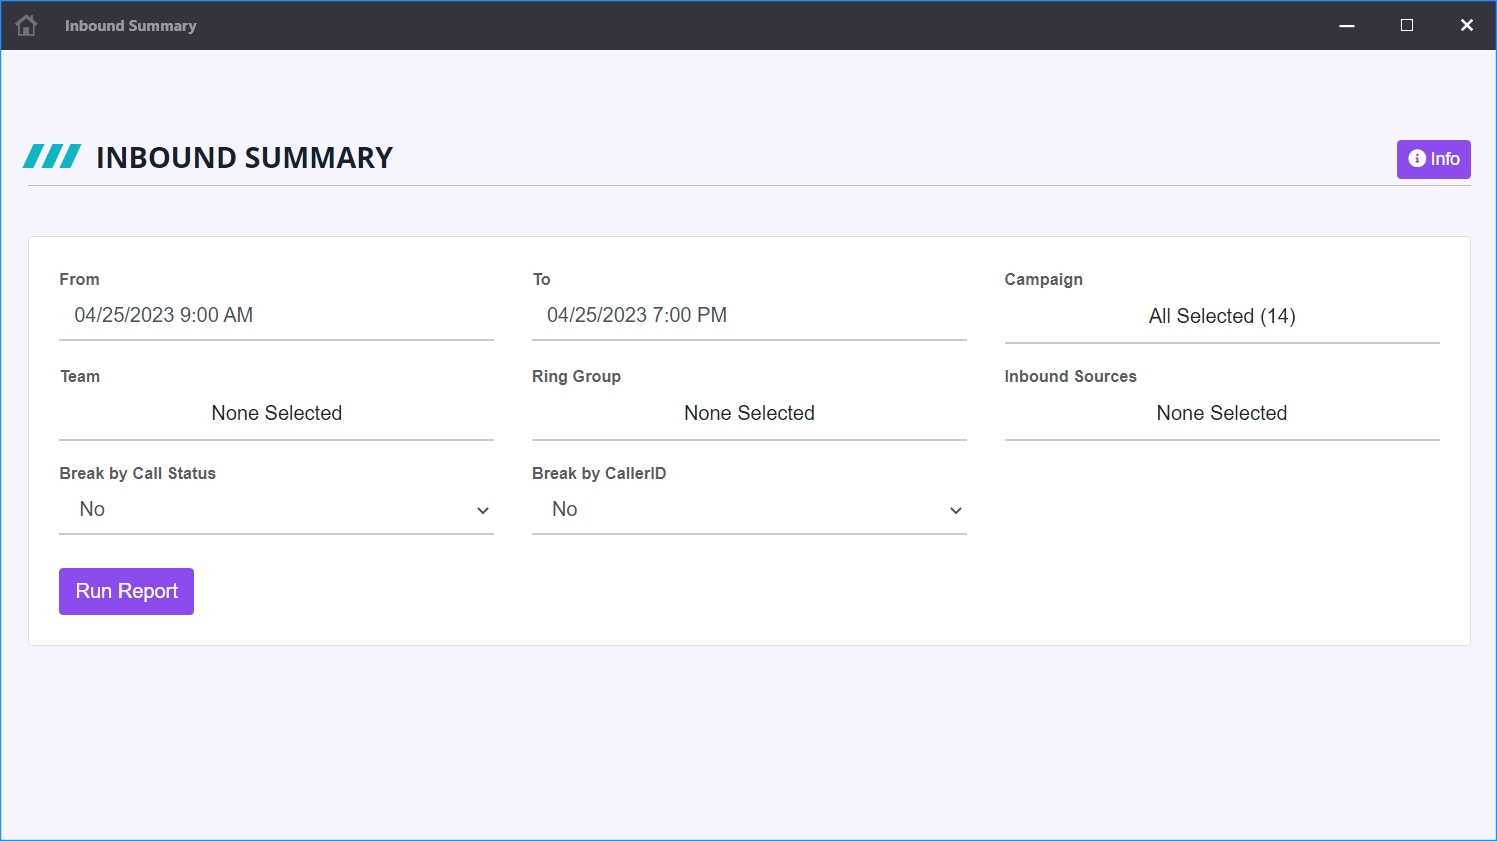
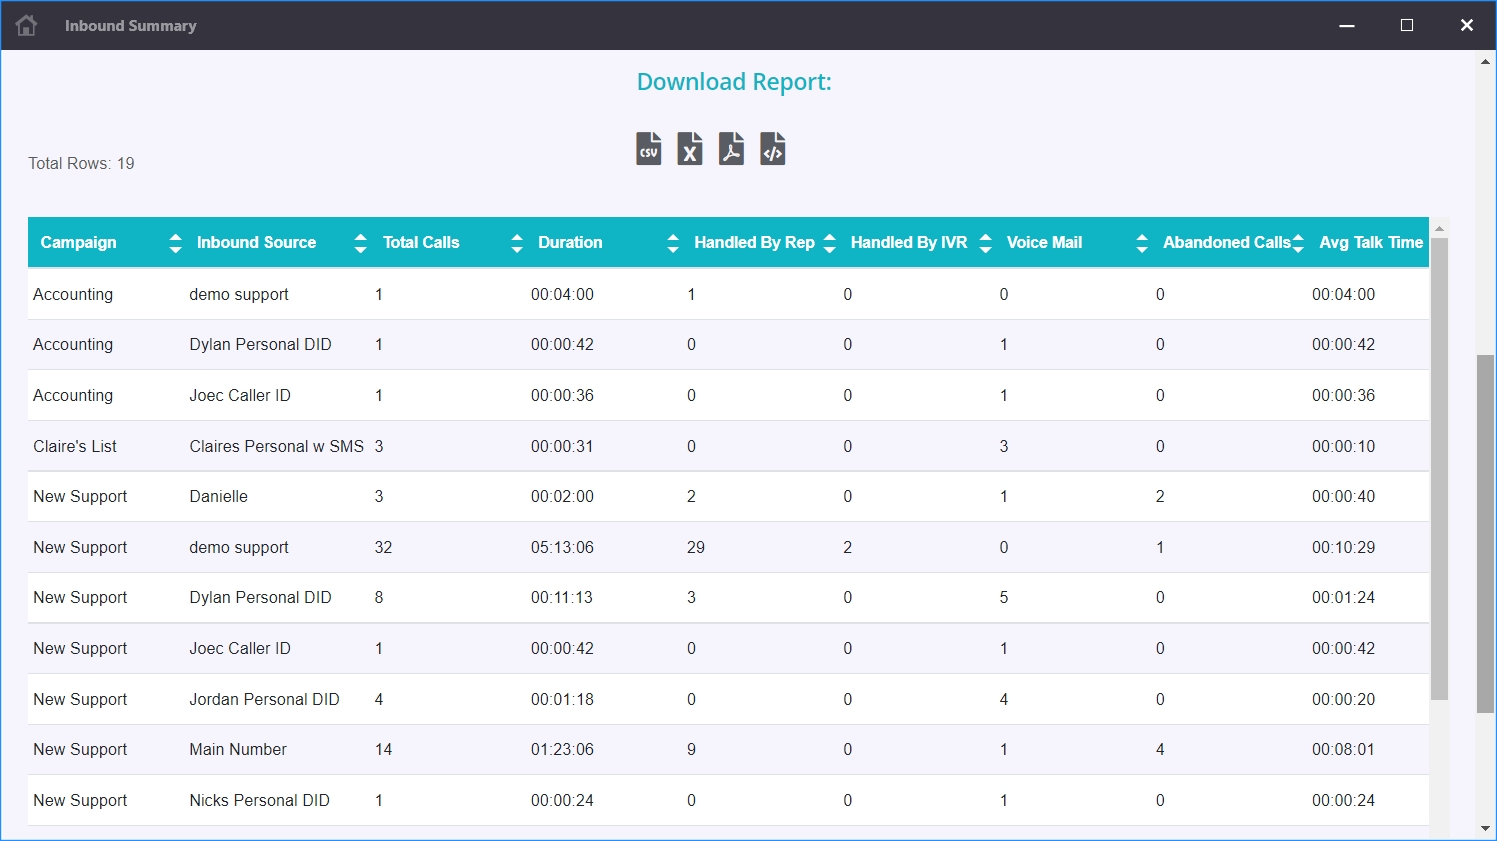
The purpose of this report is to provide call statistics on inbound calls for each (or selected) inbound source (DID) of the selected campaign(s). The statistics on this report provide a view of how many calls were received, how they were handled, and the amount of time used, allowing a manager to measure the effectiveness of the call center.
The purpose of this report is to present the number of outbound calls for each disposition that occurred in the specified date/time period. In addition, the report includes graphs to represent the following:
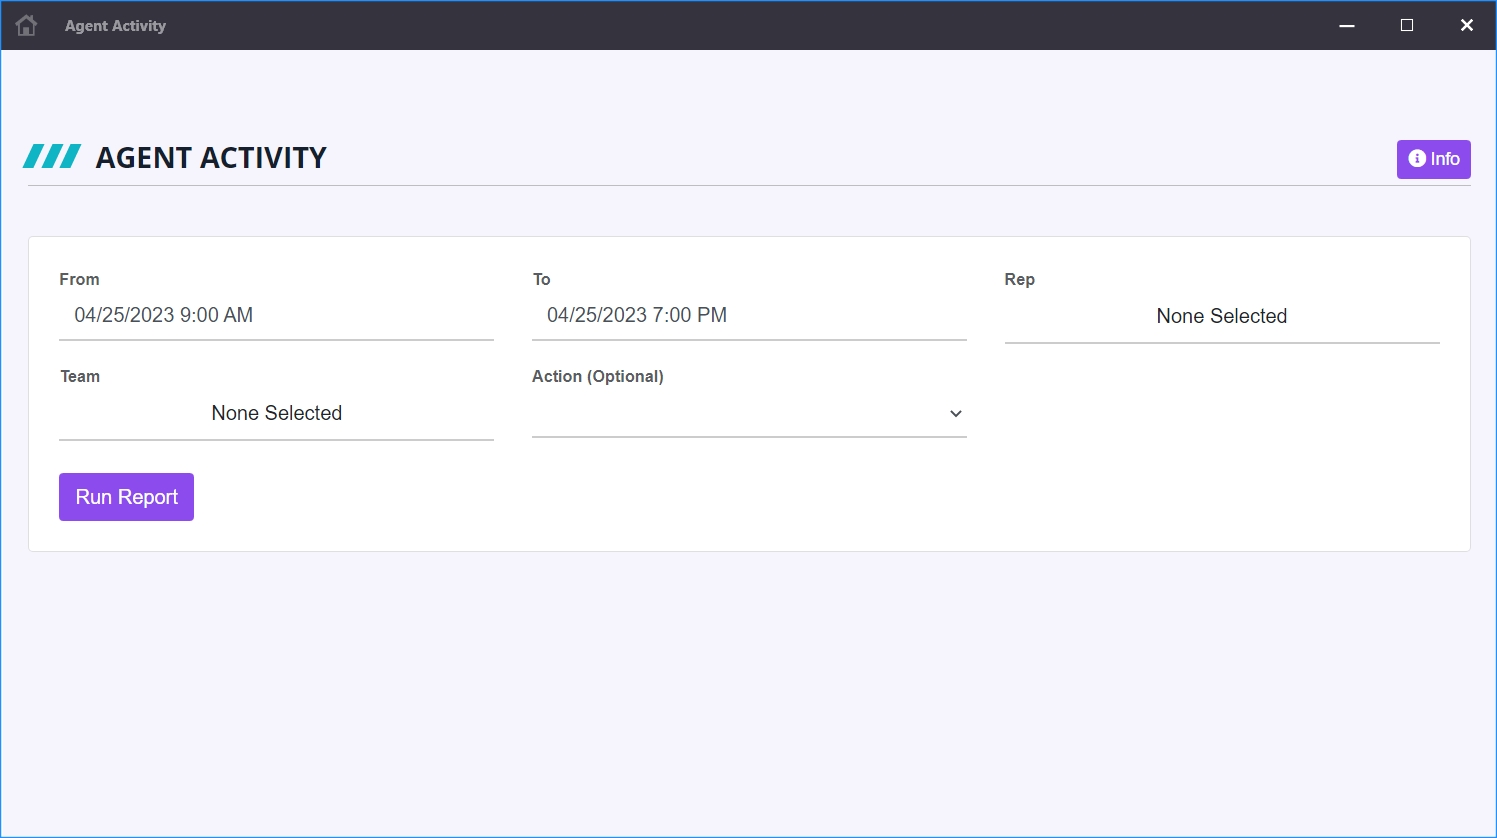
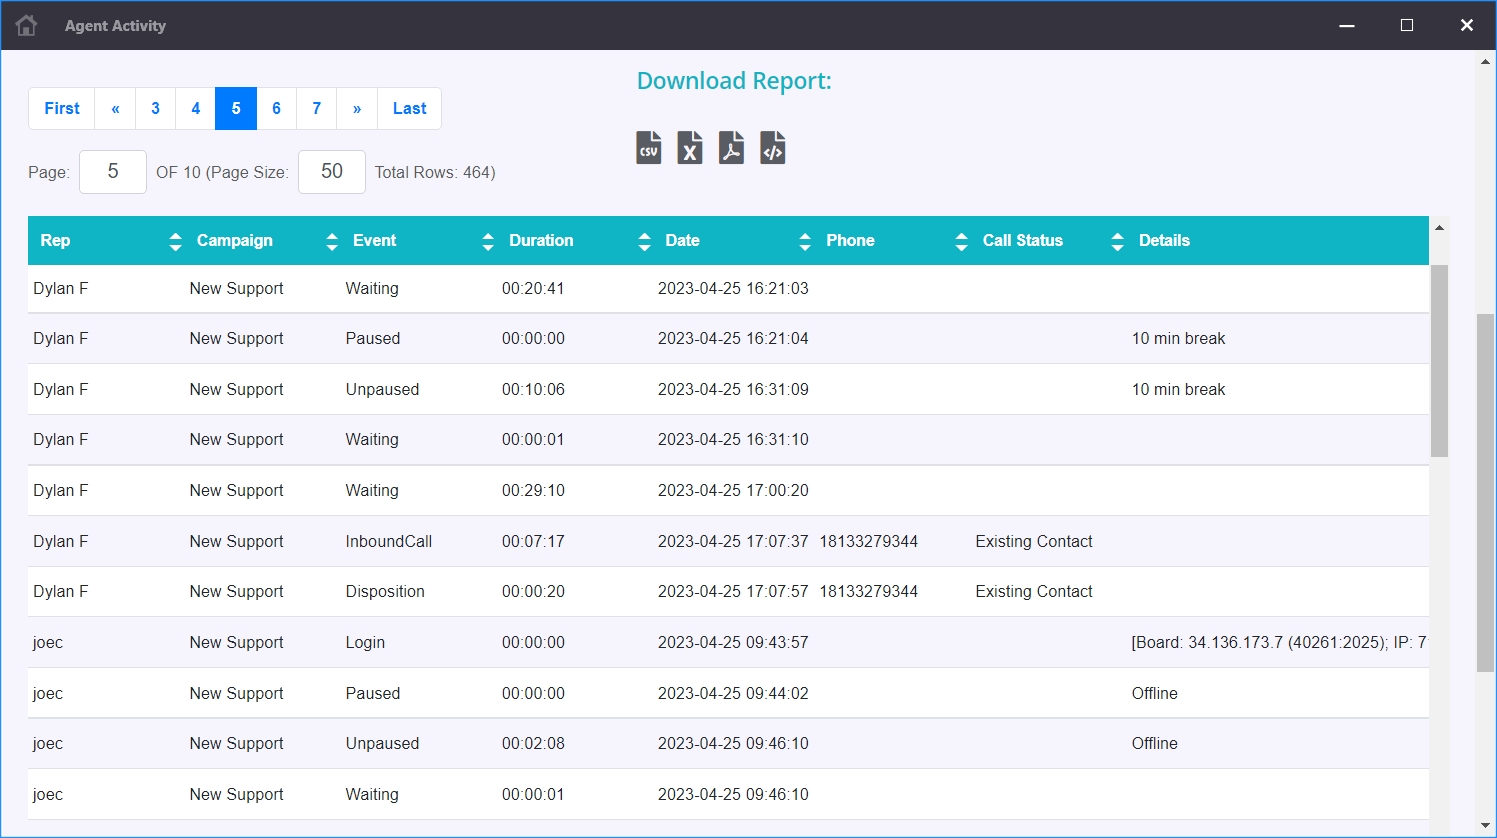
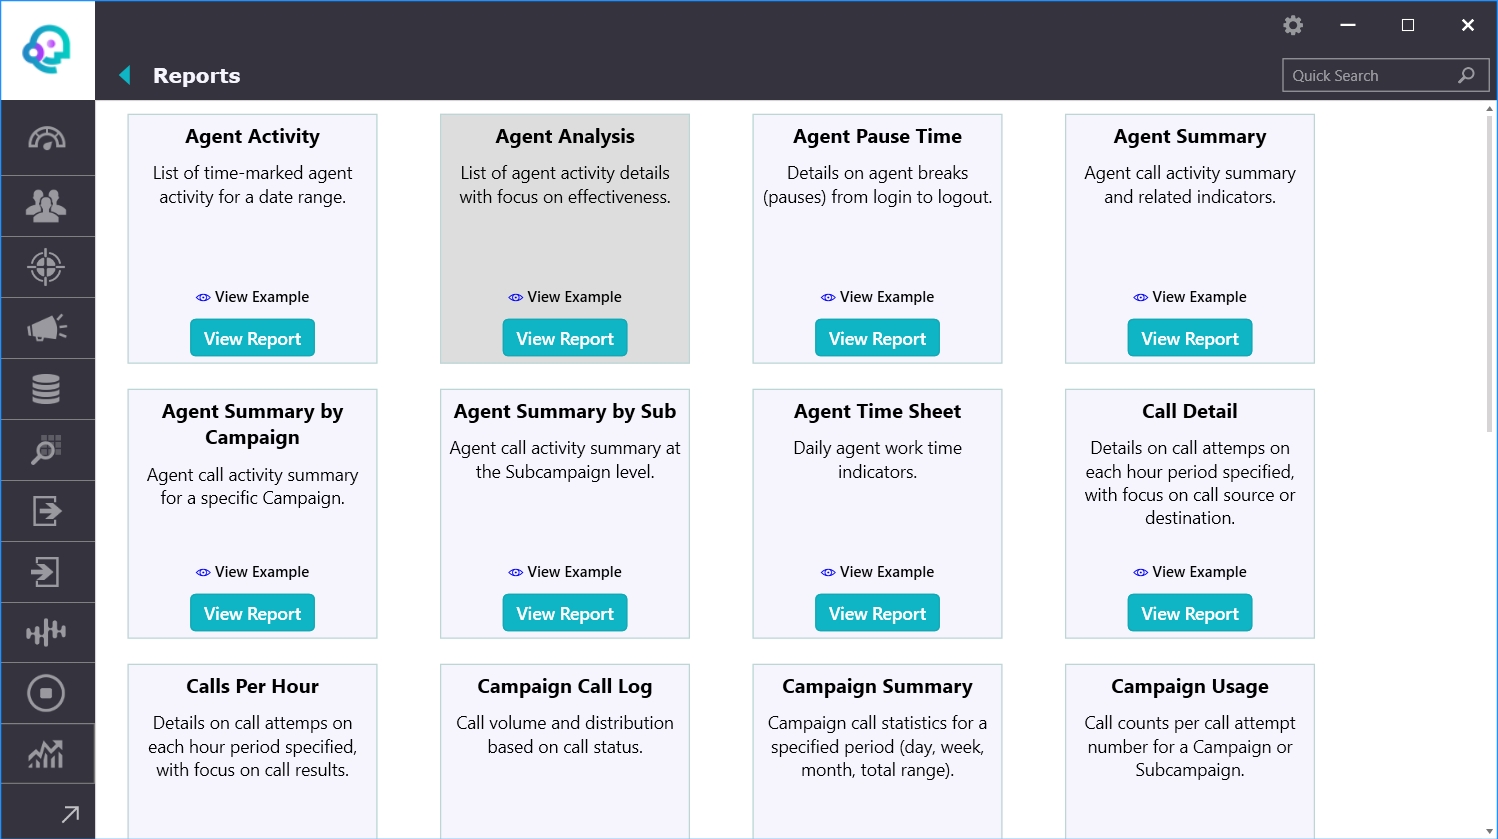
The purpose of this report is to present agent’s activity by showing the time mark of any agent login, status changes, and logout.
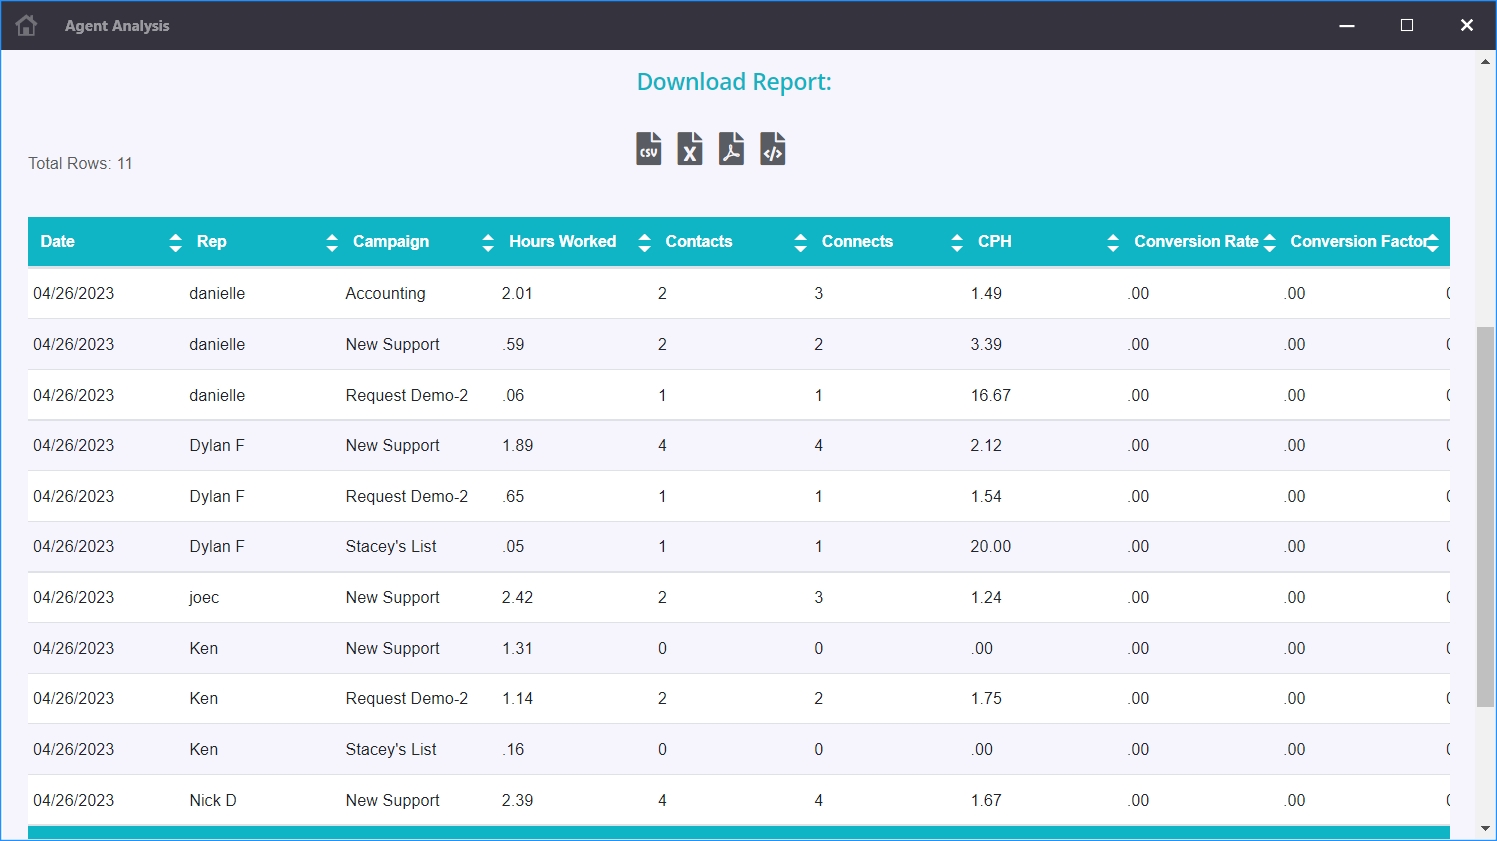
The purpose of this report is to present agent effectiveness by presenting a row for each combination of date-agent-campaign that shows duration and counts for call activity based on corresponding results, and work time based on activity states.

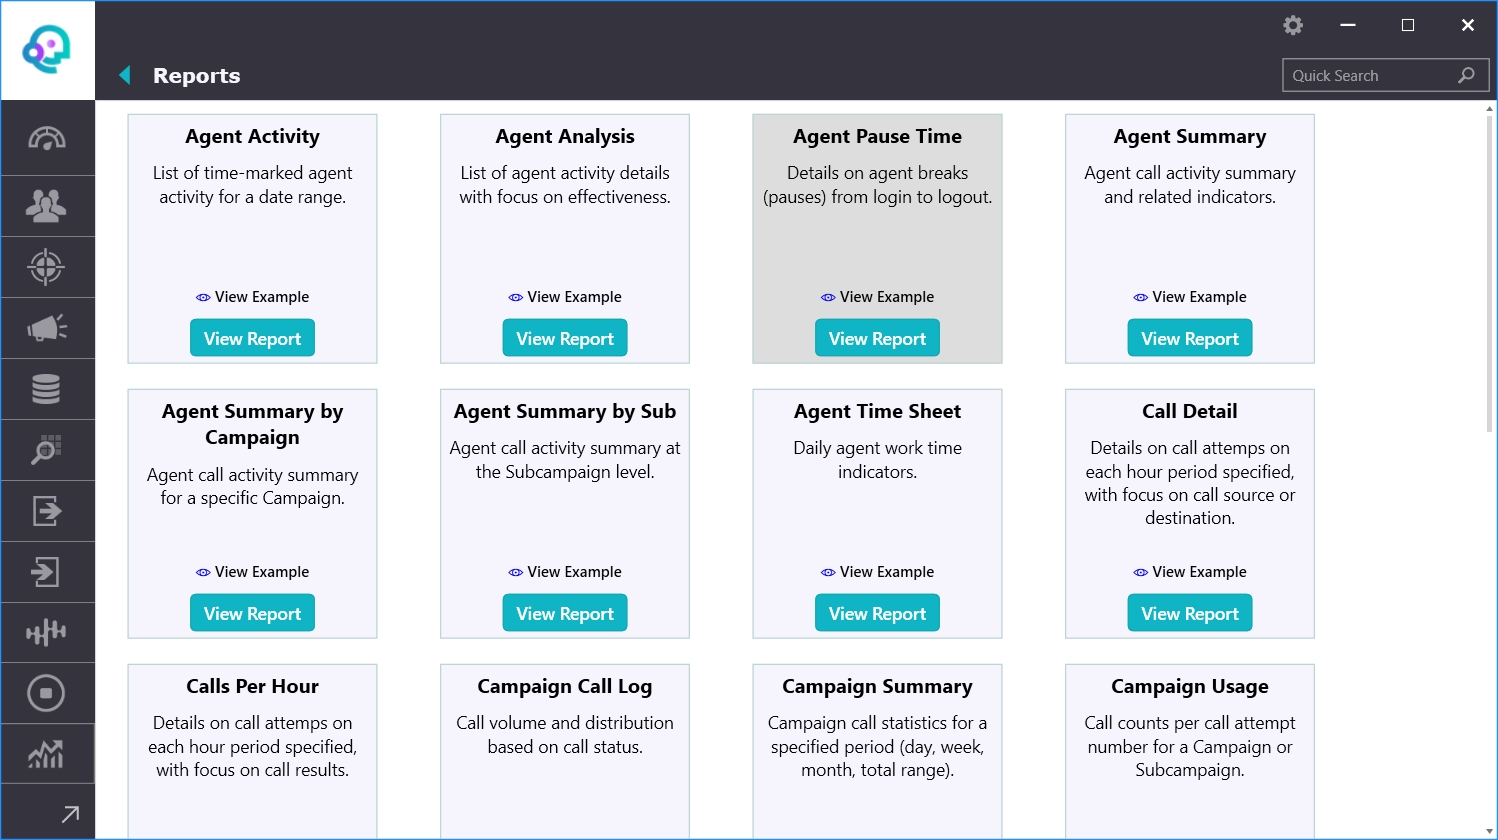
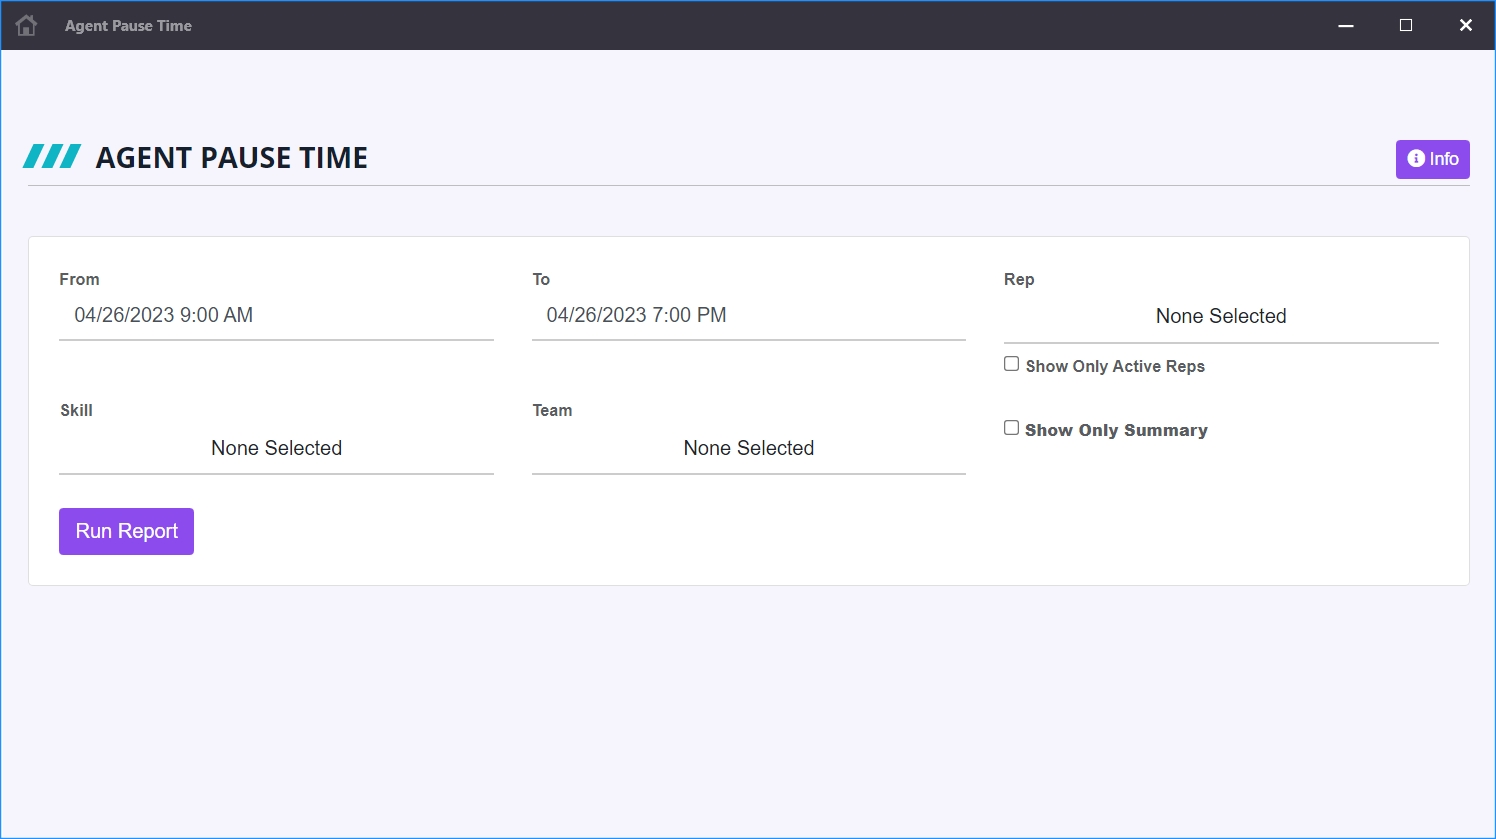
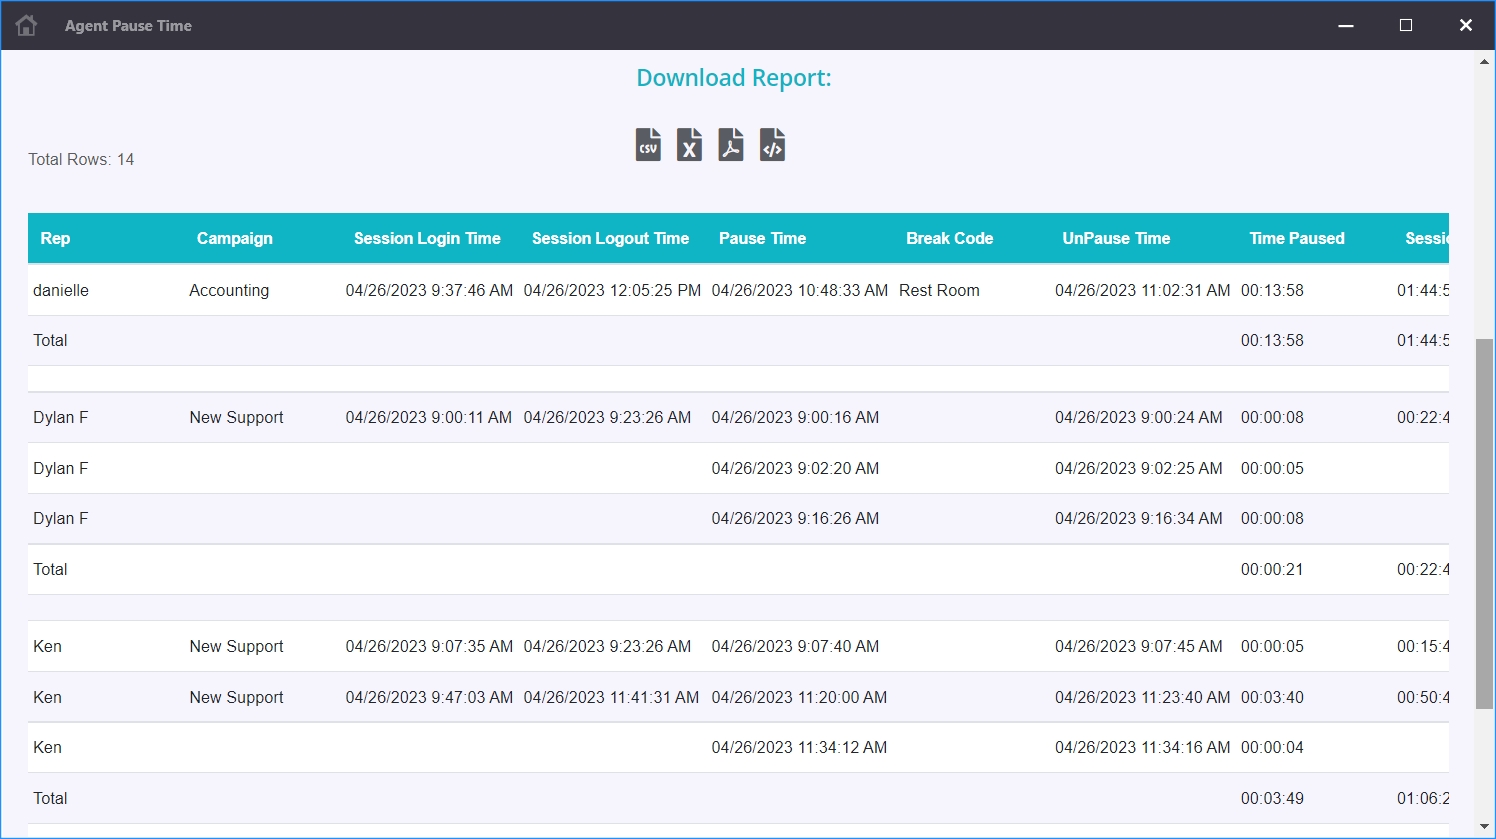
The purpose of this report is to show agent breaks (pauses) from login to logout, including the pause reason (break code). The report does this for every campaign and for all login-to-logout periods fully within the specified date/time period.
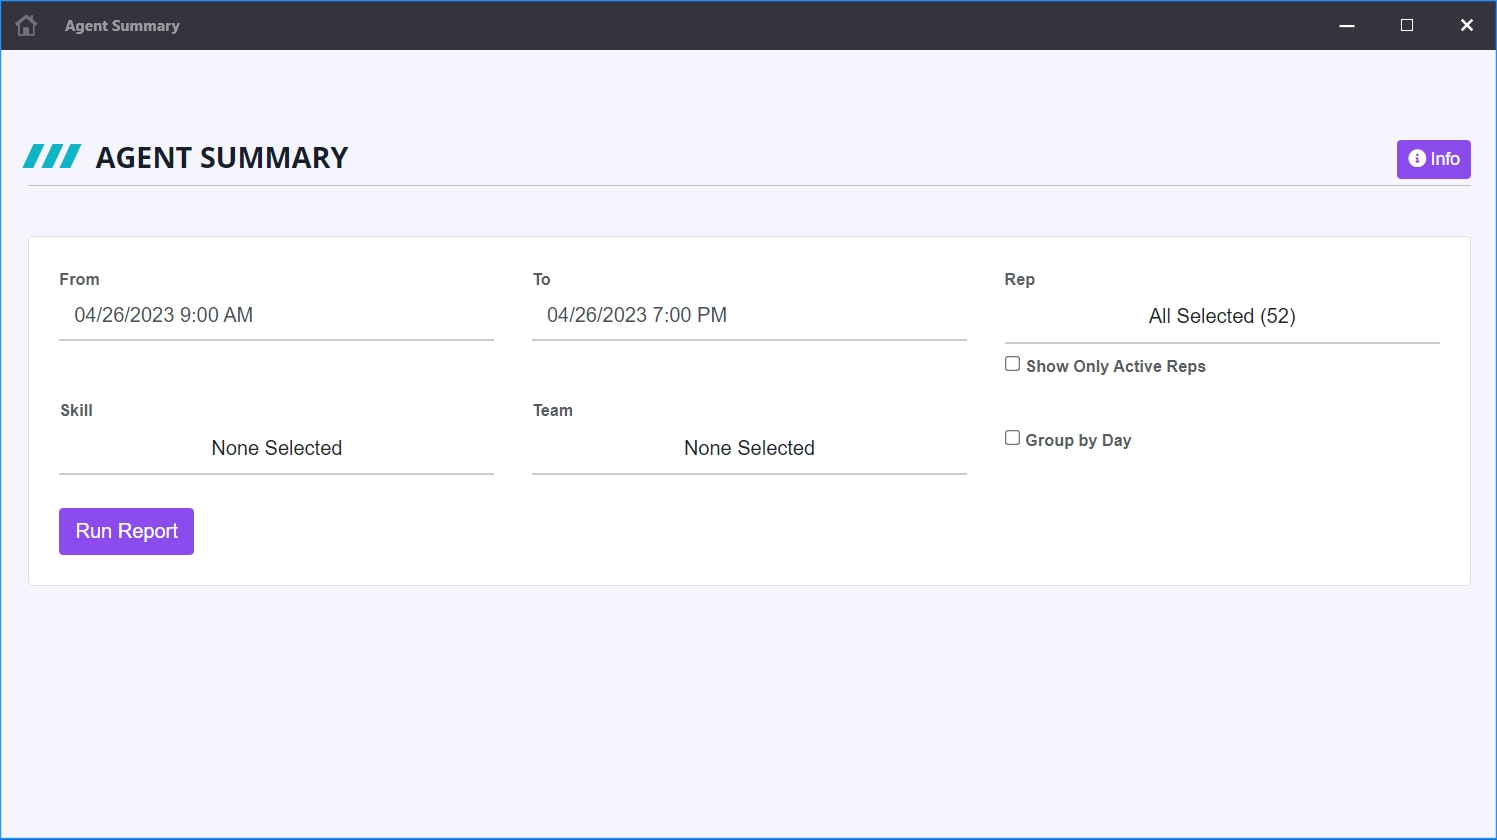
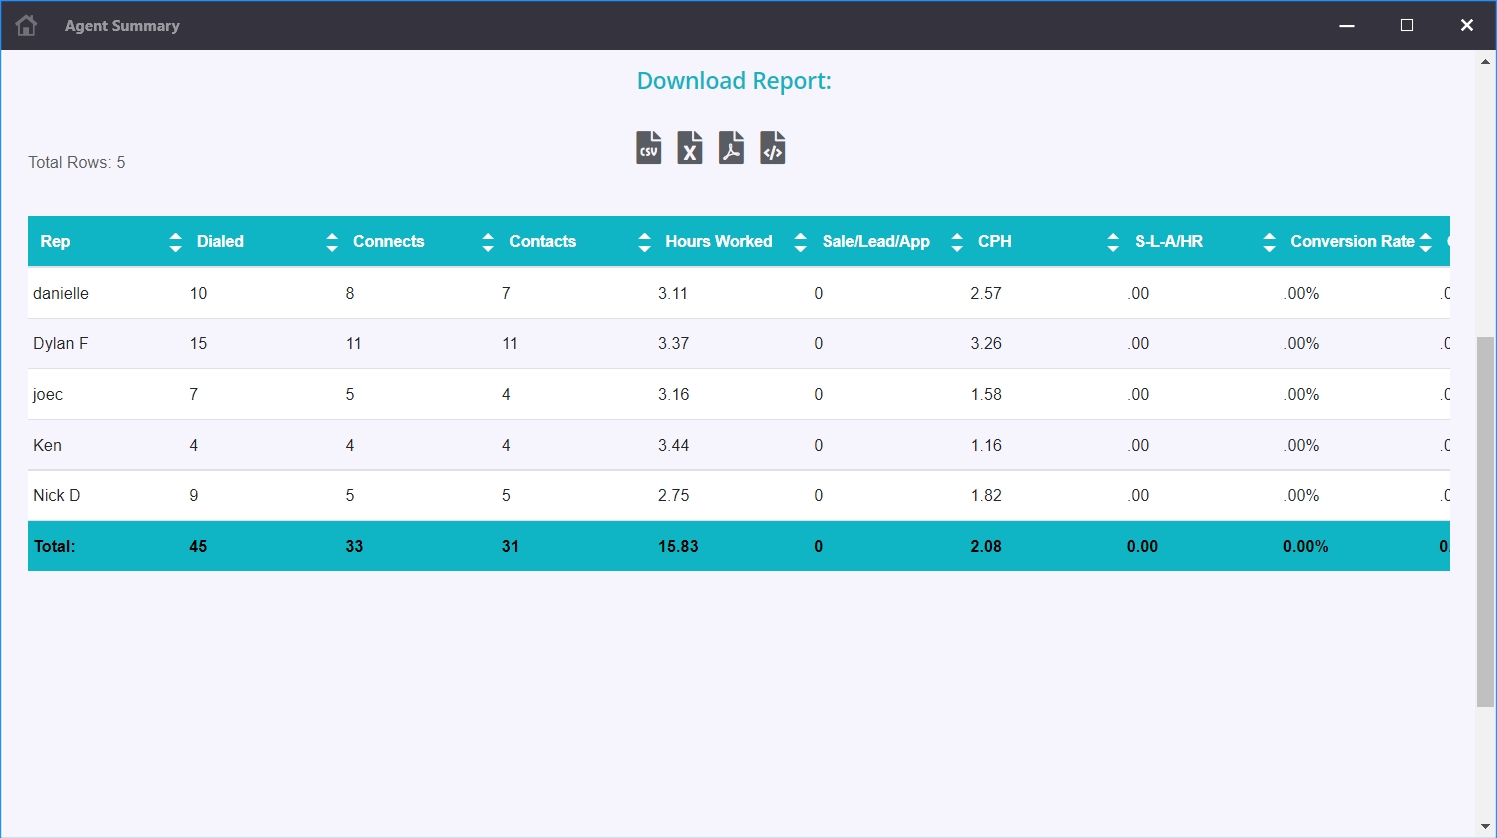
The purpose of this report is to present agent effectiveness by presenting a row for each agent that shows duration and counts for call activity based on corresponding results, and work time based on activity states.
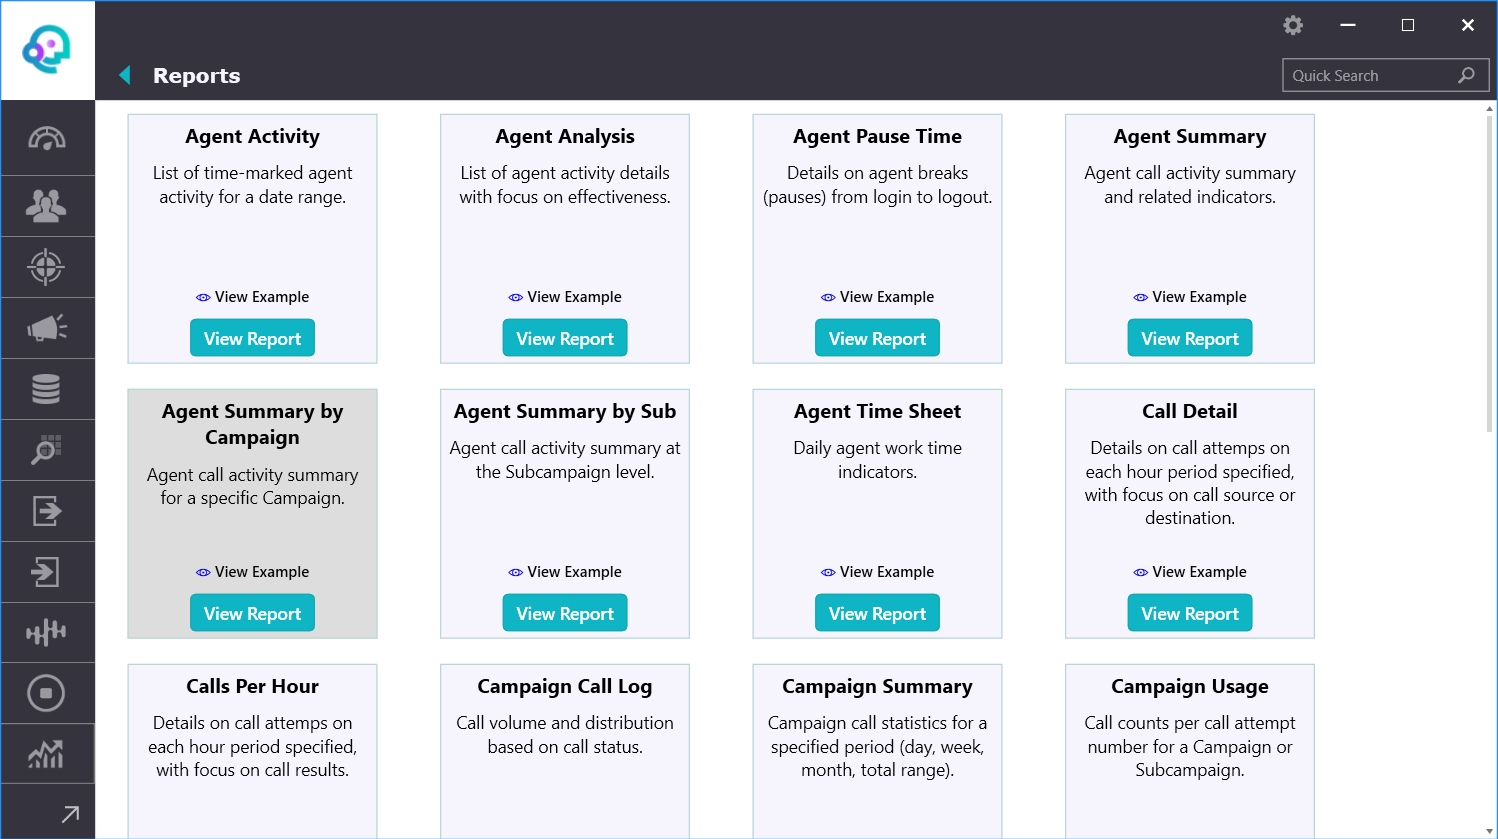
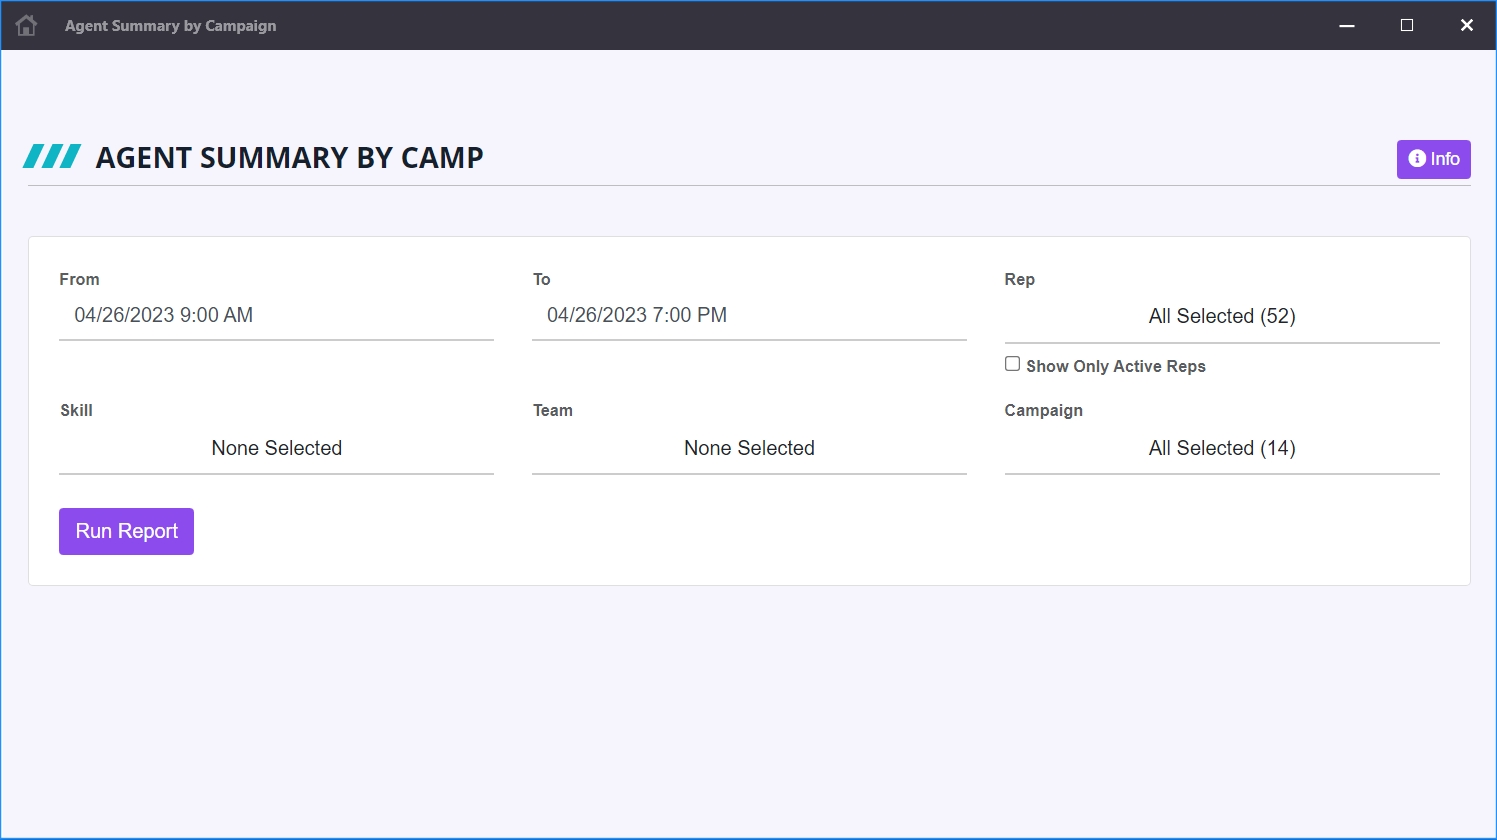
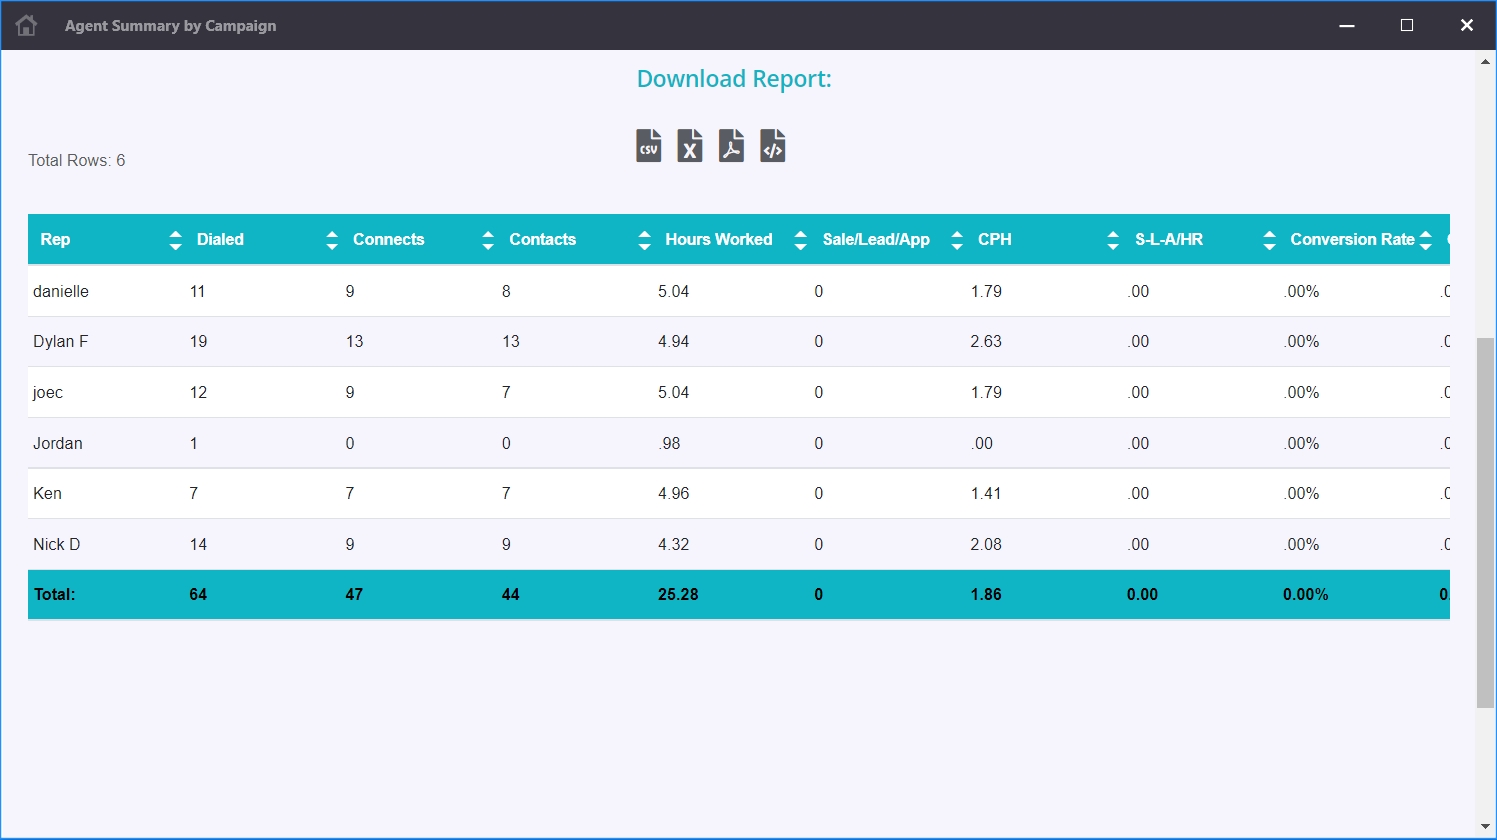
This is similar to the Agent Summary report, but with a Campaign filter added.
This is similar to the Agent Summary report, but with a Campaign filter added (includes all sub-campaigns for the selected campaigns).
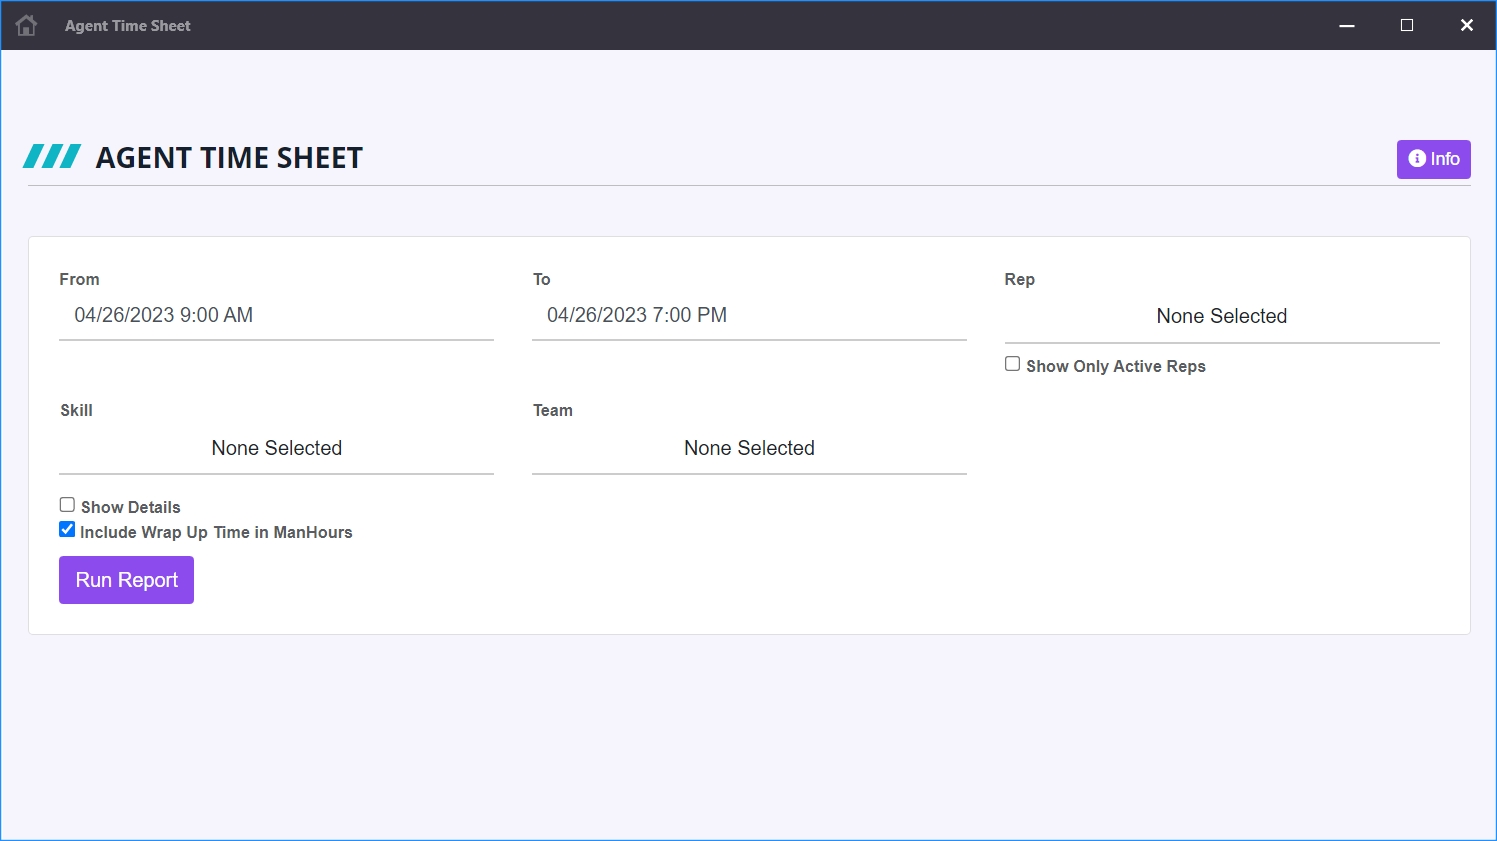
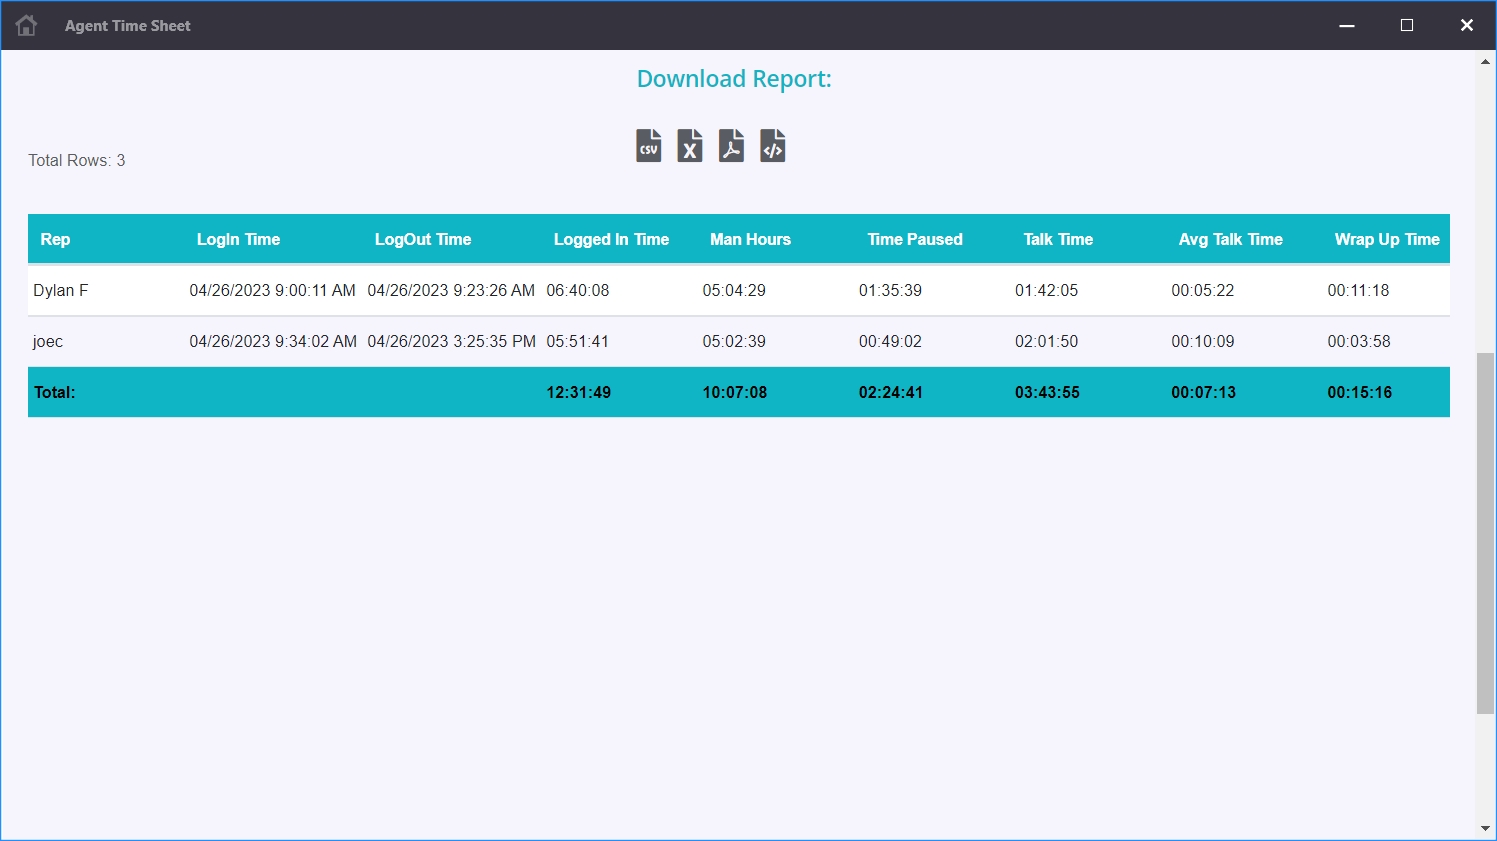
The purpose of this report is to indicate when agents log in, log out, amount of time elapsed (logged in time), and how much of that time was productive time (person-hours) and how much was break time (paused hours); all of this in a single row for the whole period requested. If details are also requested, a row is provided for every single login-logout period (with their corresponding time amounts) within the whole period.
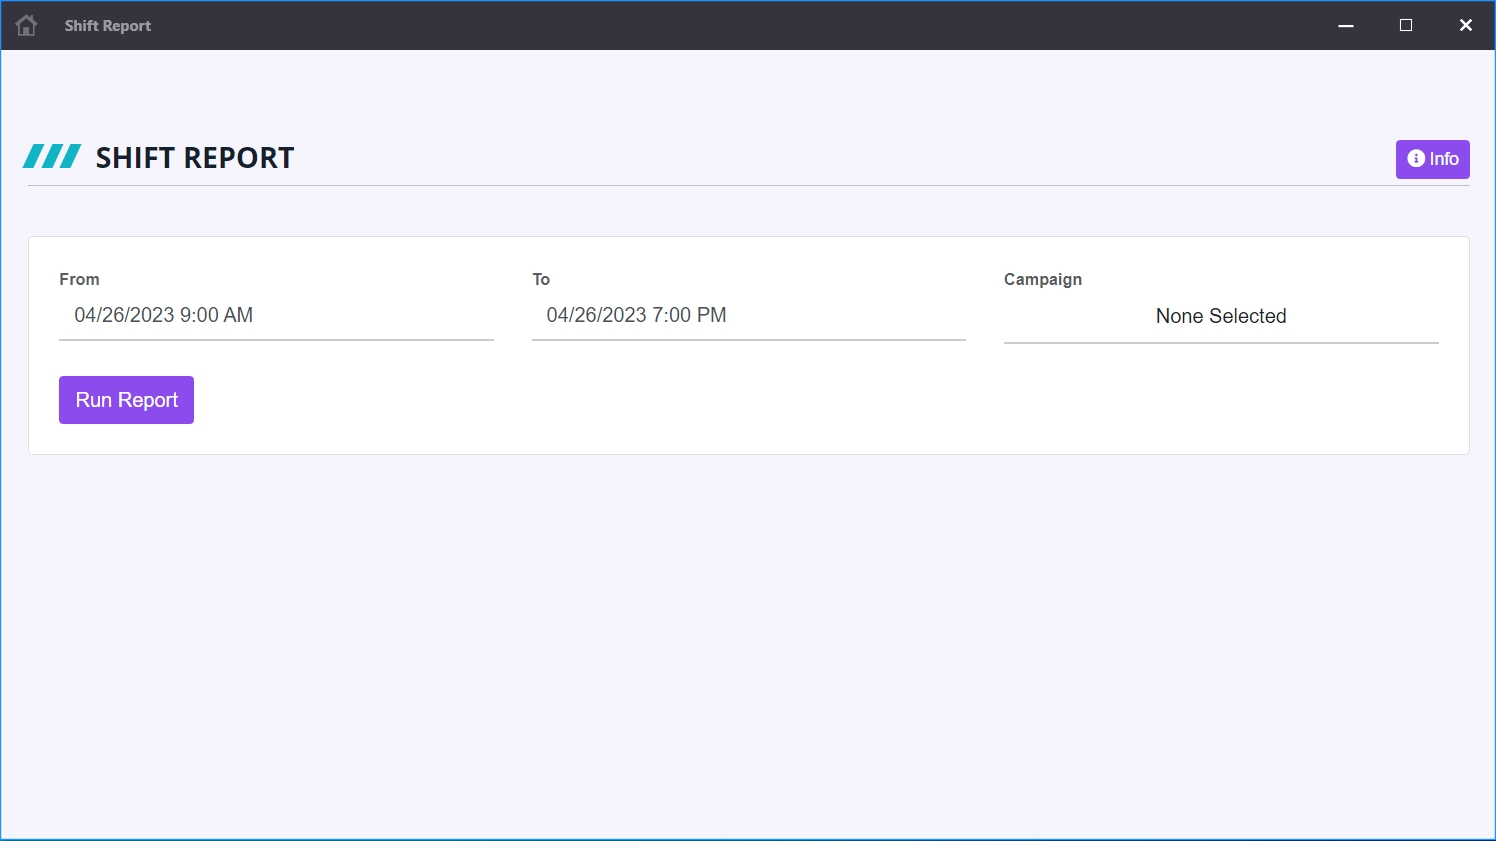
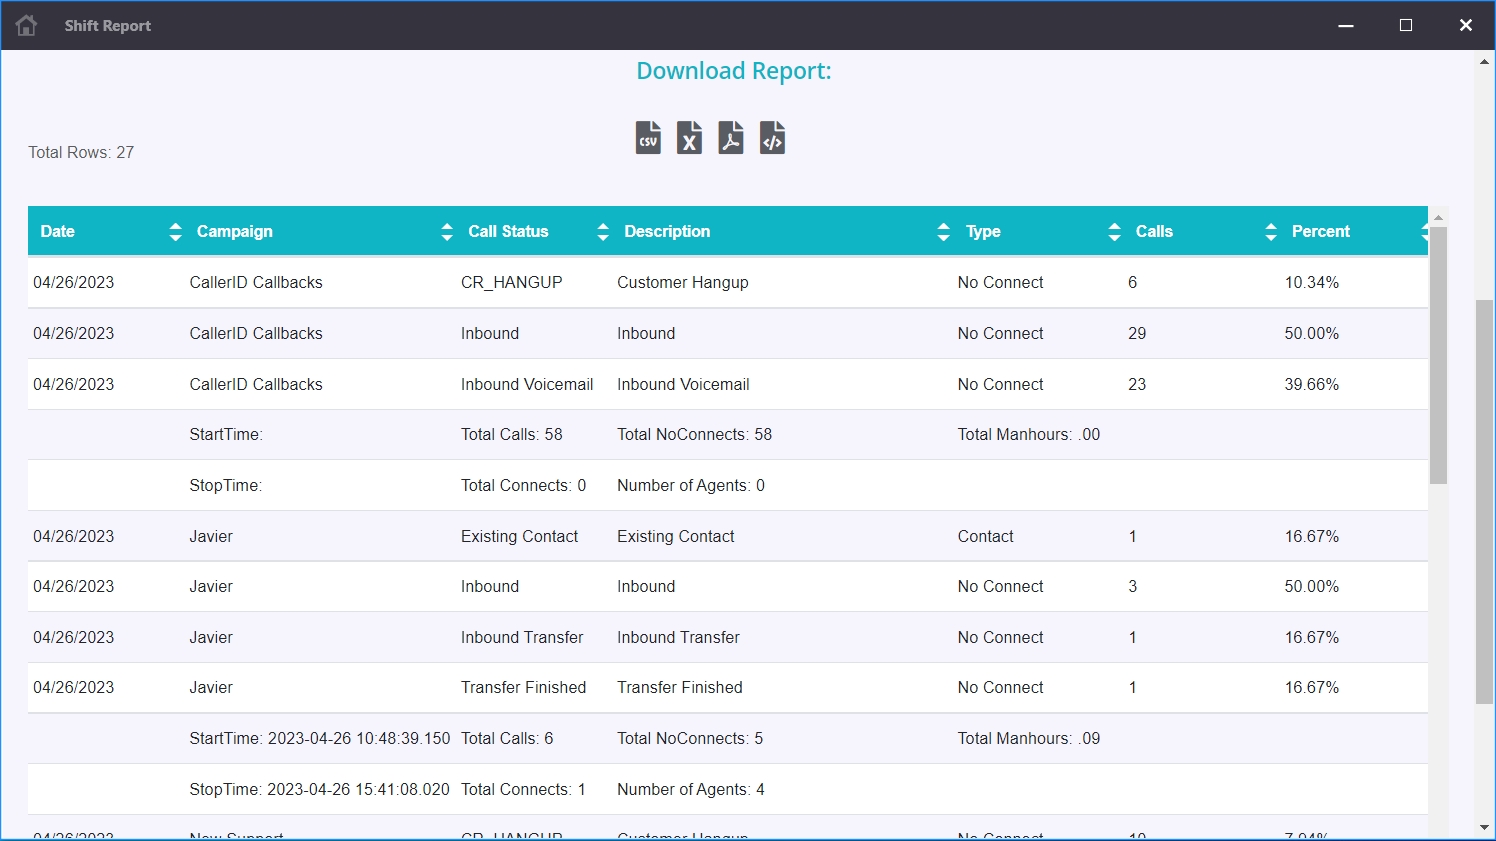
The purpose of this report is to provide a snapshot of campaigns start to stop times with summaries of number of calls grouped into call status results (dispositions).
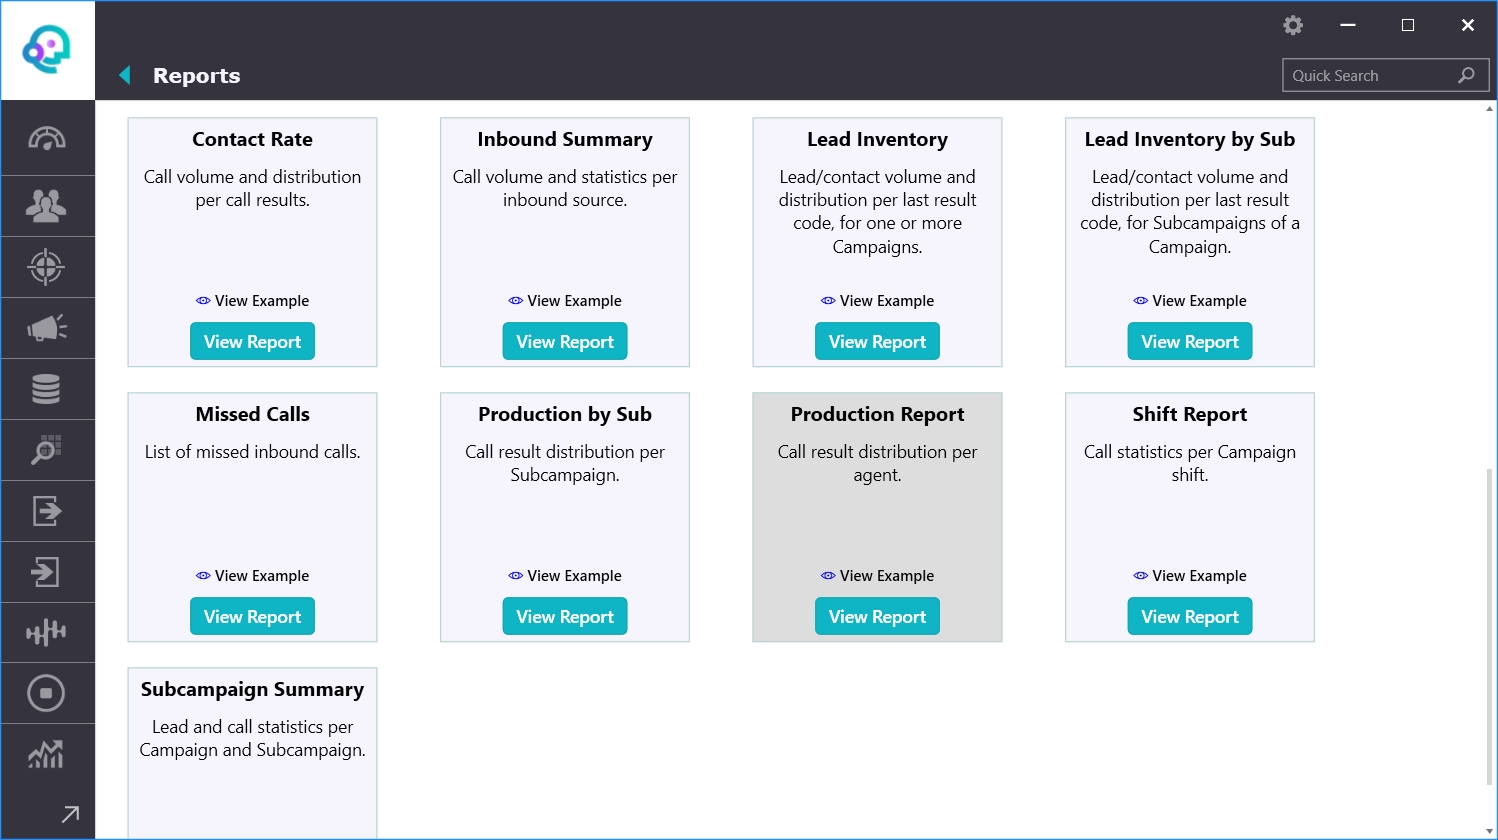
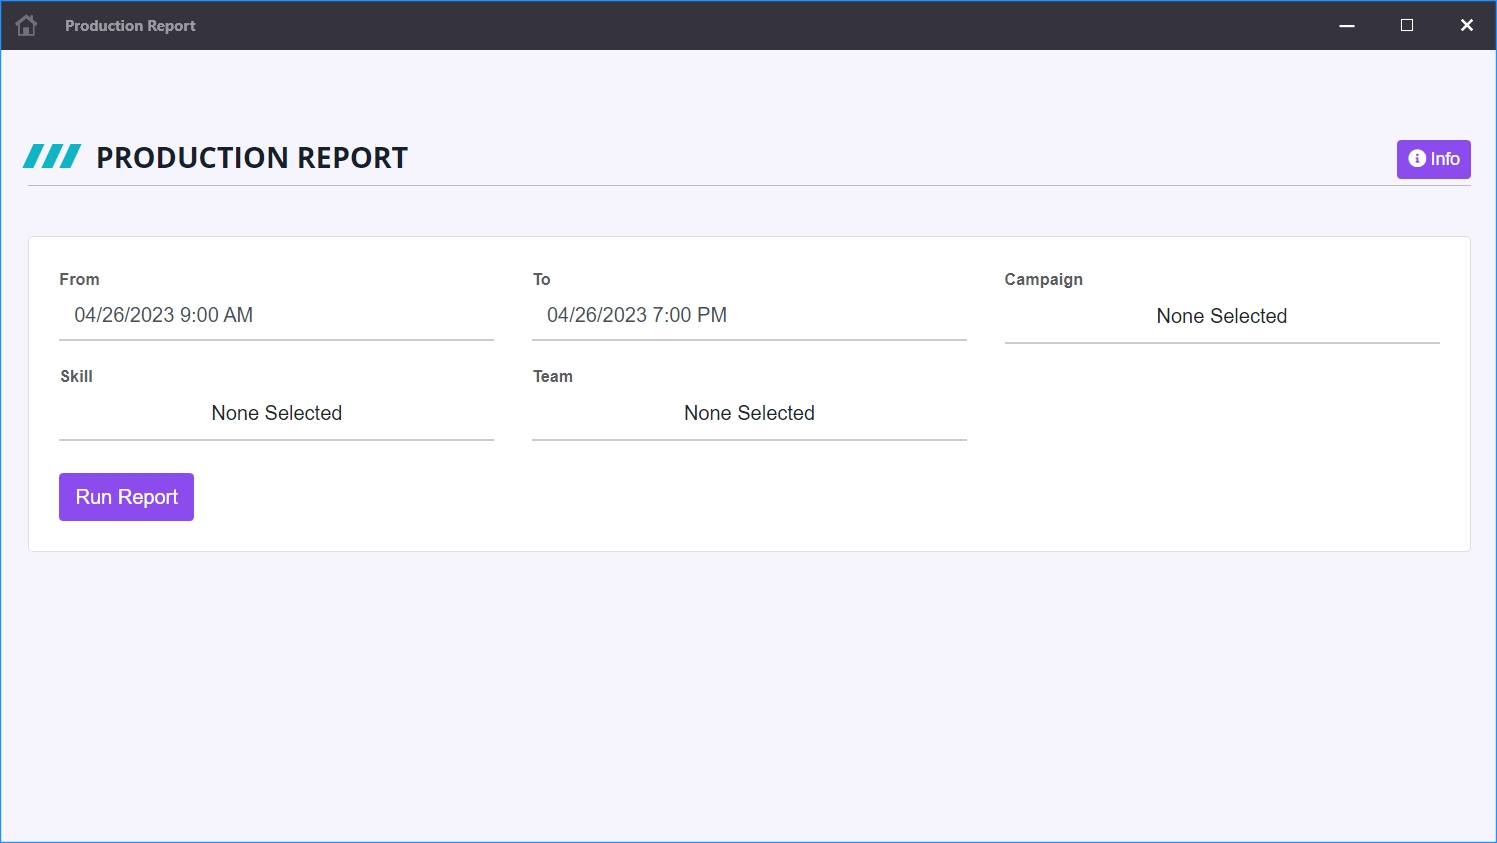
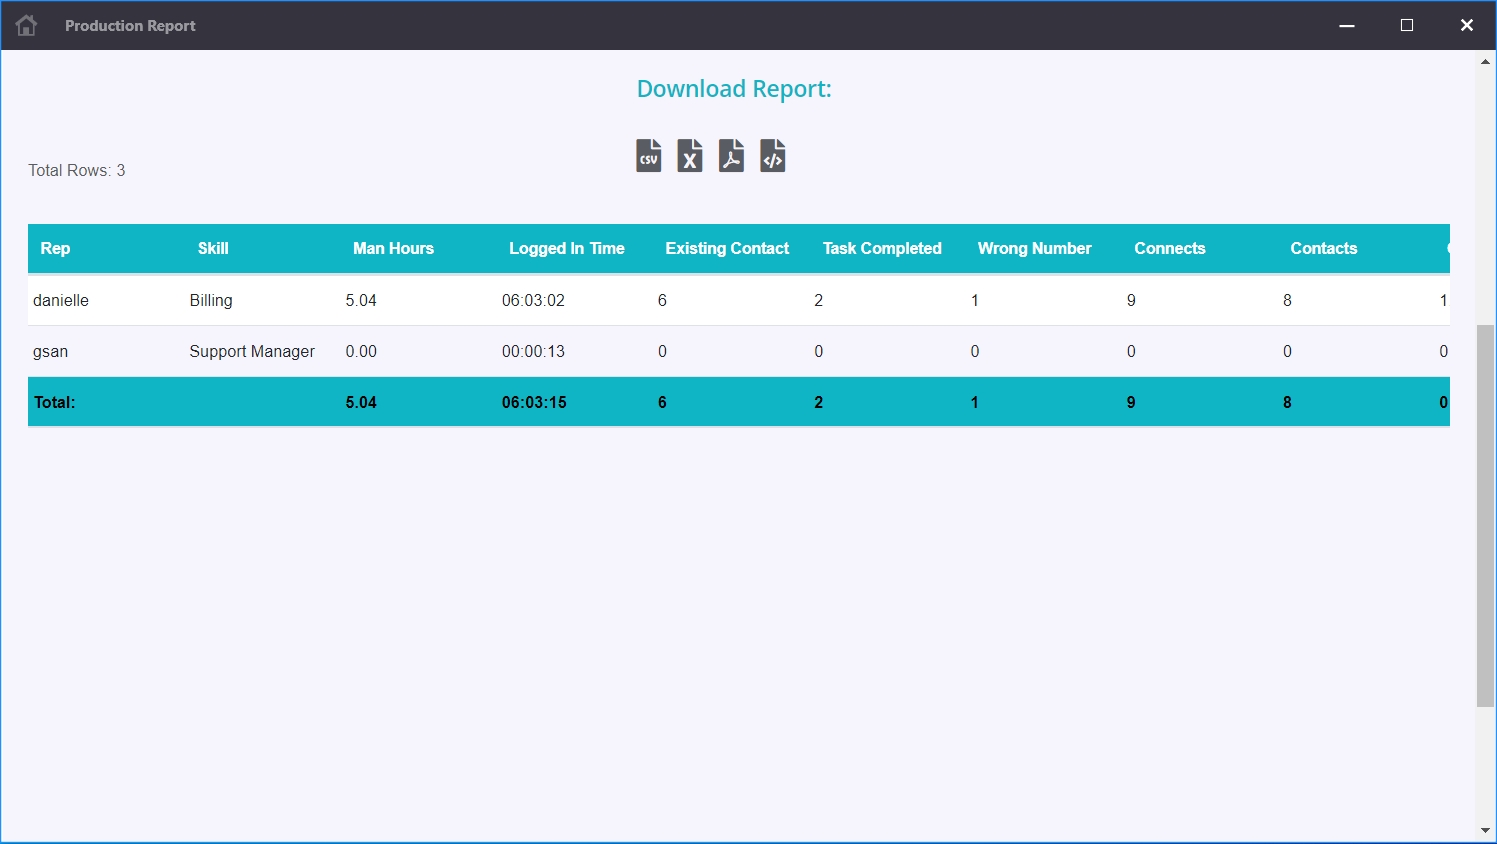
The purpose of this report is to summarize productivity of agents based on their time effort against call counts and results.
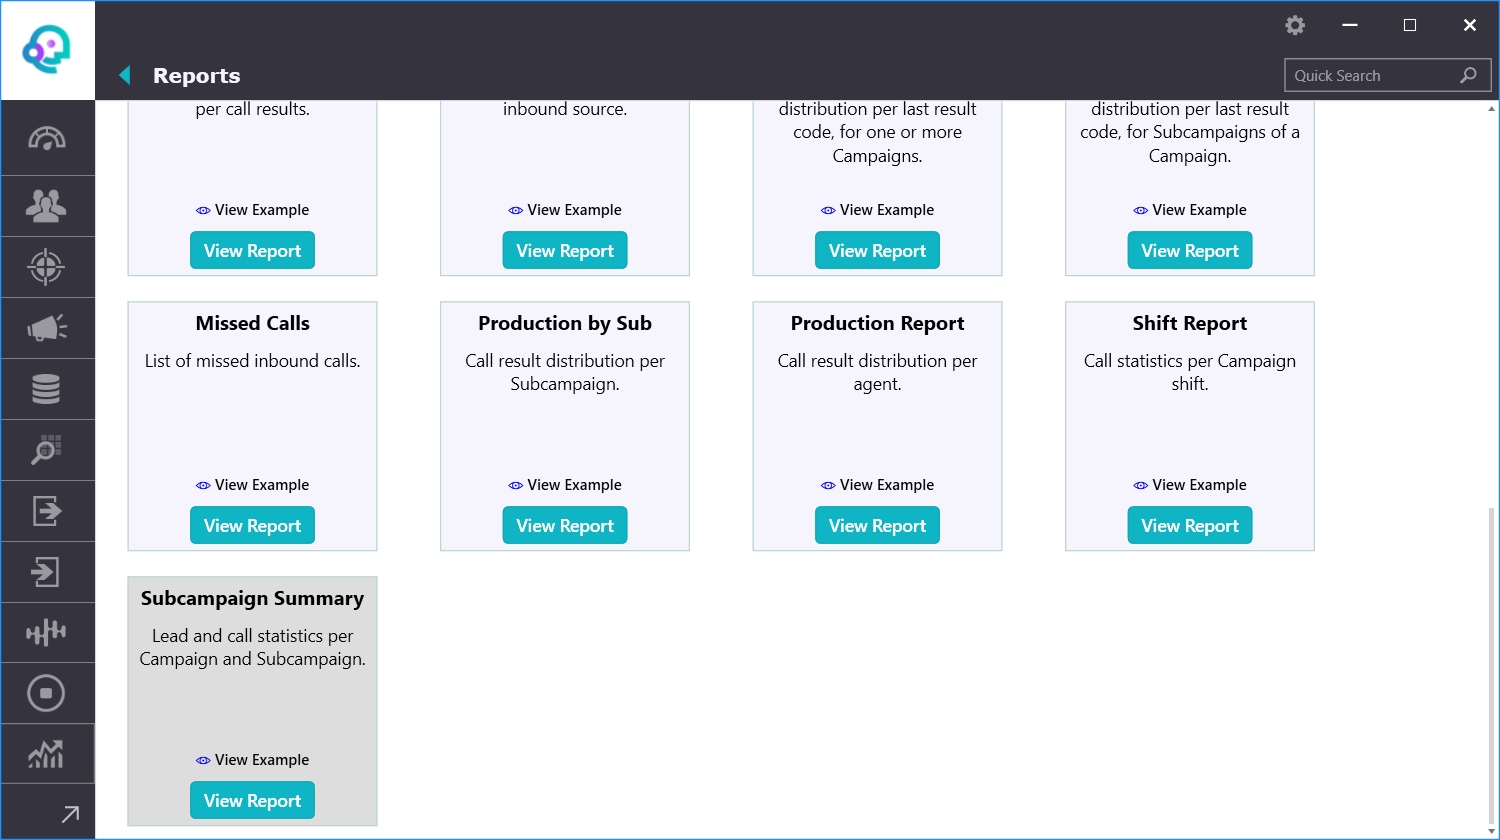
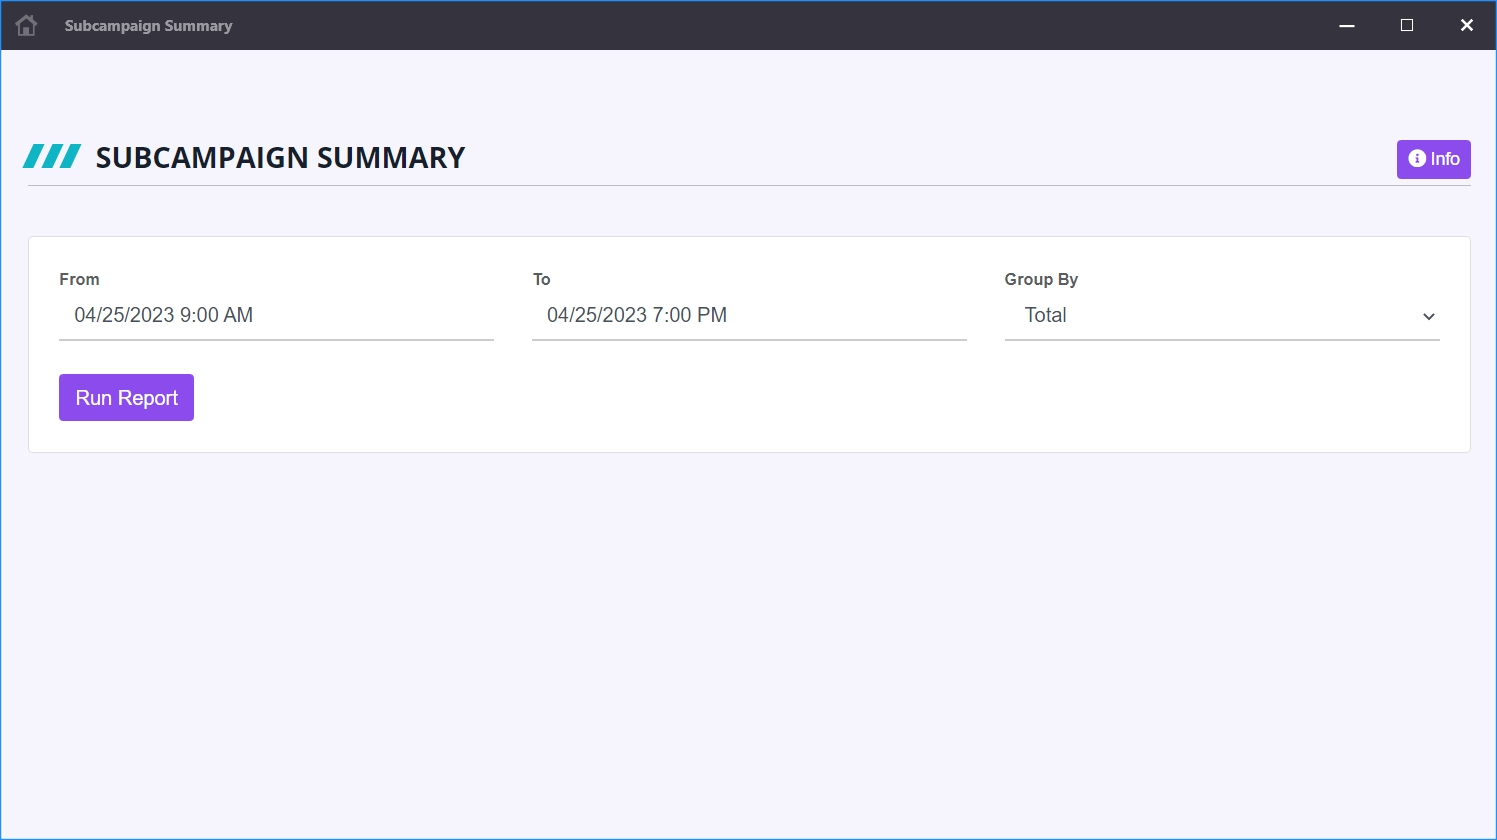
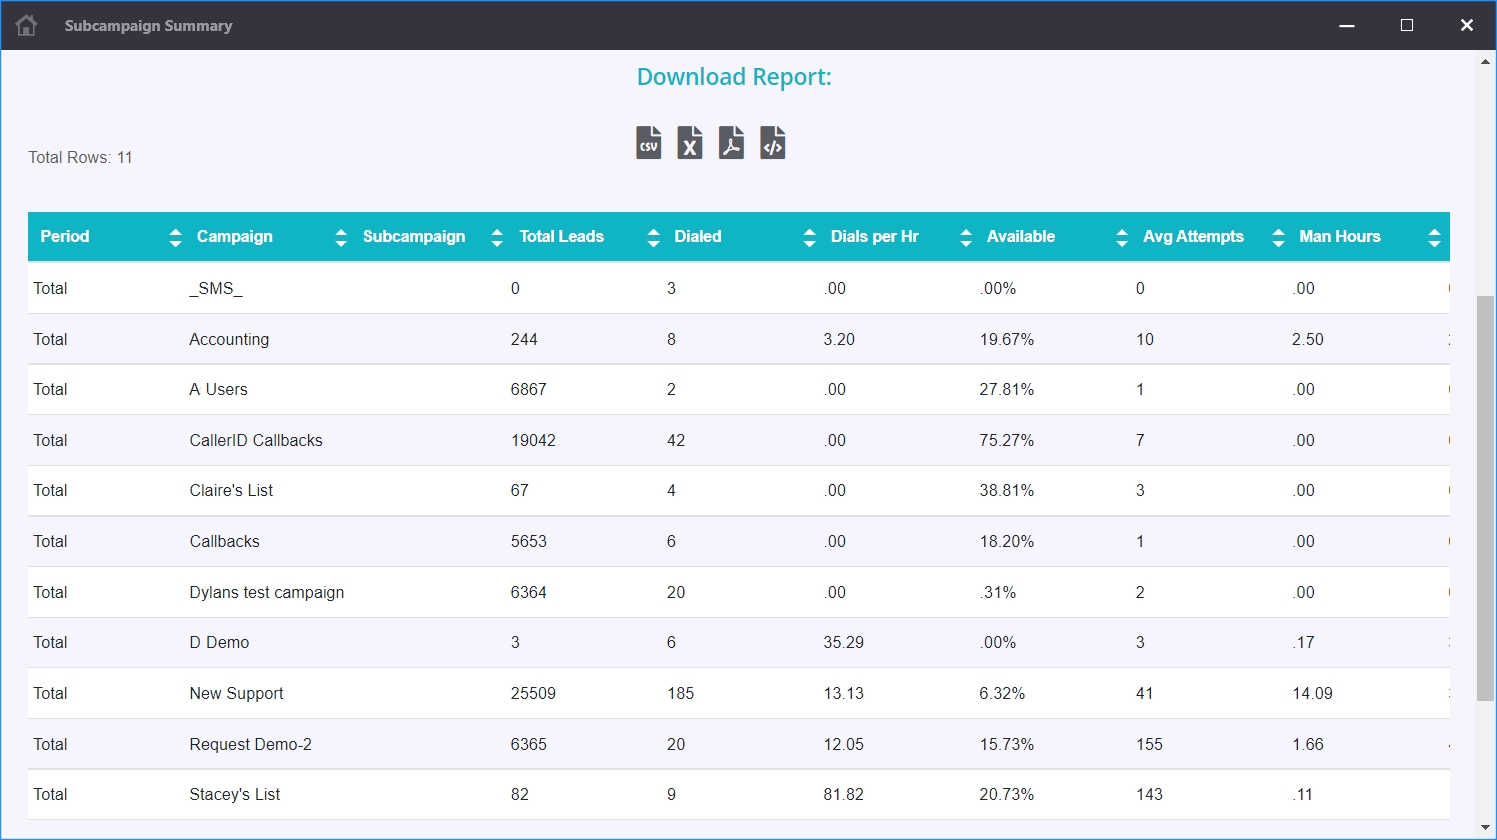
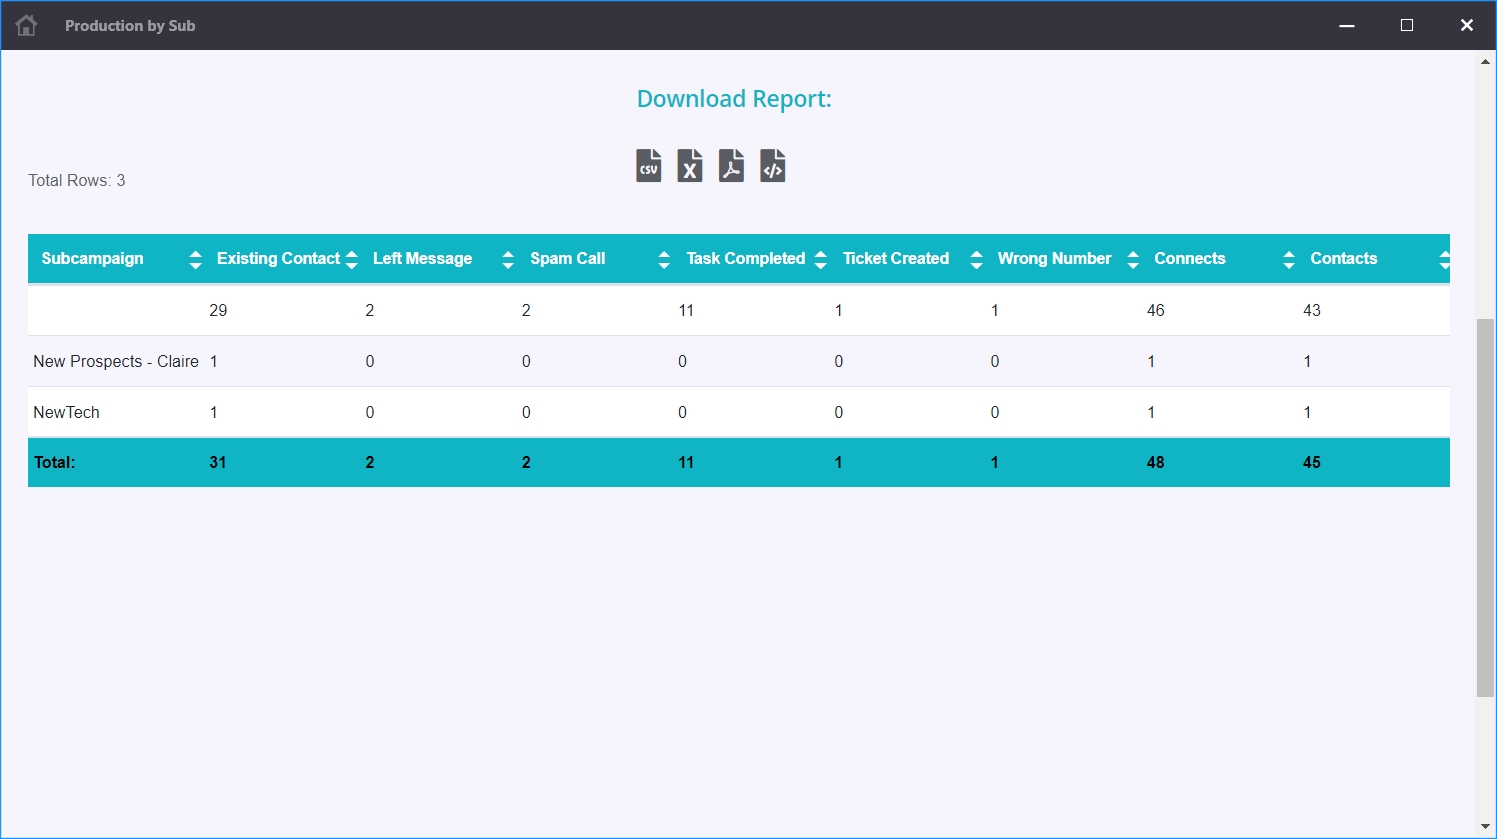
The purpose of this report is to summarize productivity of sub-campaigns based on call counts and results. This is similar to the Standard Production Report, but it summarizes data for sub-campaigns instead of agents.

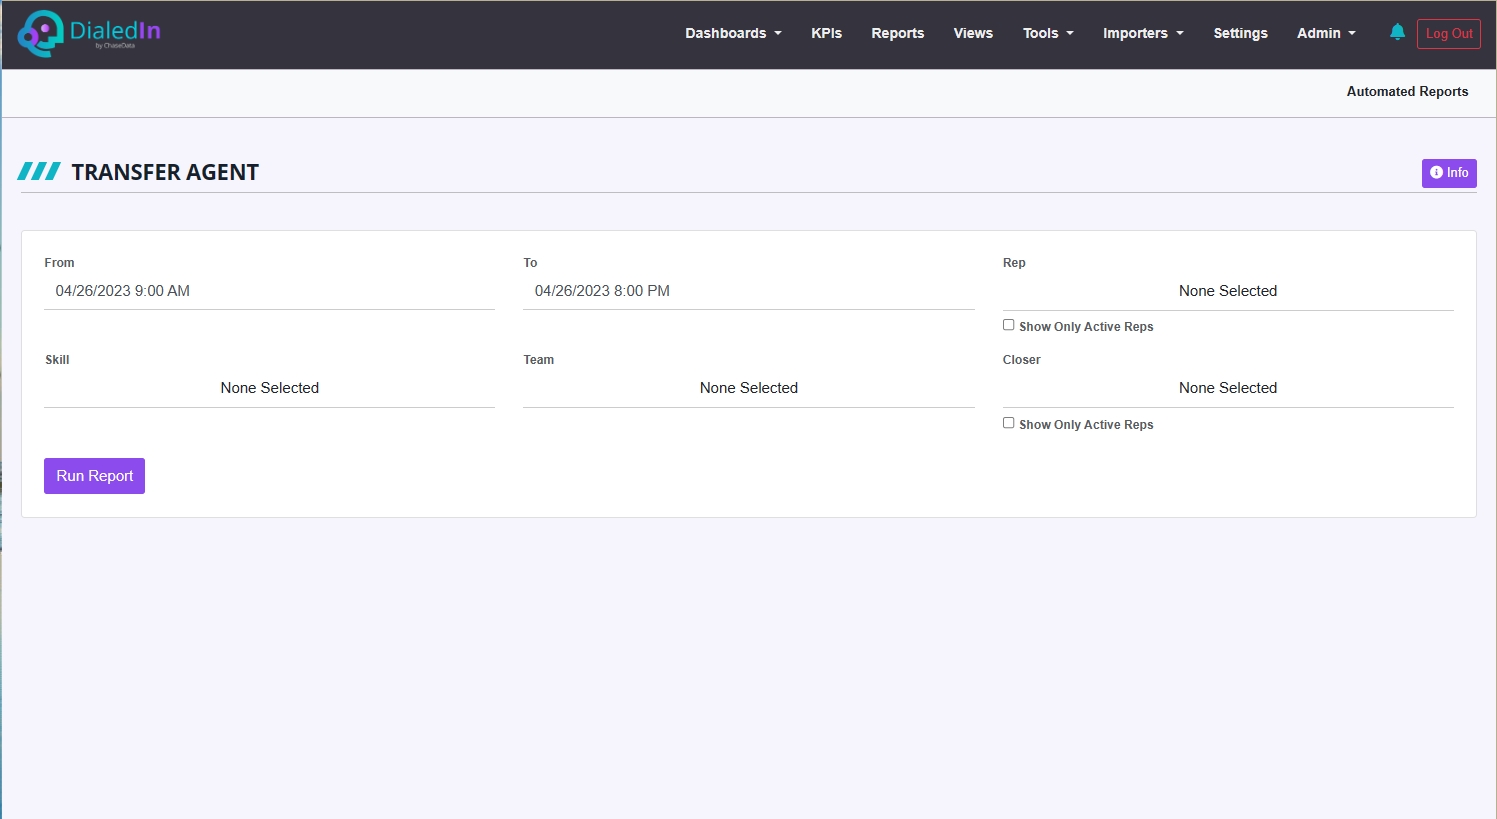
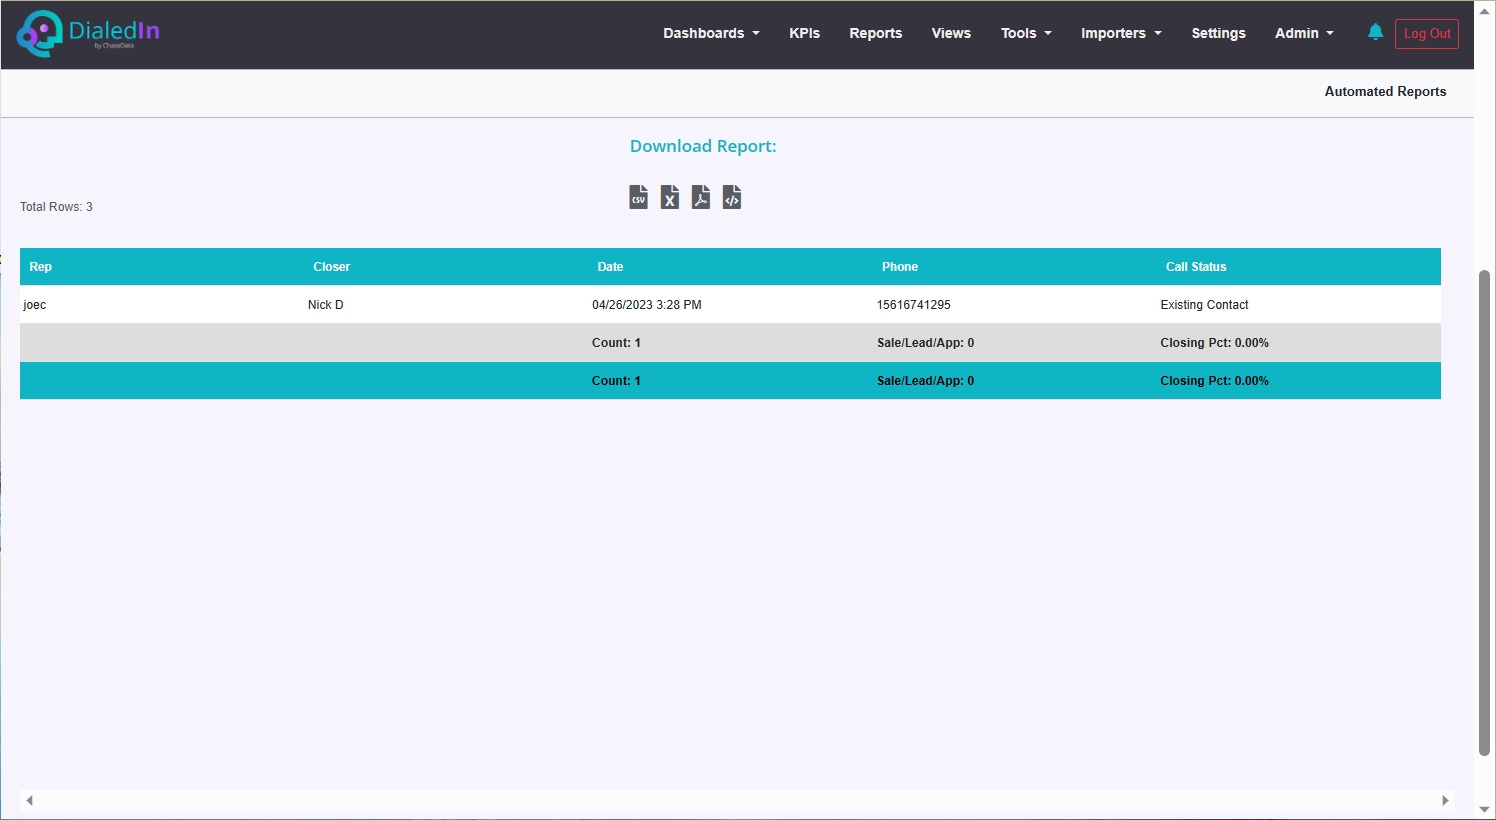
The purpose of this report is to show calls that were first handled by one agent and transferred to another one. Usually, these direct transfers are performed as part of a sale closing attempt, therefore the agent to whom the call is transferred is referred to as the Closer; for the same reason, the report includes whether the call resulted in a Sale, as this provides indication of the effectiveness of a Closer.
The purpose of this report is to provide a summary on number of contacts (leads) for one or more campaigns. The summary provides a count per contact/lead status (last call status), and provides a total of all contacts/leads included in the report (for selected campaign(s) and any filter used), as well as the total of available leads in those campaigns; this number is unaffected by filters since it represents all contacts/leads in the selected campaign(s) that have not being called and that can be called.
The purpose of this report is to provide a summary on number of contacts (leads) for a single sub-campaign.